Master Charts Trading - Stock Market Indicators & Trade Alerts
Connect To Us!
  • MasterChartsTrading
  • Blog
  • Sign-Up
  • Members
    • Elite Trading Blog
    • Stock Speculator Blog
    • Training Library >
      • Basics of Trading
      • Risk & Trading Psych
      • Trend Identification
  • Help
    • Hall of Fame
    • Social
    • About Us
    • Contact
    • FAQs
    • Disclaimer
    • Refund Policy
    • Privacy Policy
    • What We Trade
    • Newsletter samples

Insert Dramatic Title

3/27/2014

0 Comments


Wednesday, March 26, 2014

           (Insert Dramatic Title)

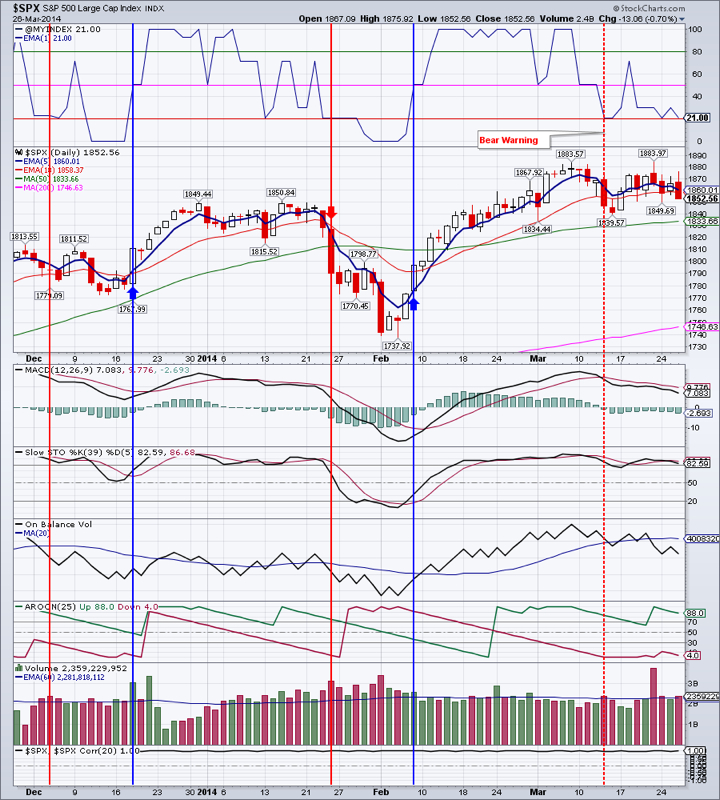
  Many financial publications' headlines today highlighted the fact that both the NASDAQ and the Russell 2000 Small Cap indices closed below their 50 day moving average (DMA) and lost 1.43% and 1.92% respectively. This was on heavy volume. If that's not enough to kindle fear in the heart of a technical trader, they printed long red candlesticks and closed on, or very close to the day's lows.  Large cap Standard and Poor 500 and the Dow Jones Industrial Average fared slightly better, only loosing 0.7% and 0.6%.

  Market Breadth Index ($VMBI) deteriorated further. It is now barely in the territory where we are still holding a very small amount of equities. Today we further reduced our equity allocation and...

  ...Increased our TLT allocation. TLT gained about ¾ of a percent on decent volume, most importantly though, it closed above the February 1st high. Should this breakout hold through Friday, we could easily see prices in the $115-116 area. This would be bearish for stocks.

  EEM ran into resistance (as expected) around $40. There is just not enough momentum in the emerging markets yet. A close above $40.22 is needed, preferably on a Friday basis, to get us interested in the emerging markets again.

  Gold continued its downward slide. It is certainly not done correcting and prices as low as $1260 could be seen shortly. Should gold turn around after reaching that area, it could be a very nice buying opportunity.

  GDX had a nasty day as well. We have pared our GDX holdings. Should GDX fall through $23, next support is around $21.50.

  IYR is looking precarious again. A close below $65.89 would be bearish and a retest of 200 DMA, currently at $63.99 would be likely. We took profits to lock in gains on part of the holdings.

  Natural gas is drifting sideways. As we mentioned before, we have a bearish bias, but it may rebound to around $4.50-4.80.

  Oil may have possibly made a turnaround. It gained a little over 1% on a bullish candlestick. Should it close above the 200 DMA, the rising wedge/bearish flag scenario we talked about may be called into question. A close below $97.55 would continue this slide down to at least $95, but probably $91 area.

  Bottom line: Even though our market commentary title may sound tongue-in-cheek, today's declines should be taken seriously.


  Open positions: GDX (reduced), IYR (reduced), TLT (increased), DVY (reduced), ETV (reduced)

  Hedging positions: SDOW, TZA, DGAZ

Picture
Ready to trade? Sign-up Today
0 Comments


Leave a Reply.

    Picture
    Picture

    Subscribe to our mailing list!

    * indicates required
    /* real people should not fill this in and expect good things - do not remove this or risk form bot signups */

    Intuit Mailchimp

    Click to set custom HTML
    Picture
    Picture

    Archives

    January 2025
    December 2024
    November 2024
    October 2024
    September 2024
    August 2024
    July 2024
    June 2024
    May 2024
    April 2024
    March 2024
    February 2024
    January 2024
    December 2023
    November 2023
    October 2023
    September 2023
    August 2023
    July 2023
    June 2023
    May 2023
    April 2023
    March 2023
    February 2023
    January 2023
    December 2022
    November 2022
    October 2022
    September 2022
    August 2022
    July 2022
    June 2022
    May 2022
    April 2022
    March 2022
    February 2022
    January 2022
    December 2021
    November 2021
    October 2021
    September 2021
    August 2021
    July 2021
    June 2021
    May 2021
    April 2021
    March 2021
    February 2021
    January 2021
    December 2020
    November 2020
    October 2020
    September 2020
    August 2020
    July 2020
    June 2020
    May 2020
    April 2020
    March 2020
    February 2020
    January 2020
    December 2019
    November 2019
    October 2019
    September 2019
    August 2019
    July 2019
    June 2019
    May 2019
    April 2019
    March 2019
    February 2019
    January 2019
    December 2018
    November 2018
    October 2018
    September 2018
    August 2018
    July 2018
    June 2018
    May 2018
    April 2018
    March 2018
    February 2018
    January 2018
    December 2017
    November 2017
    October 2017
    September 2017
    August 2017
    July 2017
    June 2017
    May 2017
    April 2017
    March 2017
    February 2017
    January 2017
    December 2016
    November 2016
    October 2016
    September 2016
    August 2016
    July 2016
    June 2016
    May 2016
    April 2016
    March 2016
    February 2016
    January 2016
    December 2015
    November 2015
    October 2015
    September 2015
    August 2015
    July 2015
    June 2015
    May 2015
    April 2015
    March 2015
    February 2015
    January 2015
    December 2014
    November 2014
    October 2014
    September 2014
    August 2014
    June 2014
    May 2014
    April 2014
    March 2014
    February 2014
    January 2014

    RSS Feed

  All information on MasterChartsTrading.com is for educational and entertainment purposes only, and should not be construed as a recommendation to buy, sell or sell-short said securities. Read full disclaimer.