Master Charts Trading - Stock Market Indicators & Trade Alerts
Connect To Us!
  • MasterChartsTrading
  • Blog
  • Sign-Up
  • Members
    • Elite Trading Blog
    • Stock Speculator Blog
    • Training Library >
      • Basics of Trading
      • Risk & Trading Psych
      • Trend Identification
  • Help
    • Hall of Fame
    • Social
    • About Us
    • Contact
    • FAQs
    • Disclaimer
    • Refund Policy
    • Privacy Policy
    • What We Trade
    • Newsletter samples

IWM Fails Mini-Upswing

5/7/2014

0 Comments


Tuesday, May 6, 2014

IWM Fails Mini-Upswing

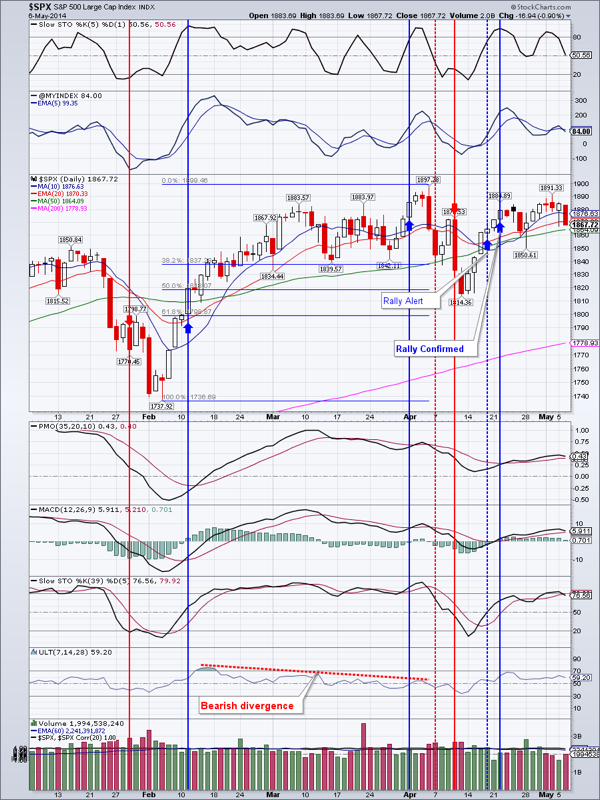
  Markets have run into resistance and closed lower. Market breadth was significantly negative. Small caps closed below the 200 day moving average (DMA) and our bullish argument may be coming into question.

  $SPX lost almost 1% and is currently at first support, I don’t think it will hold. Next support is at the 50 DMA (1804)

  DIA slightly weaker then SPX. Good support is at $162.78 

  IWM lost 1.63% and is likely now to break support at $108.66 

  QQQ lost over 1%. It is much stronger then IWM, but is likely headed down to the 200 DMA also

  TLT: 3rd inside day in a row. Get ready to see some strong movements…either up or down. First support is around $111

  Gold looks to be consolidating with an inside day a close above $1315.80 would be rather bullish

  GDX a close above $24.67, or better $25.34 would confirm a bullish breakout

  IYR is overbought and near the highs. I expect profit taking very soon

  EEM is attempting to continue its rally, but is having a hard time. Lower prices are likely first before we see higher prices.

Oil: more sideways action. A break below $97.55 would be bearish and a retest of January lows likely

  Natural gas: Sideways action with a bullish bias. A breakout above $4.85 would be rather bullish

  Open positions: IYR, TLT, EEM, DIA, NUGT, UGAZ

  Closed position: TNA

Picture
Ready to trade? Sign-up Today
0 Comments


Leave a Reply.

    Picture
    Picture
    Subscribe to our mailing list!
    Picture
    Picture

    Archives

    February 2023
    January 2023
    December 2022
    November 2022
    October 2022
    September 2022
    August 2022
    July 2022
    June 2022
    May 2022
    April 2022
    March 2022
    February 2022
    January 2022
    December 2021
    November 2021
    October 2021
    September 2021
    August 2021
    July 2021
    June 2021
    May 2021
    April 2021
    March 2021
    February 2021
    January 2021
    December 2020
    November 2020
    October 2020
    September 2020
    August 2020
    July 2020
    June 2020
    May 2020
    April 2020
    March 2020
    February 2020
    January 2020
    December 2019
    November 2019
    October 2019
    September 2019
    August 2019
    July 2019
    June 2019
    May 2019
    April 2019
    March 2019
    February 2019
    January 2019
    December 2018
    November 2018
    October 2018
    September 2018
    August 2018
    July 2018
    June 2018
    May 2018
    April 2018
    March 2018
    February 2018
    January 2018
    December 2017
    November 2017
    October 2017
    September 2017
    August 2017
    July 2017
    June 2017
    May 2017
    April 2017
    March 2017
    February 2017
    January 2017
    December 2016
    November 2016
    October 2016
    September 2016
    August 2016
    July 2016
    June 2016
    May 2016
    April 2016
    March 2016
    February 2016
    January 2016
    December 2015
    November 2015
    October 2015
    September 2015
    August 2015
    July 2015
    June 2015
    May 2015
    April 2015
    March 2015
    February 2015
    January 2015
    December 2014
    November 2014
    October 2014
    September 2014
    August 2014
    June 2014
    May 2014
    April 2014
    March 2014
    February 2014
    January 2014

    RSS Feed

  All information on MasterChartsTrading.com is for educational and entertainment purposes only, and should not be construed as a recommendation to buy, sell or sell-short said securities. Read full disclaimer.