Master Charts Trading - Stock Market Indicators & Trade Alerts
Connect To Us!
  • MasterChartsTrading
  • Blog
  • Sign-Up
  • Members
    • Elite Trading Blog
    • Stock Speculator Blog
    • Training Library >
      • Basics of Trading
      • Risk & Trading Psych
      • Trend Identification
  • Help
    • Hall of Fame
    • Social
    • About Us
    • Contact
    • FAQs
    • Disclaimer
    • Refund Policy
    • Privacy Policy
    • What We Trade
    • Newsletter samples

Market Breadth Has Not Improved

3/26/2014

0 Comments


Tuesday, March 25, 2014

Market Breadth Has Not Improved.

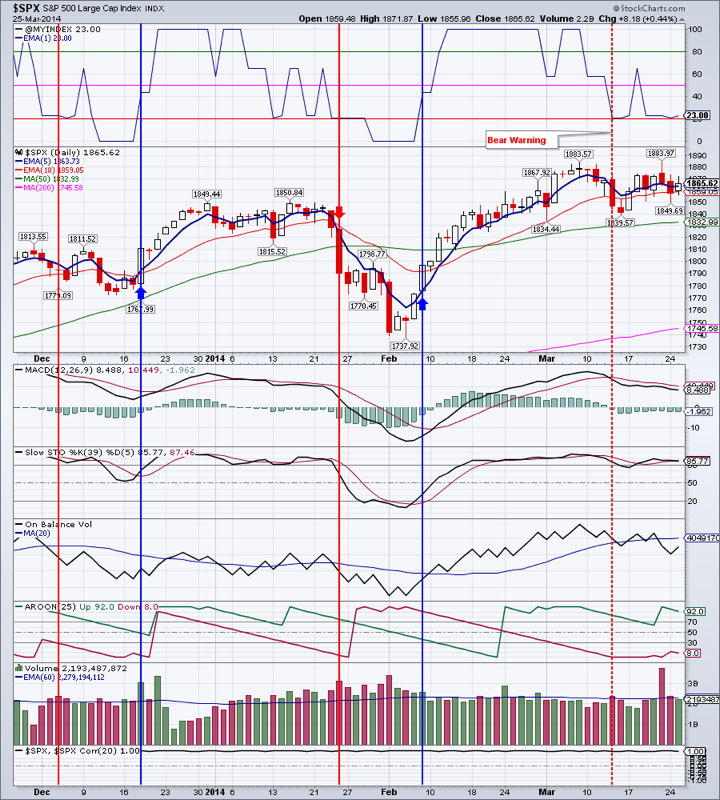
  This market upswing that started February 5th, is likely coming to an end. Sideways action may continue for a while longer, but the markets need to flush out the “weak hands”, re-test the 50 day moving average (DMA) and renew the push higher. Market is bullish - no doubt about it.

  Market breadth has been steadily deteriorating since the end of February. Our Market Breadth Index, the $VMBI, is barely positive and we are in a Bear Warning. We are certainly not increasing our equity allocation now. On the contrary, we have been steadily selling into strength and buying bonds.

  TLT has done extremely well since the beginning of 2014, gaining over 8%. A close above $109.18, preferably on a weekly basis would likely cause a run-up to the $117 area.

  IYR seems to be consolidating with a bearish bias, but there is decent support in the $65.89 area. A close over $68.54 would continue this rally.

  EEM has been on a tear for the past 4 trading sessions gaining over 4 percent. The acid test comes now. Will it close above the 200 DMA and hold? Should EEM breakout above $40.22, we will once again become interested in emerging markets.

  Gold is correcting into the Fibonacci retracement area of 38.2-61.8%. This is a rather large area as you can see, but keep in mind that gold has been in a steady uptrend since late last year, without a single correction. So a retracement into the $1261-1312 area is healthy before the next leg-up. We are currently at the 38 percent retracement. The good news is that gold just had a Golden Cross occur on its chart. This happens when the 50 DMA crosses above the 200 DMA - a bullish development.

  Natural Gas, as we mentioned was very oversold and rebounded over 2%. Rebound is likely to continue at least to $4.54 area. We took profits on our DGAZ position yesterday.

  Oil seems to be etching out a rising wedge/flag, which is a bearish pattern. As we have pointed out before, we expect lower prices ahead for oil. A retest of January low is likely.


Open positions: GDX, IYR, TLT, DVY (very small position), ETV (very small position)

Hedging positions: SDOW, TZA, DGAZ (took profits)

Picture
Ready to trade? Sign-up Today
0 Comments


Leave a Reply.

    Picture
    Picture

    Subscribe to our mailing list!

    * indicates required
    /* real people should not fill this in and expect good things - do not remove this or risk form bot signups */

    Intuit Mailchimp

    Click to set custom HTML
    Picture
    Picture

    Archives

    January 2025
    December 2024
    November 2024
    October 2024
    September 2024
    August 2024
    July 2024
    June 2024
    May 2024
    April 2024
    March 2024
    February 2024
    January 2024
    December 2023
    November 2023
    October 2023
    September 2023
    August 2023
    July 2023
    June 2023
    May 2023
    April 2023
    March 2023
    February 2023
    January 2023
    December 2022
    November 2022
    October 2022
    September 2022
    August 2022
    July 2022
    June 2022
    May 2022
    April 2022
    March 2022
    February 2022
    January 2022
    December 2021
    November 2021
    October 2021
    September 2021
    August 2021
    July 2021
    June 2021
    May 2021
    April 2021
    March 2021
    February 2021
    January 2021
    December 2020
    November 2020
    October 2020
    September 2020
    August 2020
    July 2020
    June 2020
    May 2020
    April 2020
    March 2020
    February 2020
    January 2020
    December 2019
    November 2019
    October 2019
    September 2019
    August 2019
    July 2019
    June 2019
    May 2019
    April 2019
    March 2019
    February 2019
    January 2019
    December 2018
    November 2018
    October 2018
    September 2018
    August 2018
    July 2018
    June 2018
    May 2018
    April 2018
    March 2018
    February 2018
    January 2018
    December 2017
    November 2017
    October 2017
    September 2017
    August 2017
    July 2017
    June 2017
    May 2017
    April 2017
    March 2017
    February 2017
    January 2017
    December 2016
    November 2016
    October 2016
    September 2016
    August 2016
    July 2016
    June 2016
    May 2016
    April 2016
    March 2016
    February 2016
    January 2016
    December 2015
    November 2015
    October 2015
    September 2015
    August 2015
    July 2015
    June 2015
    May 2015
    April 2015
    March 2015
    February 2015
    January 2015
    December 2014
    November 2014
    October 2014
    September 2014
    August 2014
    June 2014
    May 2014
    April 2014
    March 2014
    February 2014
    January 2014

    RSS Feed

  All information on MasterChartsTrading.com is for educational and entertainment purposes only, and should not be construed as a recommendation to buy, sell or sell-short said securities. Read full disclaimer.