Monday, April 21, 2014
Market Breadth Signals More Upside.
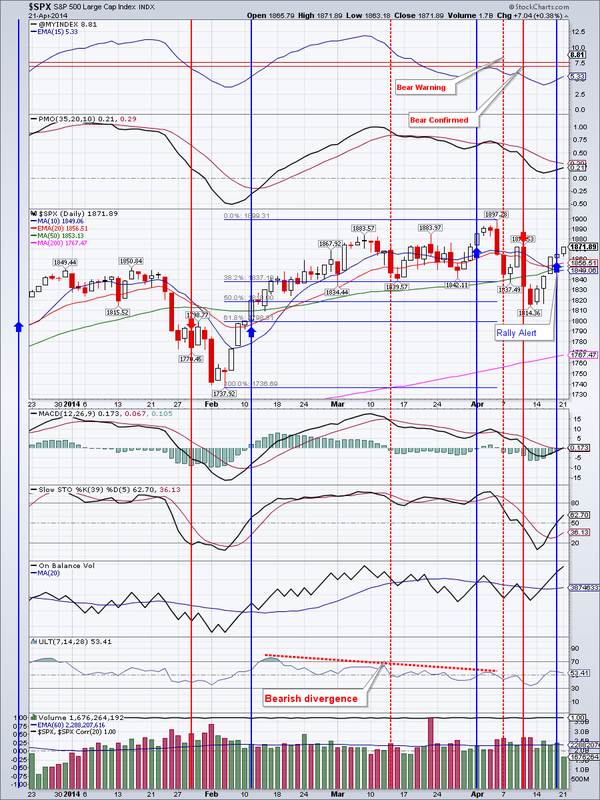
Major indices gained today, although the volume was way below average. Markets lack strong conviction.
Market breadth is improving steadily and return to a bull phase could be just one or two positive days away. We have added to our longs by opening a position in QQQ.
TLT so far did not confirm the bearish engulfing pattern from Thursday, but it did have an inside day. A close below $109.70 would be bearish. Alternatively, a close above $111.45 would continue the uptrend in treasuries that started in late December.
EEM had an inside day as well. The MACD is negative while OBV and PMO are rolling over. A close below $42.01 would further my call for a revisit of $39-40 area. This revisit should be a nice buying opportunity once buying has resumed.
The following points are regarding Gold:
First the positives.
a. It may have found support in the $1290 area
b. This support is within the 38-62% Fibonacci retracement zone from its May 17 peak
c. Gold is short-term oversold
The negatives:
a. Gold broke the rising wedge formation with a sharp decline on April 15.
b. All momentum oscillators (MACD, PMO, Stochastic) are negative
c. On Balance volume is making lower peaks and troughs
Should gold close below its April 1 low at $1277.40, I believe a flood of selling would occur and prices may retest the December lows
GDX may have found a temporary support today and printed a hammer candlestick. Since it did not close below $23.27, we did not add to our open DUST position.
IYR is pushing higher and the momentum is bullish.
Oil had a second inside day in a row. This action usually precedes a strong move ... either up or down. First support is at $103.34
Natural gas looks bullish, but closed below the 50 DMA today. It may be developing into a bullish flag formation with the last Thursday's long white candlestick as the flagpole. Next several days should confirm Thursday's breakout.
Open positions: TLT, IYR, EEM, DIA (added to position), TNA (added to position), QQQ (new position)
Hedging positions: DUST
Bottom line: Markets are rebounding and we added to our longs
Market Breadth Signals More Upside.
Major indices gained today, although the volume was way below average. Markets lack strong conviction.
Market breadth is improving steadily and return to a bull phase could be just one or two positive days away. We have added to our longs by opening a position in QQQ.
TLT so far did not confirm the bearish engulfing pattern from Thursday, but it did have an inside day. A close below $109.70 would be bearish. Alternatively, a close above $111.45 would continue the uptrend in treasuries that started in late December.
EEM had an inside day as well. The MACD is negative while OBV and PMO are rolling over. A close below $42.01 would further my call for a revisit of $39-40 area. This revisit should be a nice buying opportunity once buying has resumed.
The following points are regarding Gold:
First the positives.
a. It may have found support in the $1290 area
b. This support is within the 38-62% Fibonacci retracement zone from its May 17 peak
c. Gold is short-term oversold
The negatives:
a. Gold broke the rising wedge formation with a sharp decline on April 15.
b. All momentum oscillators (MACD, PMO, Stochastic) are negative
c. On Balance volume is making lower peaks and troughs
Should gold close below its April 1 low at $1277.40, I believe a flood of selling would occur and prices may retest the December lows
GDX may have found a temporary support today and printed a hammer candlestick. Since it did not close below $23.27, we did not add to our open DUST position.
IYR is pushing higher and the momentum is bullish.
Oil had a second inside day in a row. This action usually precedes a strong move ... either up or down. First support is at $103.34
Natural gas looks bullish, but closed below the 50 DMA today. It may be developing into a bullish flag formation with the last Thursday's long white candlestick as the flagpole. Next several days should confirm Thursday's breakout.
Open positions: TLT, IYR, EEM, DIA (added to position), TNA (added to position), QQQ (new position)
Hedging positions: DUST
Bottom line: Markets are rebounding and we added to our longs


 RSS Feed