|
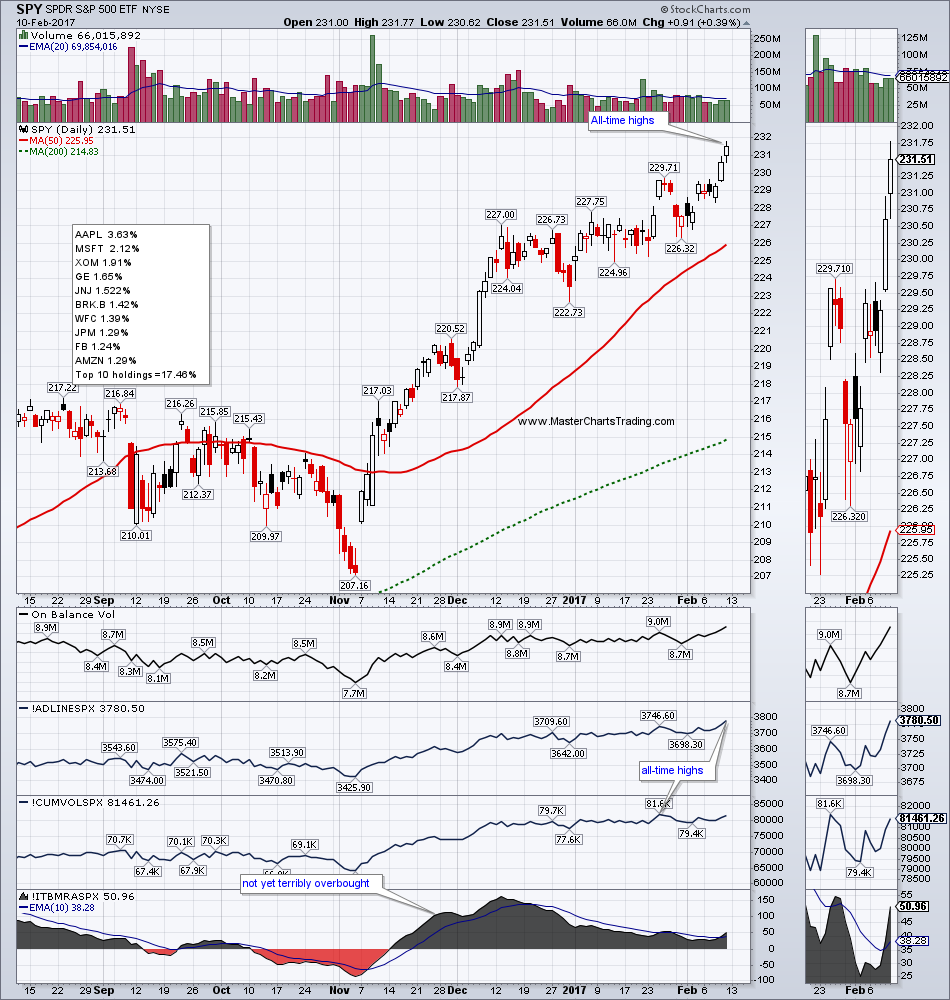
Dow Jones Industrial Average, S&P 500 and NASDAQ-100 – break to all-time highs
Stock market is ripe for a pullback, but very bullish Small Caps may outperform going forward| No major divergences in the AD-Lines Technology, Financials, Discretionary hit all-time highs | Industrials close at ATHs Health Care, Staples, Real Estate, and Utilities are playing catch-up | Recent trade – EEM – Emerging Markets ETF Junk bonds pause at all-time highs | Treasuries & Investment-grade bonds could move higher & put pressure on stocks US Dollar showing definite signs of an intermediate bottom (Euro, Pound, Yen, Canadian Dollar and Swedish Krona covered in this week’s Forex analysis) Gold gains for the week – looking for signs of a failure in this rally Where are the short stops hidden for GDX (Gold miners)? Energy (XLE) attempting to bottom | Oil again frustrates both bulls and bears Natural gas attempting to stabilize (still bullish long-term) Most of the charts mentioned in this video are located here: stockcharts.com/public/1229503 |
Watch this video on YouTube!
|
Market Recap: February 10, 2017 - SPY DIA QQQ XLV XLP XLF XLU TLT LQD UUP GLD GDX USO XLE UNG2/11/2017 Ready to trade? Sign-up Today
1 Comment
amazing Right side fo the chart complete opposite view for 2 or 3 months I think every one lost lost money always pointing out the diversion on the ppo and macd 60 min day chart qqq iwm spy watch video see what you think Right Side of the Chart has posted a new item, 'Market Update: SPY, QQQ, IWM,
Reply
Leave a Reply. |
Archives
July 2024
|


 RSS Feed