|
*Programming note! We will now have (hopefully) a regular blog and video input from my wife Marie Felberg, who is a practicing clinical psychologist and a life coach! As you have undoubtedly learned the hard way, emotional control is of paramount importance to traders. Her coaching methods are very effective in helping traders keep the emotions in check, manage risk, and improve profitability. Check out Dr. Marie Felberg, Psychologist/Life Coach site! |
|
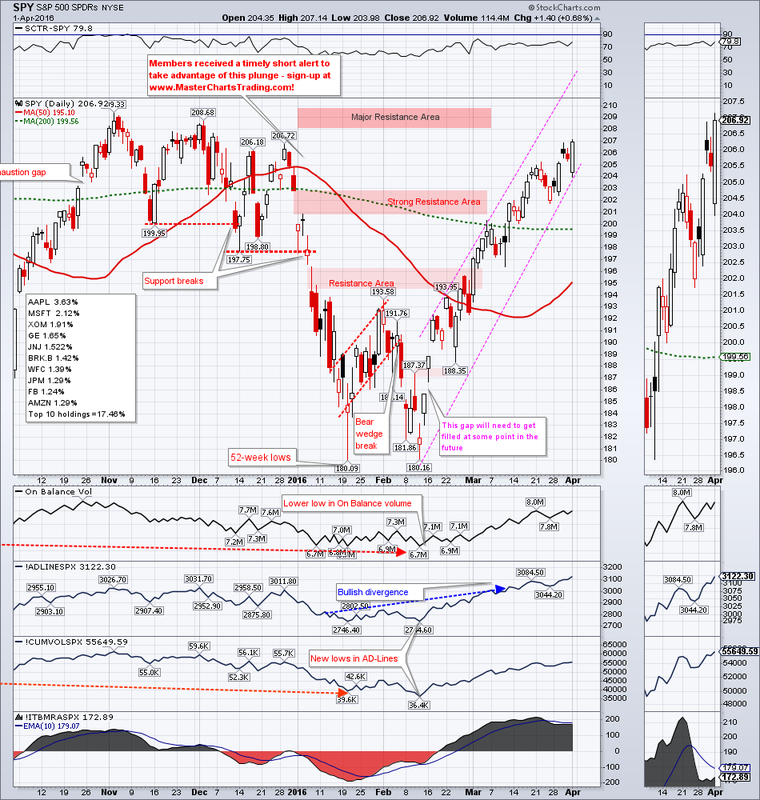
Stocks (SPY) were able to close all gaps remaining next to the all-time highs. No gaps for SPY remain above the current levels. We have to give credit where credit is due: this 15% rally off the 52-week lows was indeed impressive. Having said this, I still think that this rally is a counter-trend one. My long-term model (MBI) has flipped into the bear mode as early as September of last year and is yet to even begin improving.
It is, however, one thing to have the model tell you to go ahead and look for shorting opportunities, and a completely another one to time a short entry. So far all attempts by the bears to regain control of the tape have ended in tears. As SPY approaches previous peaks in the $207-$209 area will the bears finally succeed in regaining momentum?
CHART OF SPY
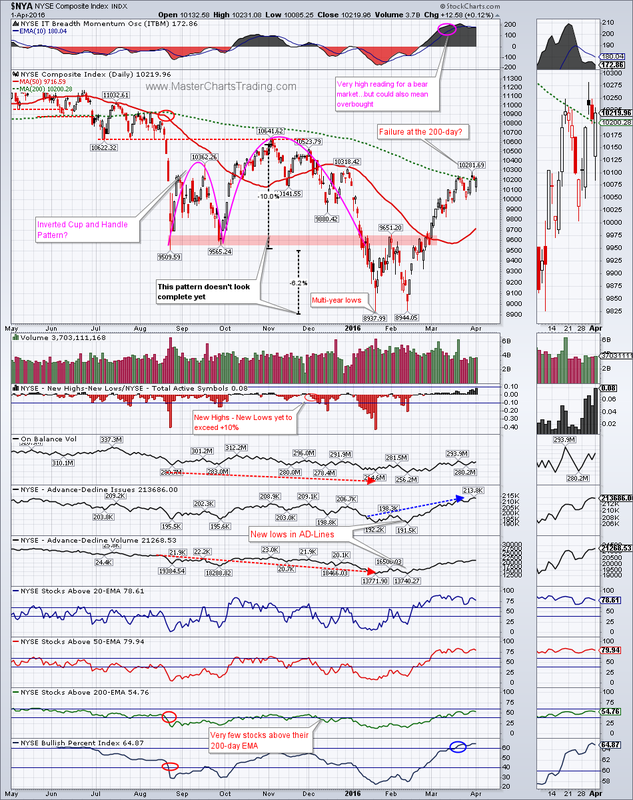
Market breadth improved further especially for the long-term breadth indicators. Percent of NYSA stocks above the 200-day EMA now stands at an “astonishing” 54.76%. The Bullish Percent index for NYSA is above 60%, so that is a good sign.
One thing that has been sorely lacking from this rally is volume. I follow two important volume-based indicators: the Advance-Decline Volume Line and the On Balance volume. Both failed to break out above previous peaks from November. If they did, I would have been much more bullish by now. This could all change at any time and we must keep an open mind about all outcomes.
CHART OF $NYA
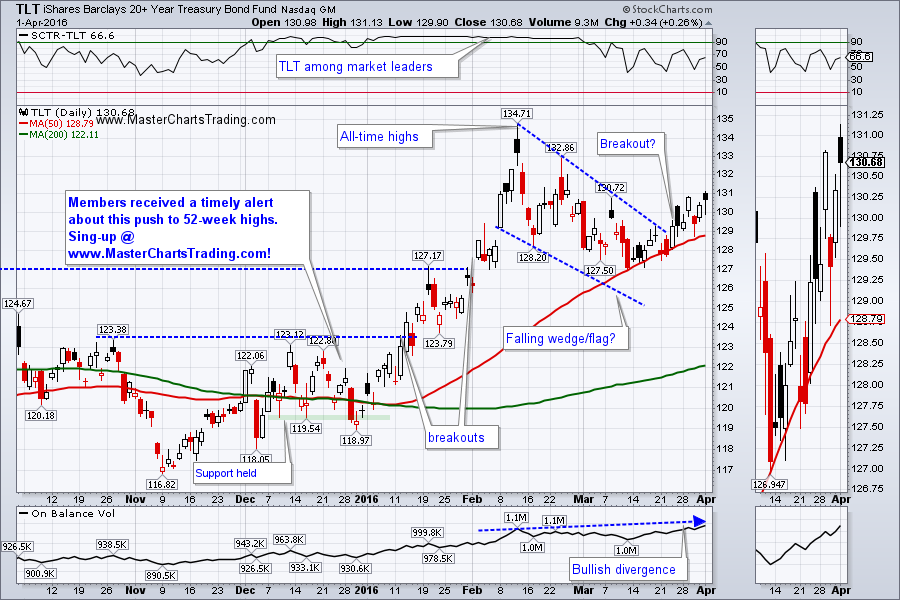
Perhaps the most telling fact that furthers my bearish posture is the fact that bonds have been getting a strong bid in the recent weeks to month. Mid-March TLT came all the way down to its breakout levels around $127, held support there and bounced higher. Another positive thing going for TLT is the On Balance volume just broke out above its February peak. This is a bullish divergence and is suggestive of higher prices ahead for TLT.
CHART OF TLT
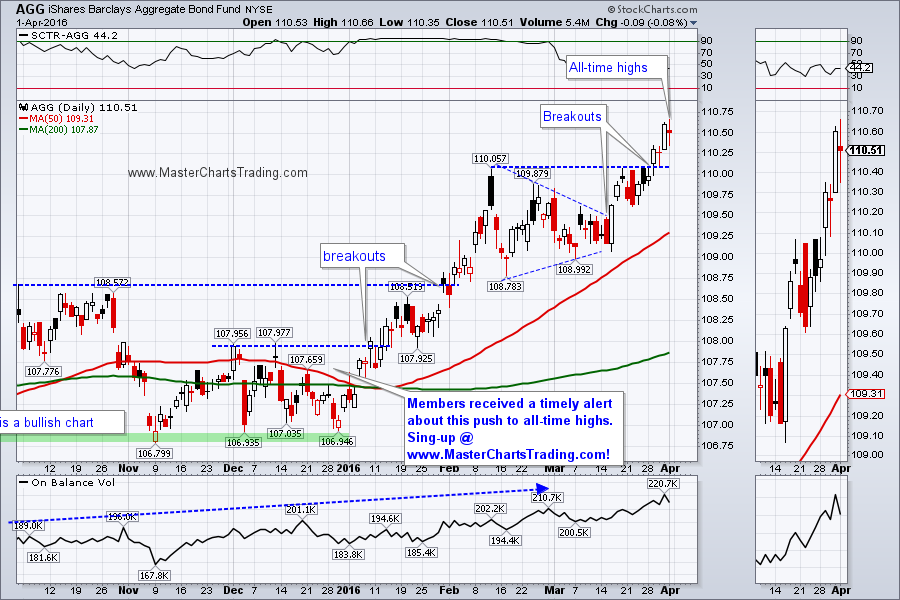
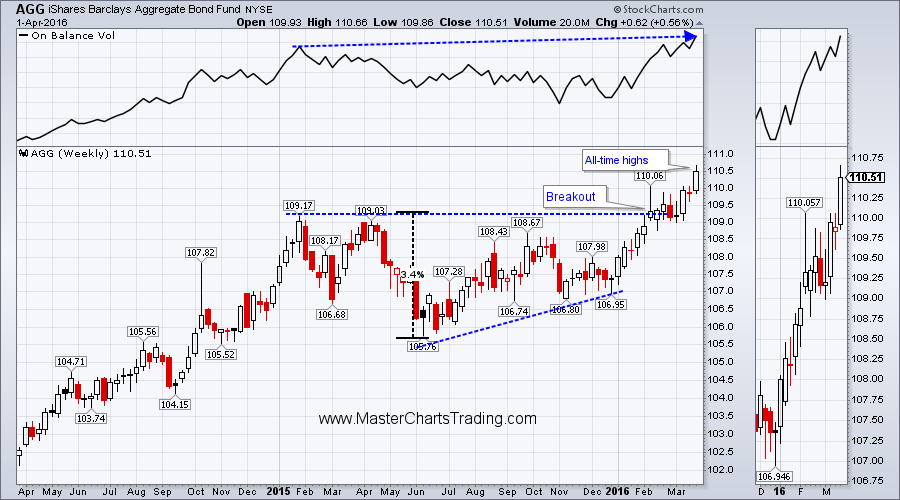
Similar patterns are evident on the chart of AGG as it hit all-time highs just this Friday.
CHART OF AGG
LONG-TERM CHART OF AGG
CHART OF TLT
Similar patterns are evident on the chart of AGG as it hit all-time highs just this Friday.
CHART OF AGG
LONG-TERM CHART OF AGG
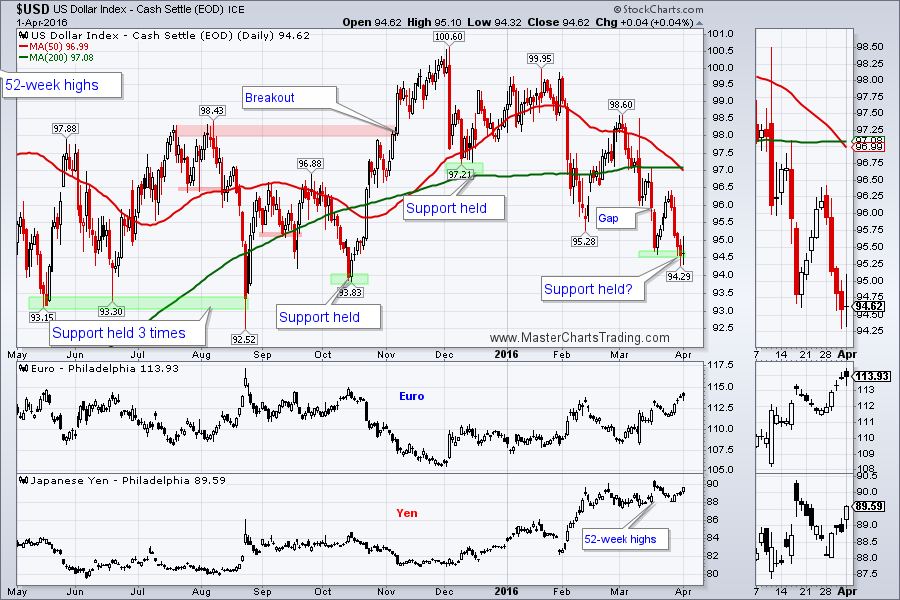
The Dollar index (DXY/USD) has been under sustained pressure for the past few months and finally dropped to an important support level of $94. It is very important for it to hold here.
CHART OF $USD
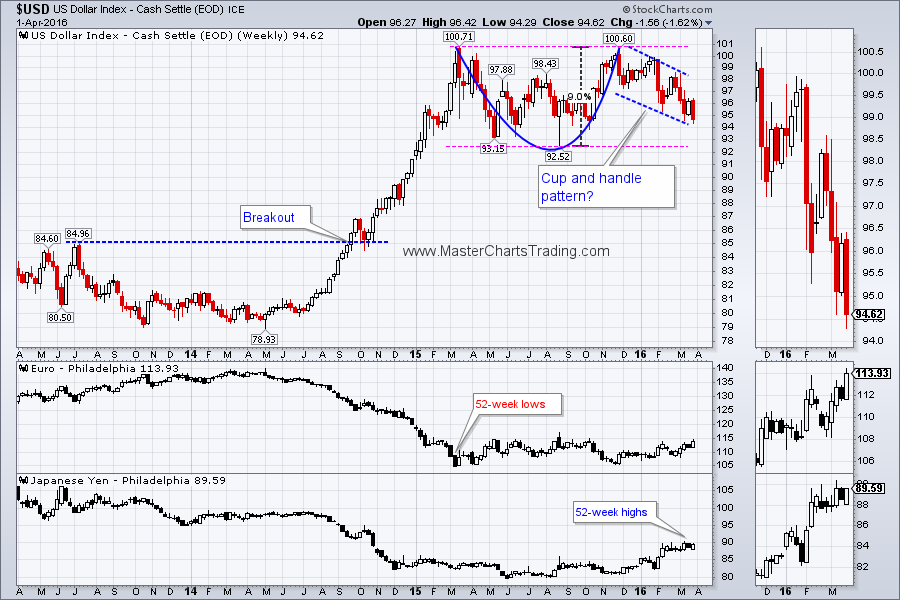
On the weekly chart, DXY is currently at the bottom of the falling channel defined by the “handle” of the Cup and Handle formation. This would be a good place for DXY to rally. Should it fail here, a retest of the all-important 92.52 support leel would almost be guaranteed.
LONG-TERM CHART OF $USD
CHART OF $USD
On the weekly chart, DXY is currently at the bottom of the falling channel defined by the “handle” of the Cup and Handle formation. This would be a good place for DXY to rally. Should it fail here, a retest of the all-important 92.52 support leel would almost be guaranteed.
LONG-TERM CHART OF $USD
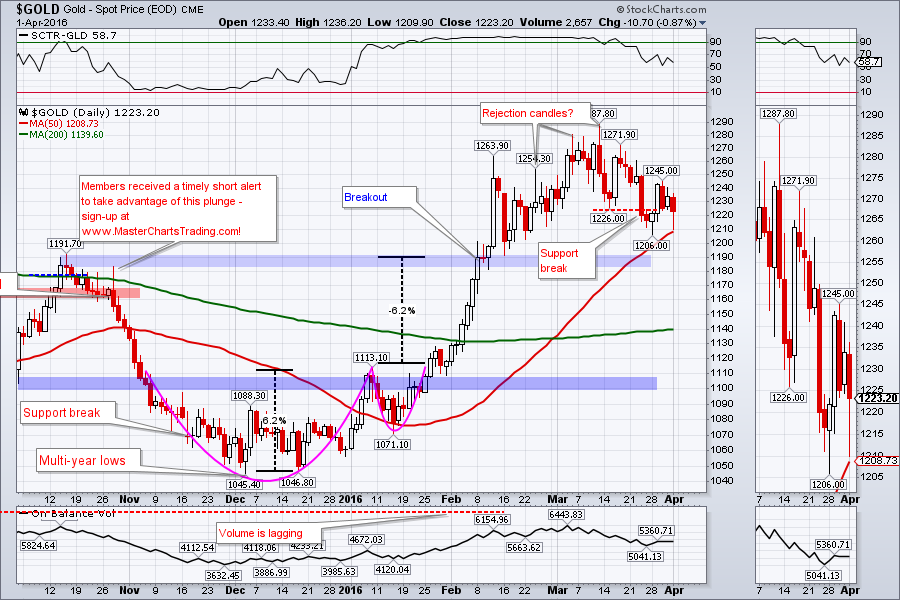
So far gold was unable to capitalize on the sharper cheaper dollar and gained only ½ percent this week. Few weeks ago I mentioned that my long-term gold model (GBI) has flipped into a bull market and I am now looking to buy gold and to trade it on the upside. Gold needs to correct quite a bit more for me to become interested and the retest of its recent breakout could be upon us soon. $1191 is the level to watch.
GOLD CHART
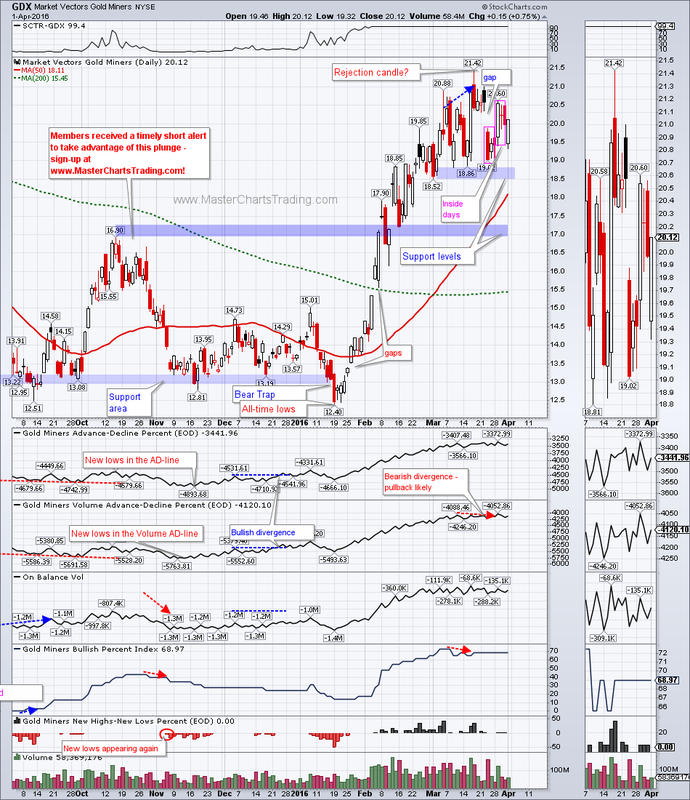
GDX is similarly bouncing around near the recent peaks. We had two Inside Days recently. One of them resolved to the upside, while the other one hasn’t resolved yet. If gold decides to go down, GDX would surely follow. I am watching the $18.50 level for a support break. If that gives, we could see a breakdown further to the $16.90 levels.
CHART OF GDX
GOLD CHART
GDX is similarly bouncing around near the recent peaks. We had two Inside Days recently. One of them resolved to the upside, while the other one hasn’t resolved yet. If gold decides to go down, GDX would surely follow. I am watching the $18.50 level for a support break. If that gives, we could see a breakdown further to the $16.90 levels.
CHART OF GDX
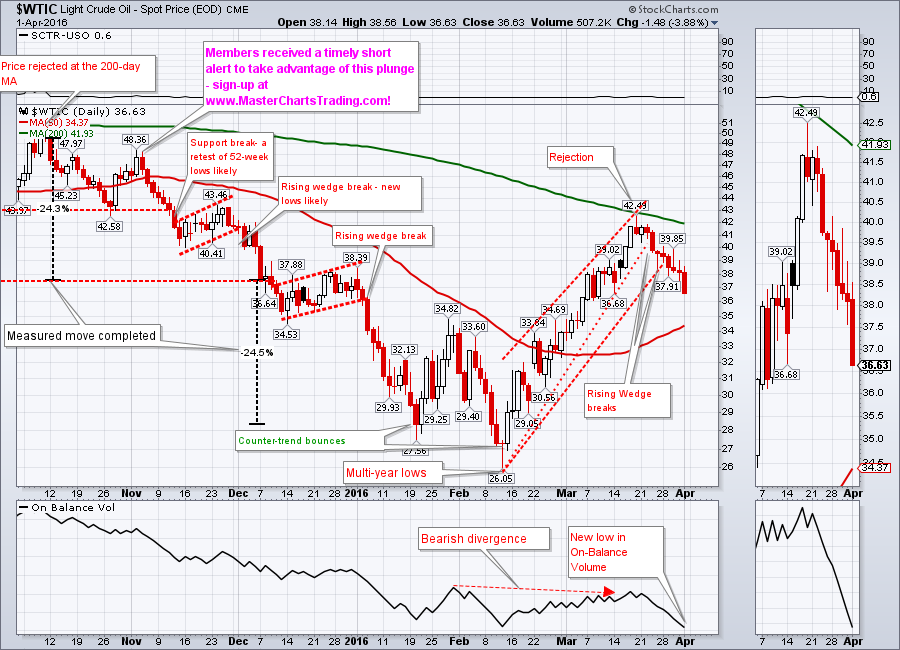
Oil is down over 13% from its recent peak at $42.49. Long-term picture remains bearish, while in the short-term we just saw two possible configurations of wedge breaks on oil chart. We may see a consolidation and an attempt to regain the $40 level, but I think the long-term and the short-term trends are now down again. There could be some support around $34.80 level, but a retest of multi-year lows cannot be ruled out.
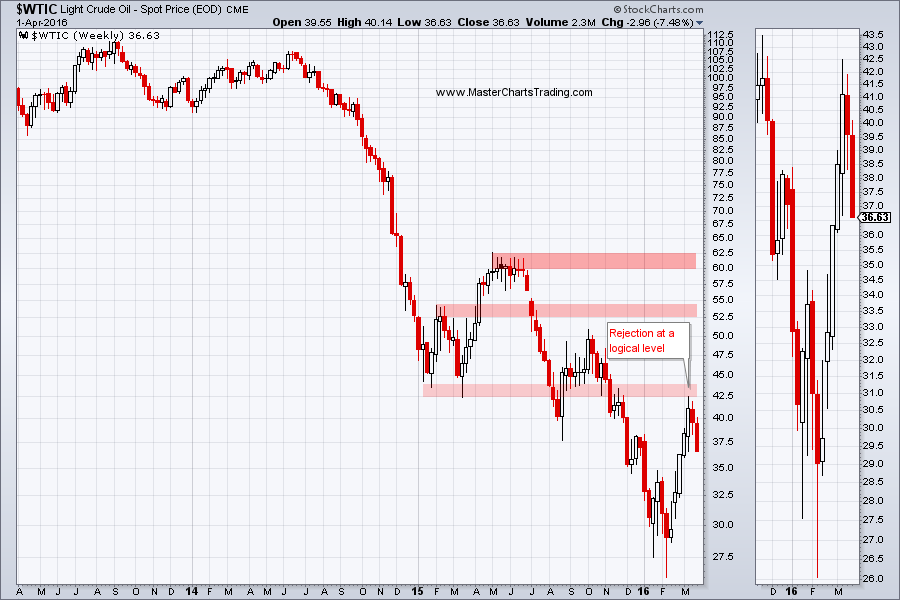
Long-term chart of oil shows rejection at a logical level of $42.50. This is the level where oil held support on two occasions in 2015, but ultimately broke it twice later same year.
CHART OF $WTIC
LONG-TERM CHART OF $WTIC
Long-term chart of oil shows rejection at a logical level of $42.50. This is the level where oil held support on two occasions in 2015, but ultimately broke it twice later same year.
CHART OF $WTIC
LONG-TERM CHART OF $WTIC
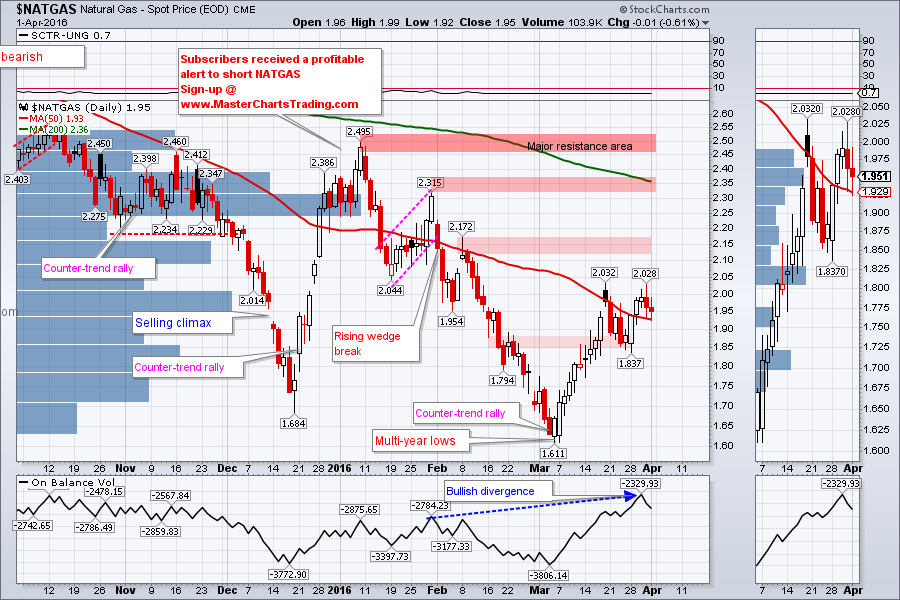
NATGAS was able to close above the 50-day moving average this week. This is an important step as it approaches the first significant resistance level at 2.17. Bears would most likely attempt to push the prices lower around there.
More significant resistance is around 2.315 and the very important one is at 2.50.
CHART OF NATGAS
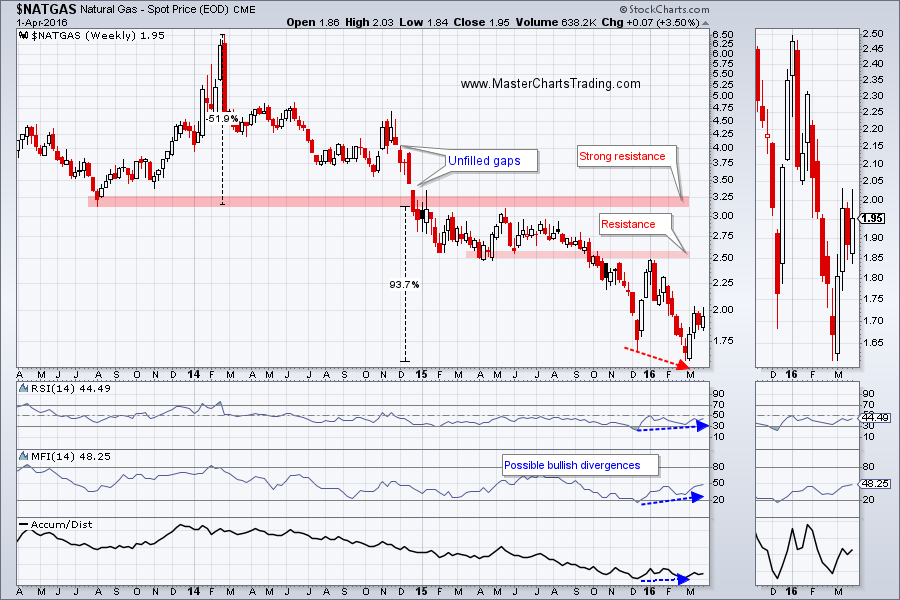
Long-term picture hasn’t changed much, so I am quoting from last week. “The 2.50 level is of a particular importance because it is around there that NATGAS failed last September. It is also around 2.50 where the price was rejected in January. Currently there several bullish divergences present on the long-term chart of NATGAS (price made a lower low, but indicators made higher lows).
As of the writing of this blog post, I still consider NATGAS a bearish security and by extension only looking for short setups. Should NATGAS manage to break above 2.50 and hold on a retest my posture would change to a bullish one.”
LONG-TERM CHART OF NATGAS
More significant resistance is around 2.315 and the very important one is at 2.50.
CHART OF NATGAS
Long-term picture hasn’t changed much, so I am quoting from last week. “The 2.50 level is of a particular importance because it is around there that NATGAS failed last September. It is also around 2.50 where the price was rejected in January. Currently there several bullish divergences present on the long-term chart of NATGAS (price made a lower low, but indicators made higher lows).
As of the writing of this blog post, I still consider NATGAS a bearish security and by extension only looking for short setups. Should NATGAS manage to break above 2.50 and hold on a retest my posture would change to a bullish one.”
LONG-TERM CHART OF NATGAS
Trade Alerts Service is now live – please sign-up here!
That’s it for this week’s market recap,
Best Regards and have another great trading week!
Alexander Berger (www.MasterChartsTrading.com)
That’s it for this week’s market recap,
Best Regards and have another great trading week!
Alexander Berger (www.MasterChartsTrading.com)


 RSS Feed