|
www.MasterChartsTrading.com Friday, April 10, 2015 Weekly Market Recap.
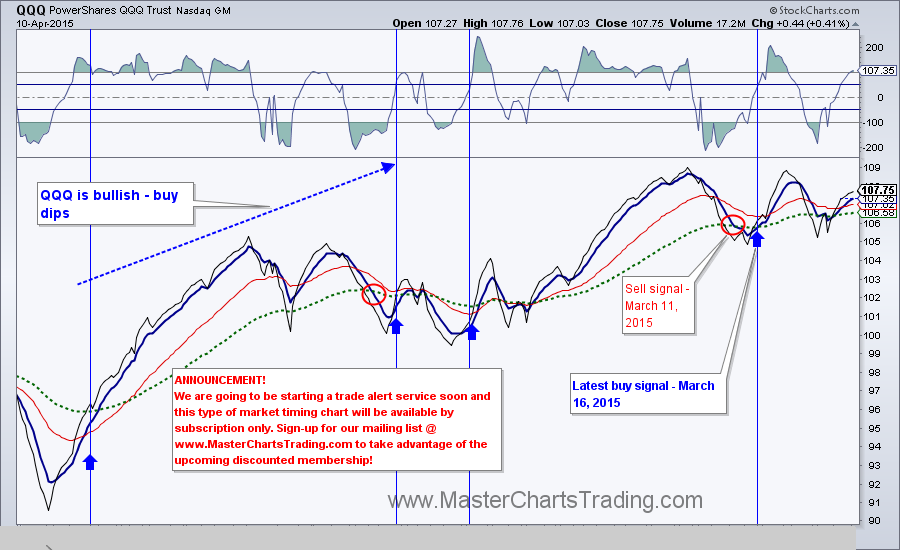
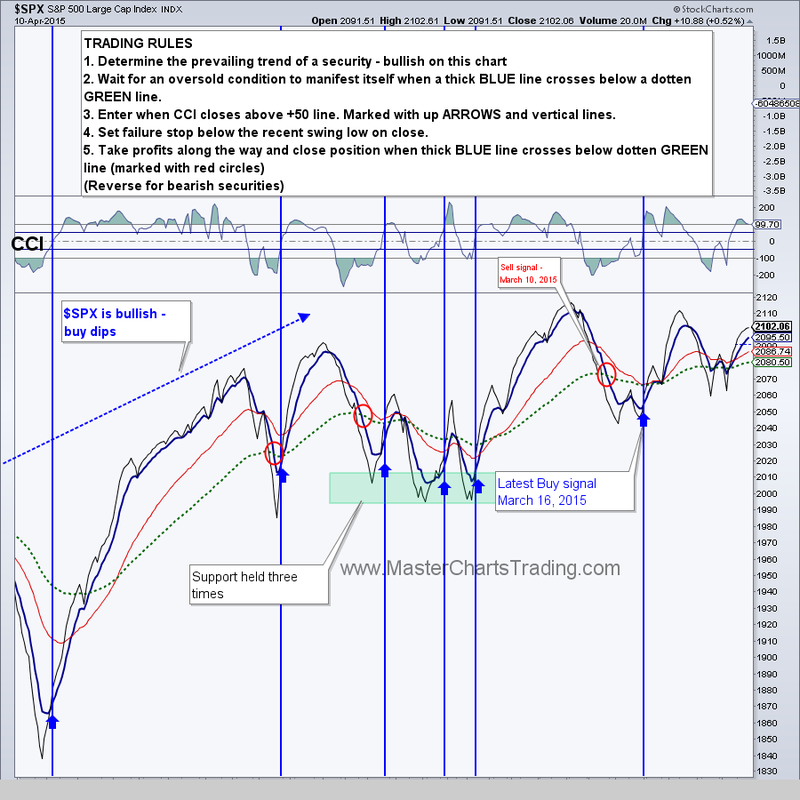
Last week, on Good Friday, the $SPX futures dropped hard and I was worried that we will get a gap down on Monday. Clearly the markets fooled everyone and Monday was a very strong day for $SPX. This week brought welcome relief to the stock market bulls. $SPX bounced off the support from early and mid-March and continued higher. $SPX is up 1.7% for the week. The NASDAQ 100 ETF – QQQ followed suit with a 2.5% surge. Charts for SPX and QQQ here |
|
As early as March 26, our trading system flashed a warning sign and we went on a “preliminary sell” signal for $SPX and QQQ. I was waiting for a conclusive break below support from early March, but it never came. We did cut our exposure to the stock market at a breakeven point, but we still have a majority of our position that we opened on March 16th open.
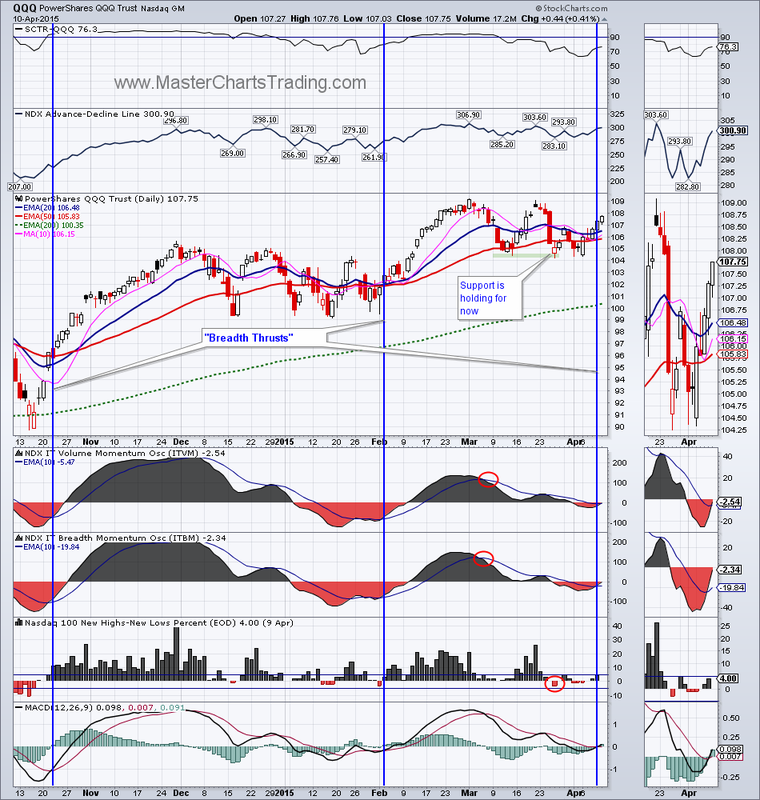
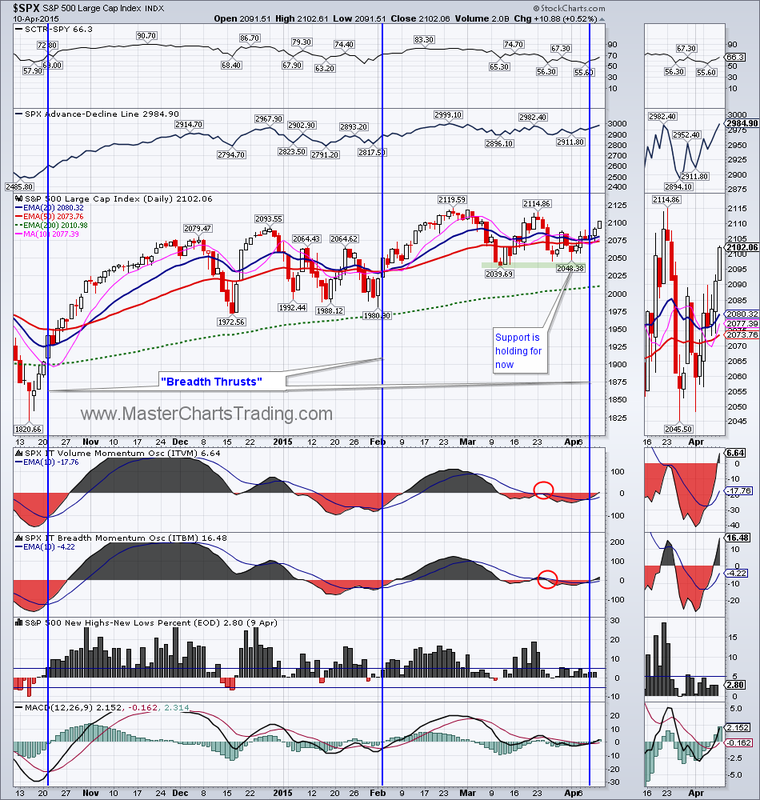
A breadth thrust occurred on both SPX and QQQ this week. This means that the stock market has changed direction for the bullish and not yet overbought – another welcome sign for the bulls. We could retest the February highs shortly.
A breadth thrust occurred on both SPX and QQQ this week. This means that the stock market has changed direction for the bullish and not yet overbought – another welcome sign for the bulls. We could retest the February highs shortly.
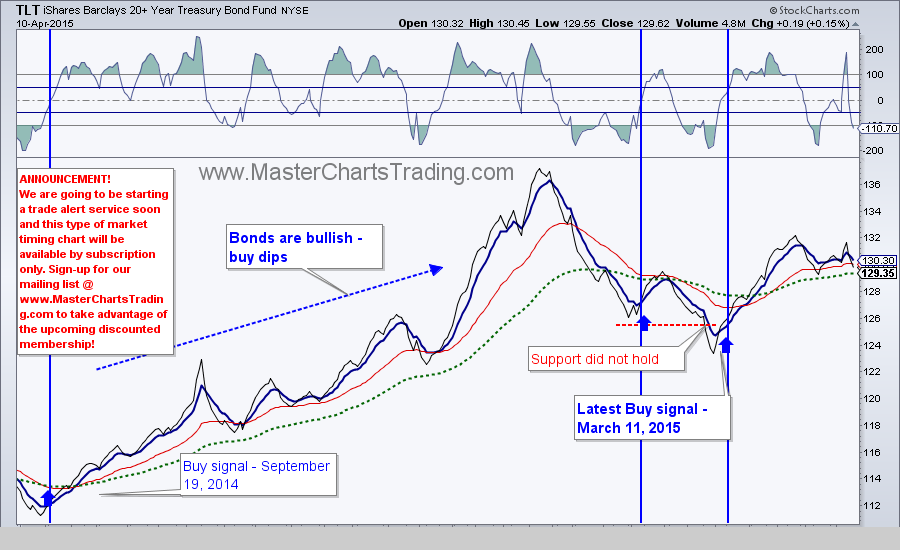
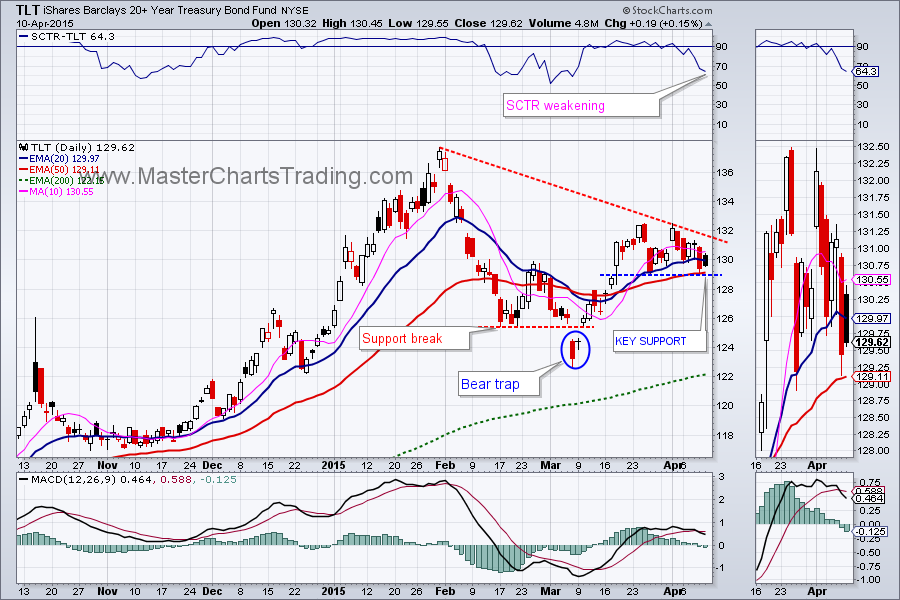
I thought that TLT would gap up on Monday following last Friday’s jobs report. But exactly the opposite happened and TLT closed in the red on Monday.
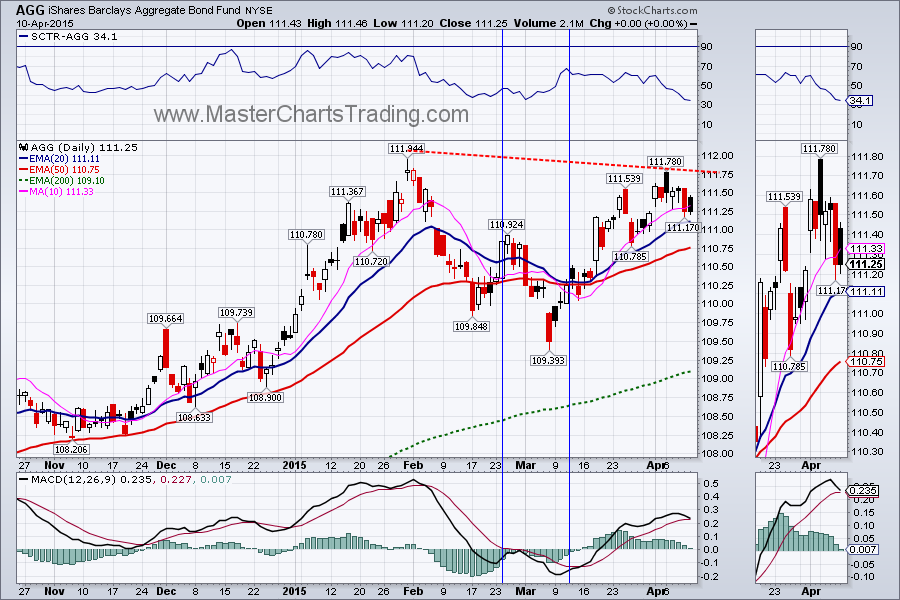
Bonds of all sorts were under pressure entire week. TLT lost 0.85% and almost retraced its entire breakout. TLT did not yet give us a sell signal, but we did lock in profits and moved the stop to entry. TLT charts at bottom of page here
Bonds of all sorts were under pressure entire week. TLT lost 0.85% and almost retraced its entire breakout. TLT did not yet give us a sell signal, but we did lock in profits and moved the stop to entry. TLT charts at bottom of page here
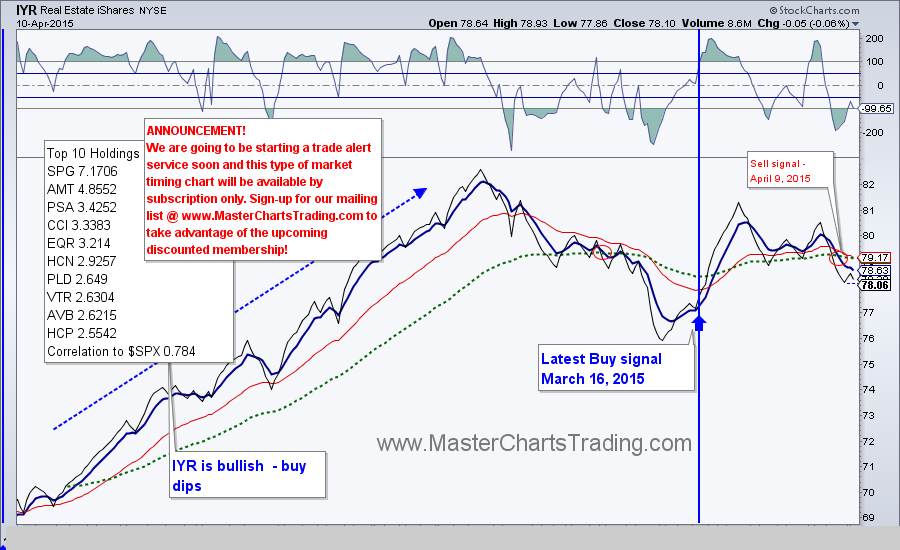
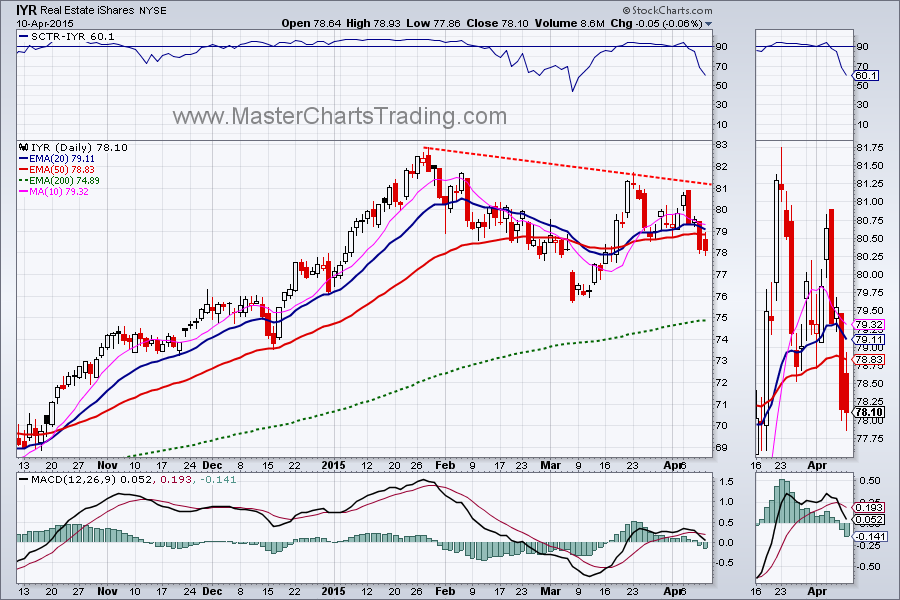
Unsurprisingly, weakness in bonds translated into weakness in the interest-sensitive sectors – Utilities and the Real Estate. XLU was basically flat for the week, but IYR dropped over 2%. We exited positions in both after taking profits earlier.
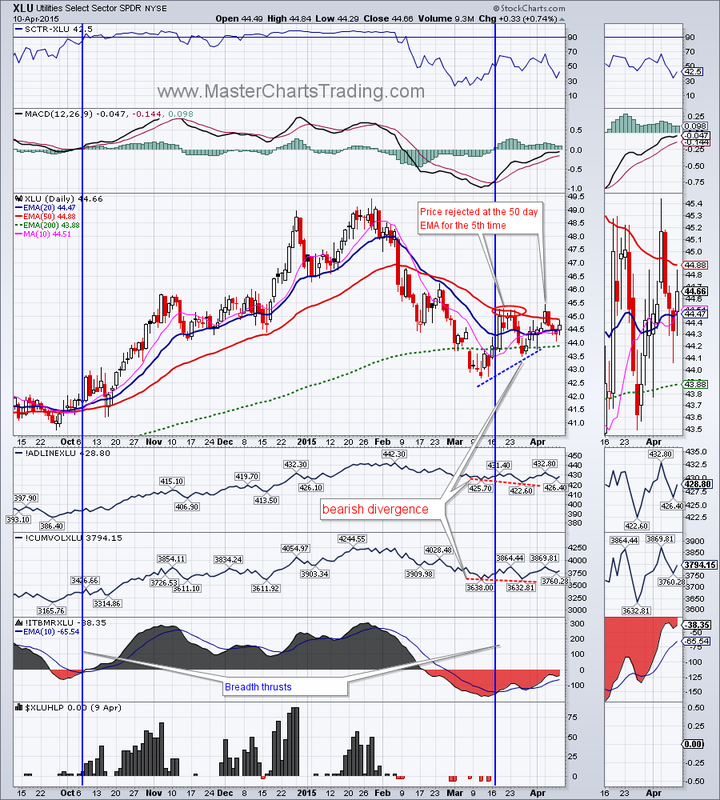
I highlighted weakness in the Utilities sector in a couple of my previous posts. A bearish divergence of sorts is taking shape on the graph of XLU. The underlying AD lines are making lower lows, while XLU itself is making higher lows. Also the price of XLU was rejected at the 50-day exponential moving average (EMA) for 5 times! XLU is still bullish long-term, but should bonds drop more, Utilities may follow suit. Anyway, there are stronger sectors out there to invest in. XLU and IYR charts at bottom of page here
I highlighted weakness in the Utilities sector in a couple of my previous posts. A bearish divergence of sorts is taking shape on the graph of XLU. The underlying AD lines are making lower lows, while XLU itself is making higher lows. Also the price of XLU was rejected at the 50-day exponential moving average (EMA) for 5 times! XLU is still bullish long-term, but should bonds drop more, Utilities may follow suit. Anyway, there are stronger sectors out there to invest in. XLU and IYR charts at bottom of page here
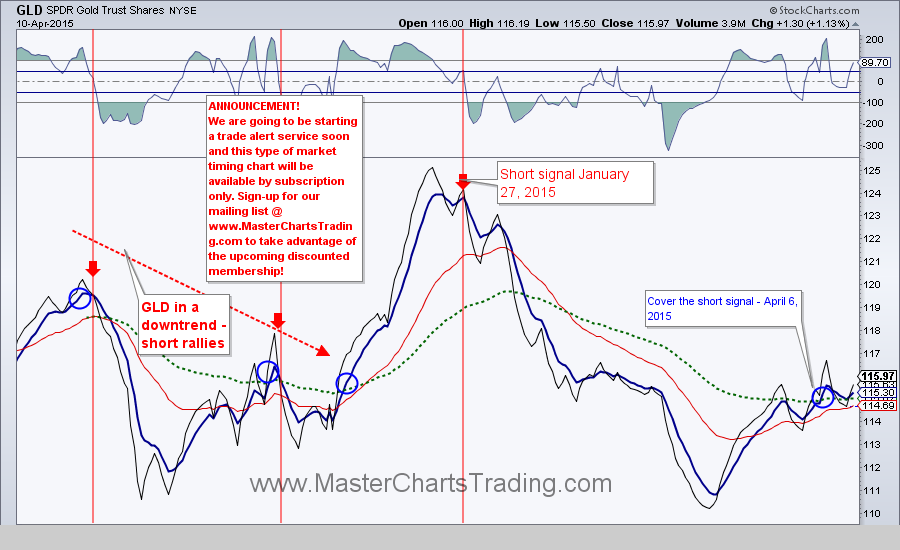
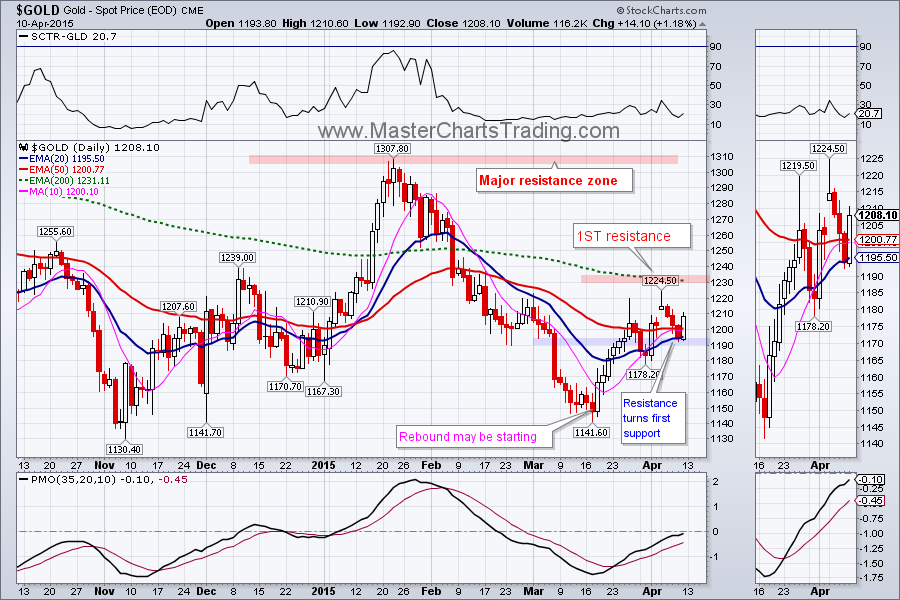
Gold is pushing higher with its rebound that started in mid-March. Long-term gold is bearish, so I am viewing this rebound as a bear-market rally and will short it once the opportunity presents itself. For now, there was no shorting opportunity, unless you are trading on 10-minute charts, which I don’t normally do.
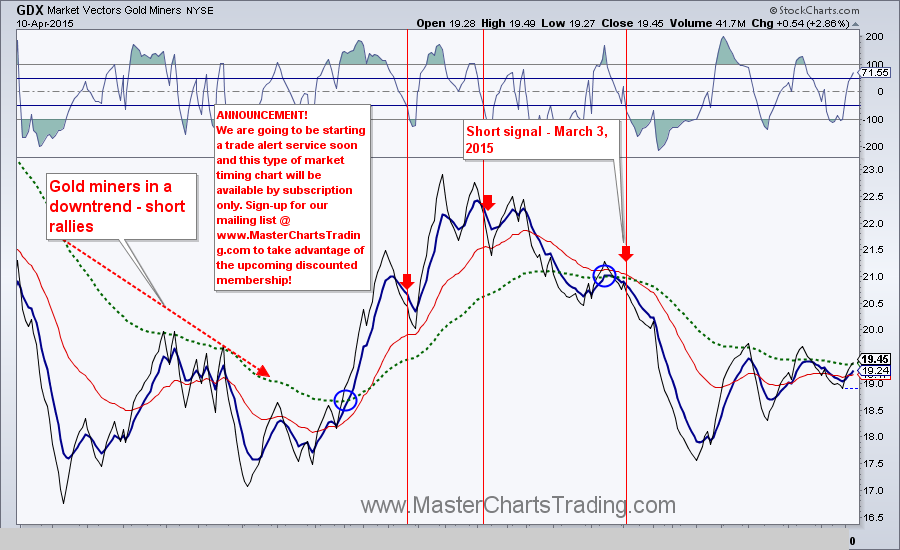
GDX – the gold miners ETF is following gold as well, but in a more volatile fashion. There was a couple of decent shorting opportunities in mid-March and again in mid-April, but they were both very short-lived and not confirmed by gold itself. For now GDX is in a short-term uptrend that could take it to around $21 where the 200-day EMA currently resides. If at that point our timing charts trigger a short signal, I would be more inclined to play GDX on the downside (provided gold confirms).
Another thing going for GDX is a bearish divergence between GDX and its underlying AD Lines. I wrote a post about this recently. Since then the divergence has gotten worse. GDX is making higher lows, while its AD Lines are making lower lows. Did I mention GDX is bearish long-term, so a bearish resolution of this rebound would be more likely?
Gold and gold miners charts are located here

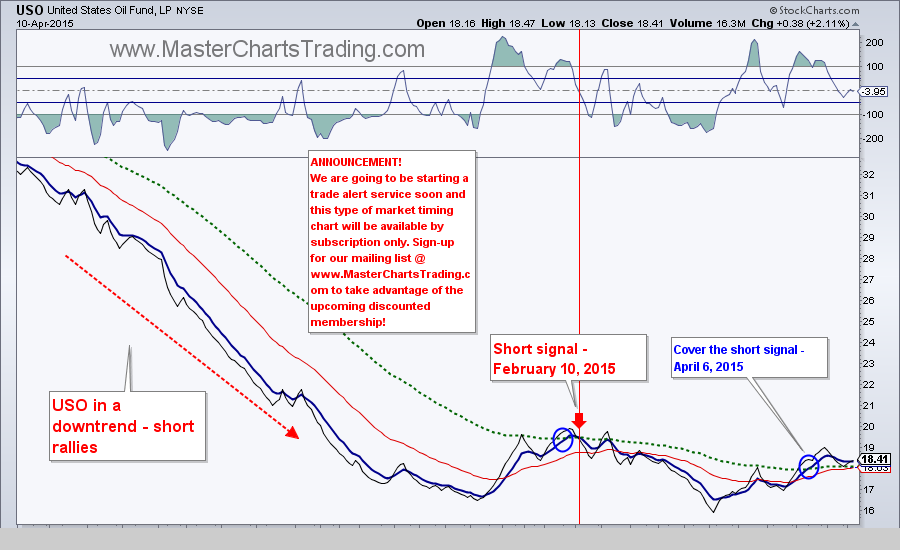
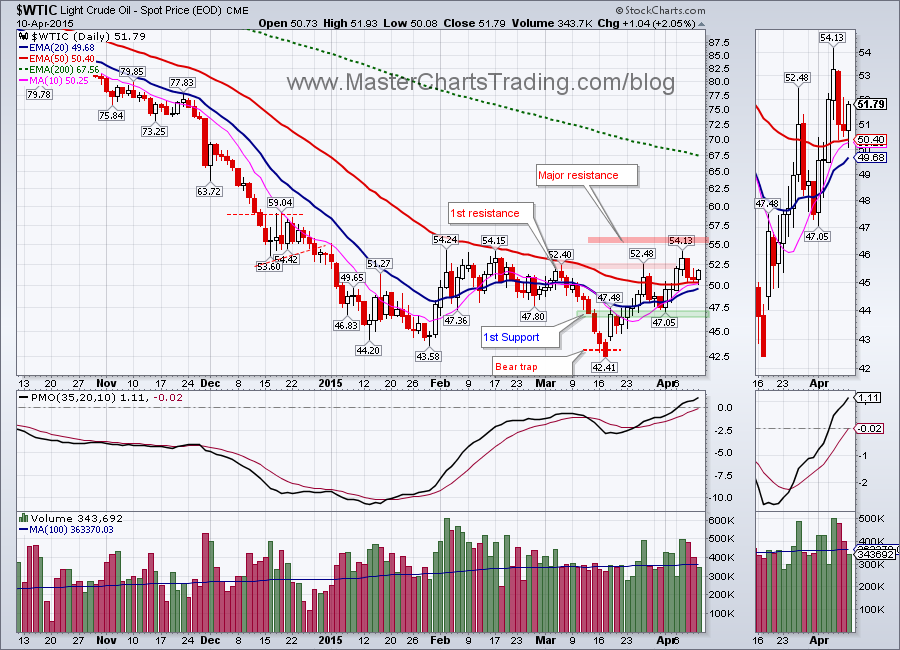
West Texas Intermediate Oil ($WTIC) rallied to resistance from a bear trap in mid-March and stalled. Again, $WTIC is in a long-term downtrend, so once the short signal is given by our market timing charts, I may re-enter the inverse oil ETF trade (SCO, DWTI)
Commodities charts located here
Commodities charts located here
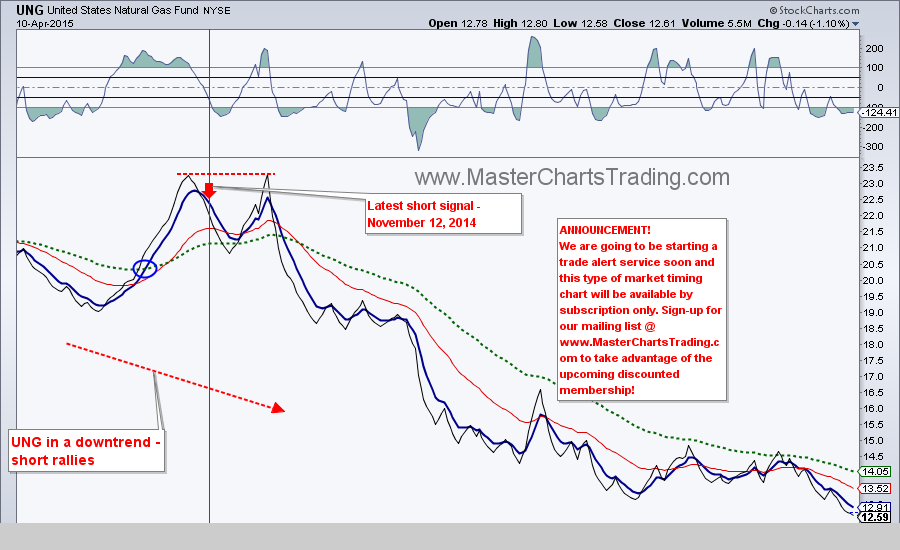
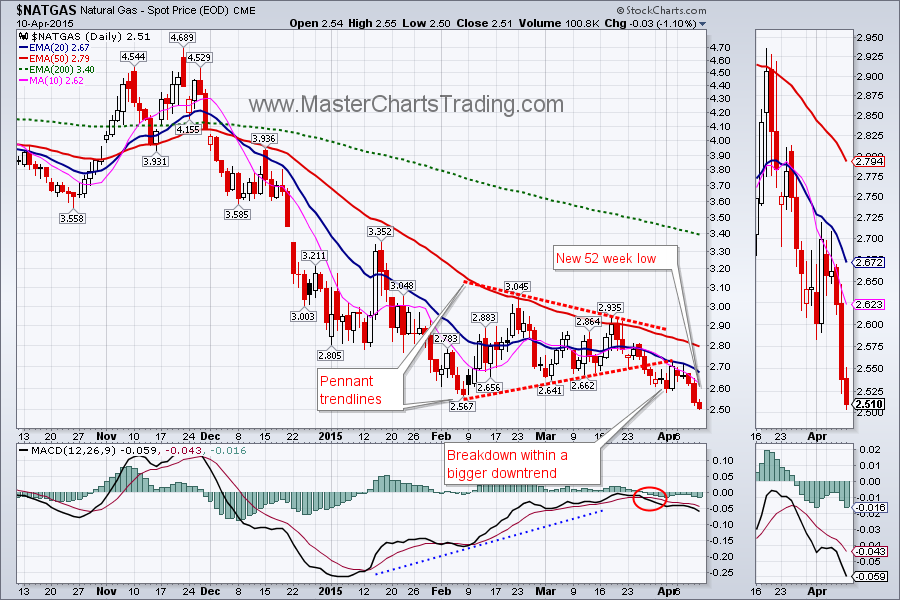
Finally, I wanted to highlight Natural Gas ($NATGAS). $NATGAS had a textbook example of a pennant breakdown on March 26th. It then followed lower the last two weeks. This Friday it closed at another 52-week low. Clearly the bigger trend took precedence over any counter-trend rebounds. This is precisely why I avoid going against the major trends and don’t even bother picking tops or bottoms.
Commodities charts located here
Commodities charts located here
That’s it for this week’s market recap,
Best Regards and have another great trading week!
** Special Announcement**
We are weeks away from launching a stocks alert service. Please sign-up for our mailing list to be the first to take advantage of the discounted membership!
Alexander Berger (www.MasterChartsTrading.com)
Disclaimer, we have:
Open positions: SPY, LULU, TLT (took profits)
New position:
Closed position: ERY (stopped out), IYR (took profits then closed), XLU (took profits then closed)


 RSS Feed