|
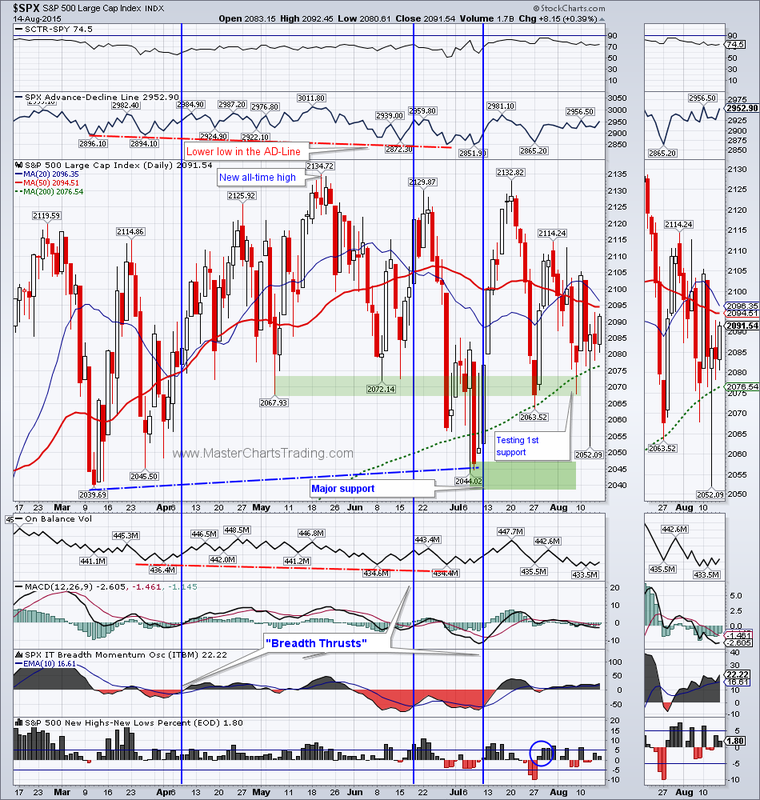
Stocks managed to close the week with marginal gains: $SPX gained a little under ¾ of a percent, while QQQ and IWM held support and is ready for a bounce higher.
Wednesday’s action in many major indices highlighted the importance of waiting for the closing price. Intraday $SPX was down as much as 1.55%, yet after all was said and done the index closed up about 1/10th of a percent. This was a hammer candlestick forming for the day – a classic sign of a reversing downtrend. Thursday $SPX retested the hammer and Friday, I believe, we began the advance higher. $SPX is set for a push to new highs provided other indices cooperate Charts for SPX, QQQ and IWM |
|
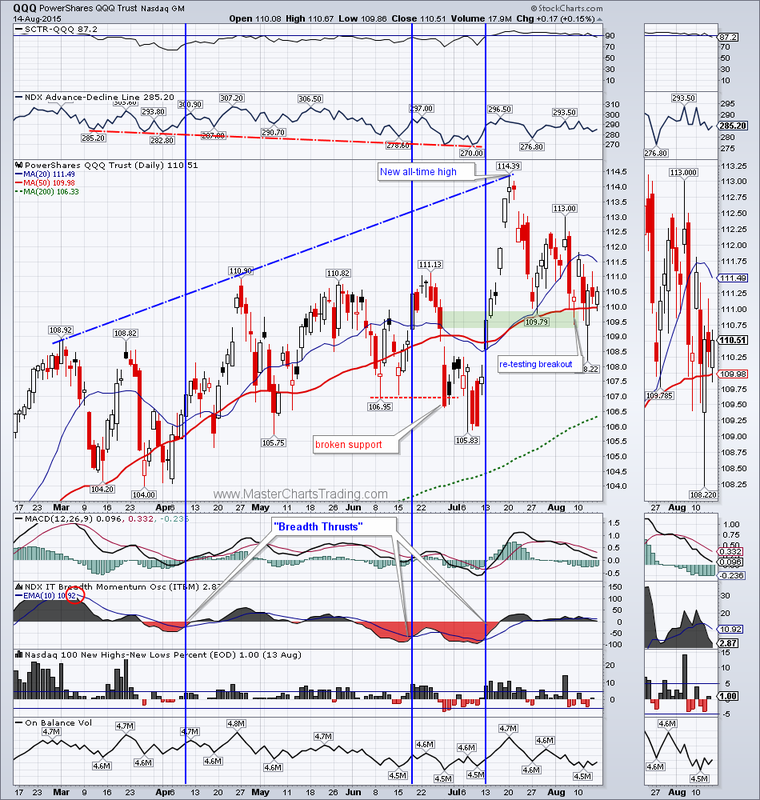
QQQ was doing something similar to $SPX as it again retested its prior breakout in the 109 area. I think the breakout is holding for now. It looks like the Advance-Decline line for QQQ has put in a series of higher lows, meaning that the advance is becoming broader and more stocks are participating in it.
Two sectors that are weighing on QQQ are Semiconductors (XSD) and Biotech (XBI). QQQ is composed of about 15% biotech related firms and about 7% semiconductors related firms so weakness in these sectors is translating into confused price action for QQQ.
Two sectors that are weighing on QQQ are Semiconductors (XSD) and Biotech (XBI). QQQ is composed of about 15% biotech related firms and about 7% semiconductors related firms so weakness in these sectors is translating into confused price action for QQQ.
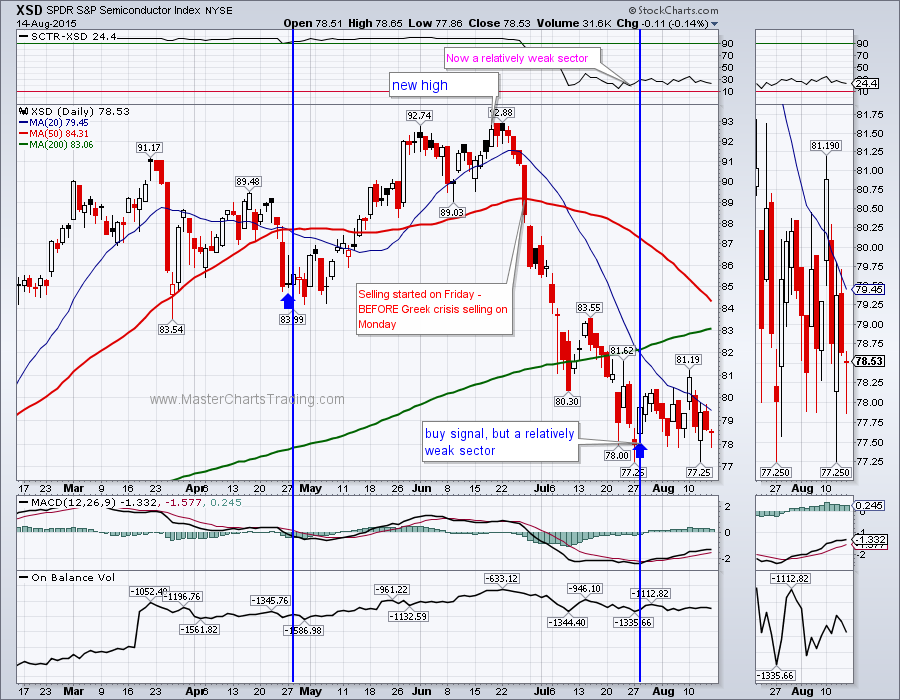
XSD got walloped rather hard and was down as much as 17% from its high in June. XSD is firming in the $78 area with multiple hammer-like candlesticks. This indicates potential buying interest at these price levels. I opened a position in XSD back on July 28th.
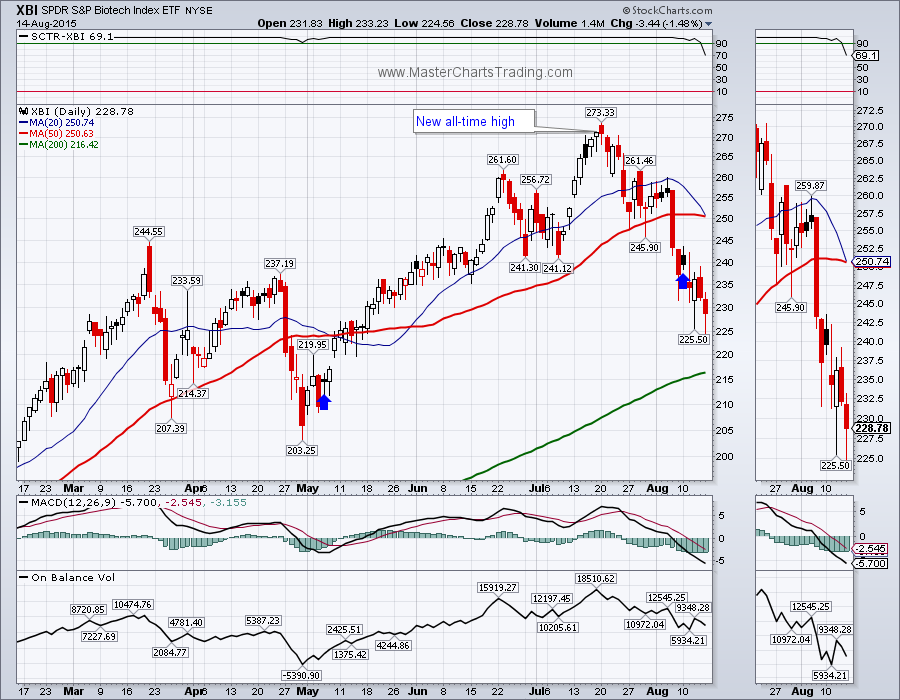
XBI is a broadly diversified ETF with a relatively large exposure to the small cap biotech universe. Small caps are currently bearing the brunt of selling, so it’s no surprise to see XBI under pressure. XBI is also down over 18% from its all-time highs on July 20th. I also opened an appropriate position in XBI on August 10th. So far my stop has not been hit yet and XBI is also showing signs of potential buying interest in the $230 area.
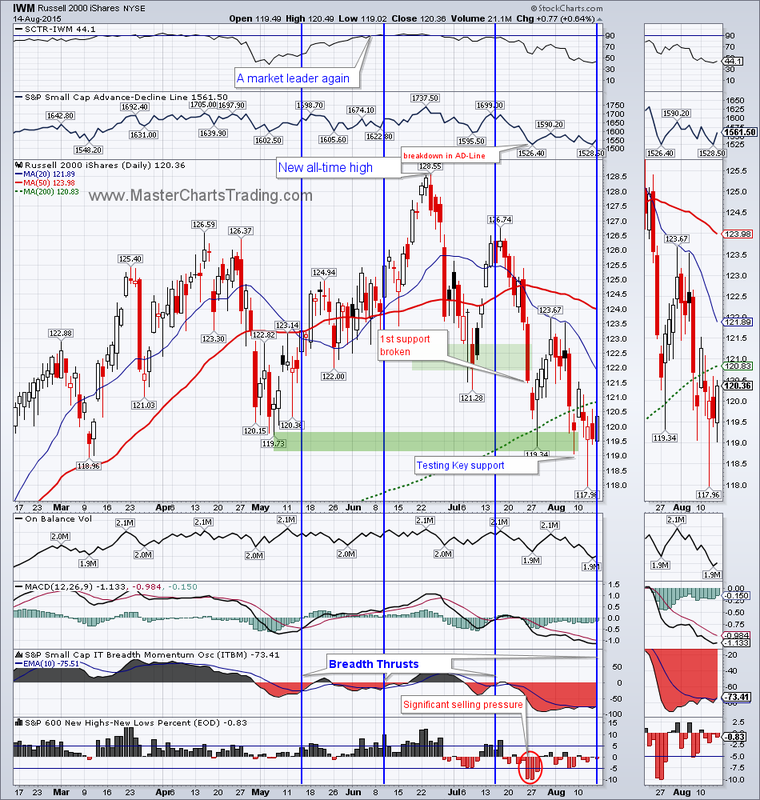
Of the major indices, it’s the small caps that are seeing the most selling pressure. IWM is down over 8% from its all-time highs in June. The ETF is firming around $119, but is showing signs of relative weakness compared to its large cap brethren. IWM is trading below its 200-day moving average and is at a major support. Should this support give, IWM could correct another 5-7% to its December and January lows.
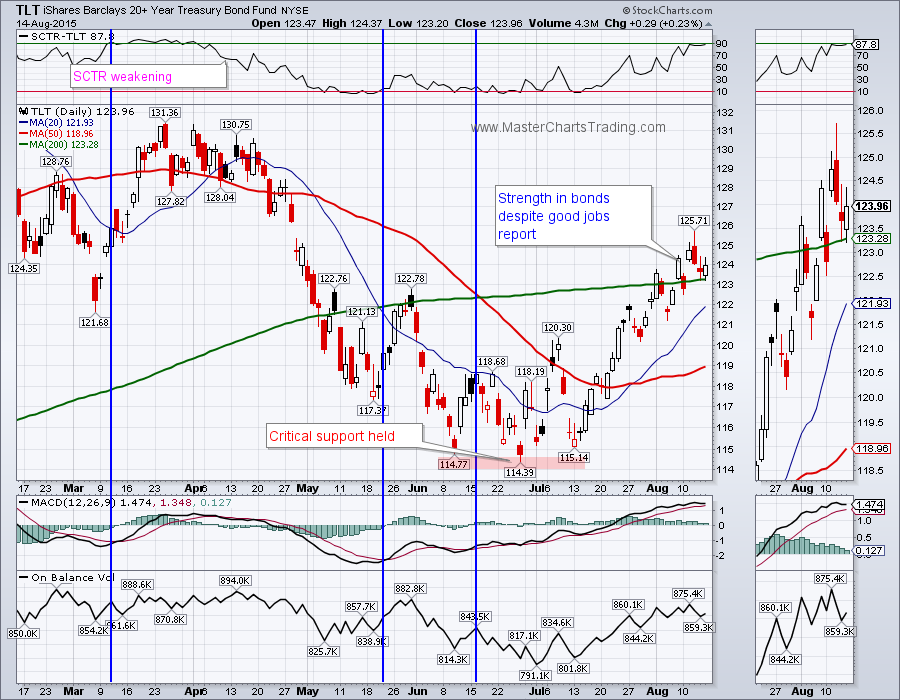
Bonds (TLT) gained over 10% from their recent lows. TLT is currently trading above the 200-day moving average and the resistance levels from the May highs. TLT is now one of the market leaders again, but it is possible that the upside momentum is loosing strength and a re-test of this breakout is close by. Strength in bonds is generally not a good sign for the stock market as it saps the money that could otherwise be invested in stocks.
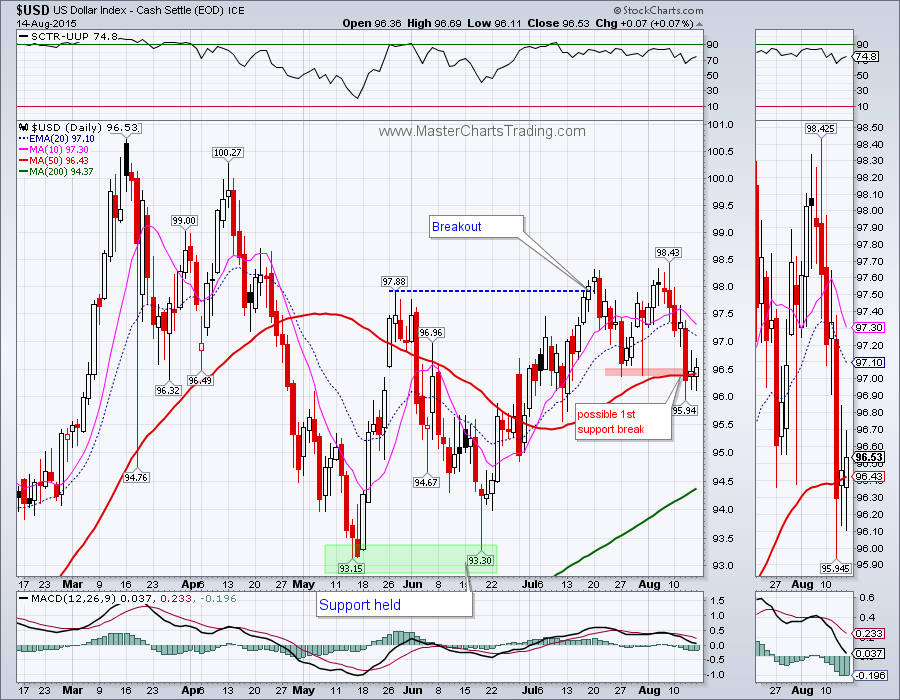
US dollar index is taking a breather as it fall back from the highs for the move up. $USD may have broken a minor support around the 96.50 levels. $USD is still bullish long-term. If we get any more sideways or down trading from here, $USD would present itself as a buying opportunity.
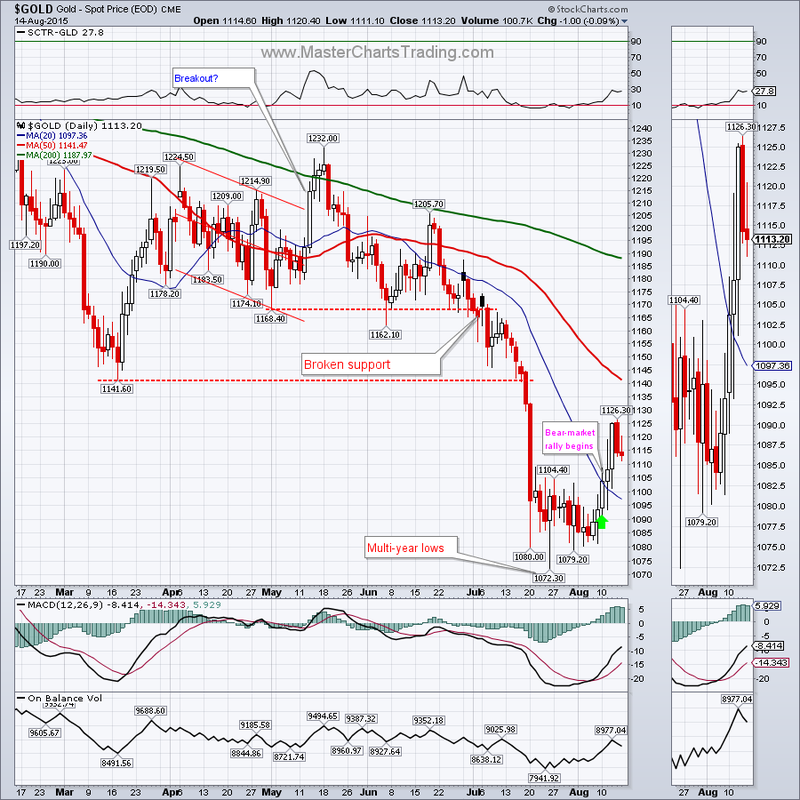
Weakness in the $USD is relieving the incessant pressure under which commodities have been of late. Gold is currently in the middle of a snap-back (bear-market) rally. Price of gold was up over 5% from its recent low of $1072.30. Unless we collapse back down from here, I believe this counter-trend bounce is set to continue to possibly around the $1140 area.
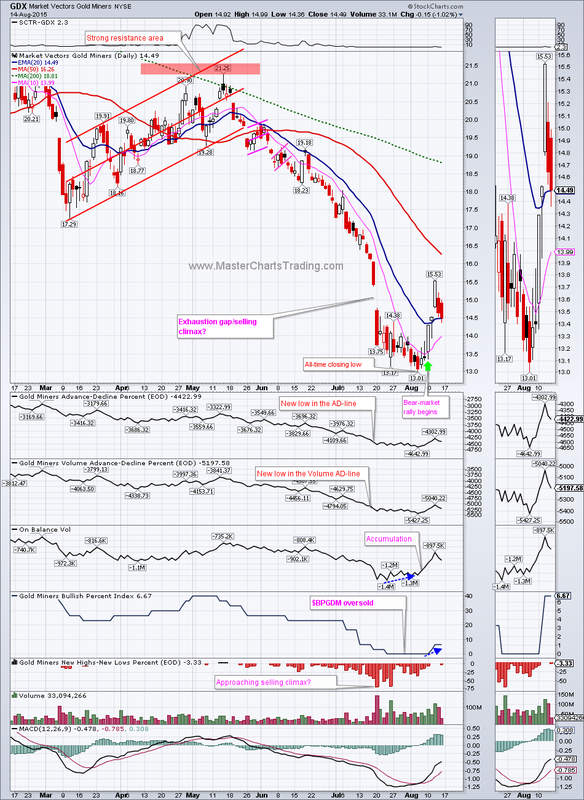
Charts for gold, silver, platinum, palladium and gold miners
Charts for gold, silver, platinum, palladium and gold miners
GDX followed gold higher and was up almost 20% from its low on August 5th. These counter-trend bounces can be very powerful, but catching these kinds of moves is fraught with danger. Since the breakdown in GDX started in May, we had no less then 4 failed rally attempts and only the 5th succeeding so far. As with gold, unless we collapse from here, I think GDX could push higher to the $16-18 area.
Even though the dollar index is gaining, oil still can’t catch a bid. USO moved to new all-time lows this week. It is now undoubtedly oversold and a snap-back rally similar to the one taking place in gold is very likely. Should this bear-market rally commence a move to the broken support in the $15.60 area is possible. Again, catching counter-trend moves is rather dangerous.
That’s it for this week’s market recap,
Best Regards and have another great trading week!
** Special Announcement**
We are close to launching a stocks alert service. Please sign-up for our mailing list to be the first to take advantage of the discounted membership once it becomes available!
Alexander Berger (www.MasterChartsTrading.com)


 RSS Feed