|
A rally attempt from the last week got cold feet as early as Tuesday. $SPX ran into resistance in the 2100 area and turned back with a vengeance. Thursday and Friday candlestick prints for $SPX appear to be of the rare Marubozu variety. This means that the selling started on Thursday morning at the open and continued unabated until the very close with no rebound to speak of. Market makers then went to bed and came back Friday morning for a repeat. $SPX is down 5.77% for the week.
click here for $SPX charts here |
|
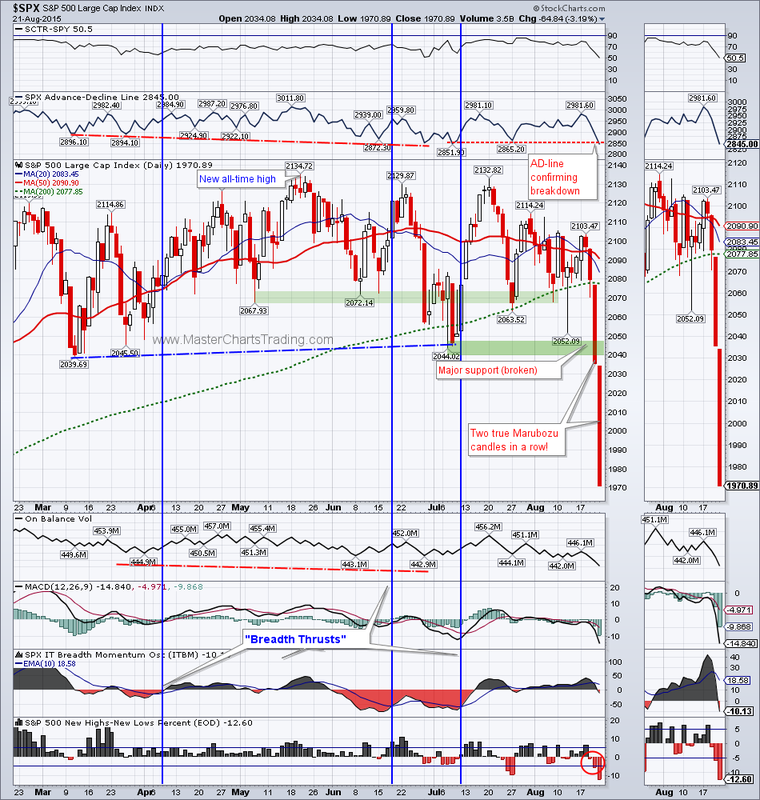
Friday’s close took $SPX back down to the December and February lows in the 1970 area. This is a logical support level for the bulls to make a stand. $SPX is now relatively oversold, but not as oversold as it was back in October, so more downside is certainly in the cards. However should more downside occur the technical damage to the $SPX chart may push it into the bear market territory and that would mean that instead of trying to time entries to go long, I may start looking for shorting opportunities.
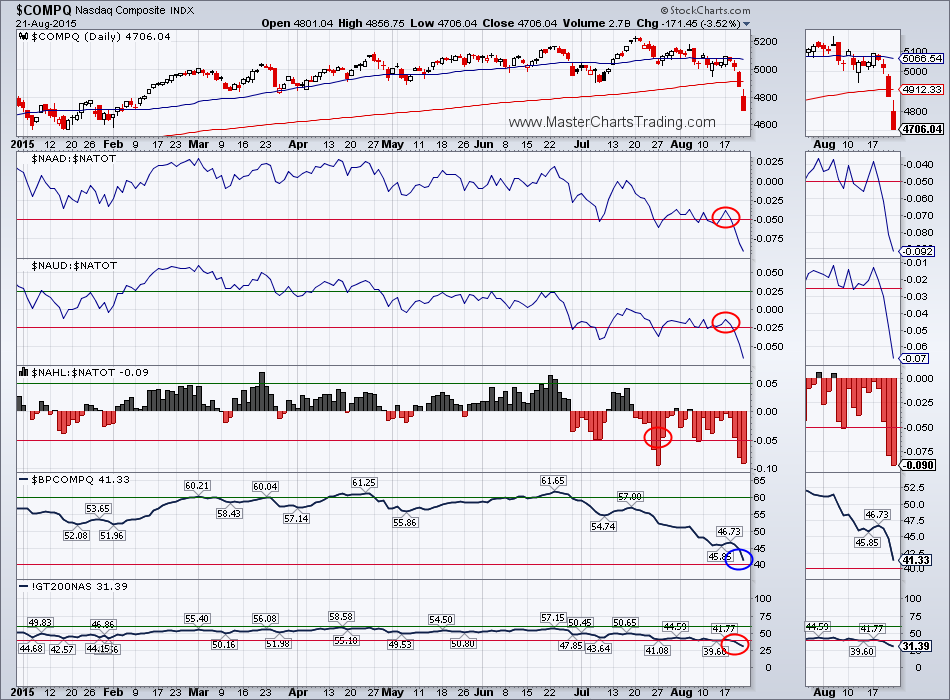
Let us now use the balance of evidence approach to attempt to quantify the current trend of the general market. See table below
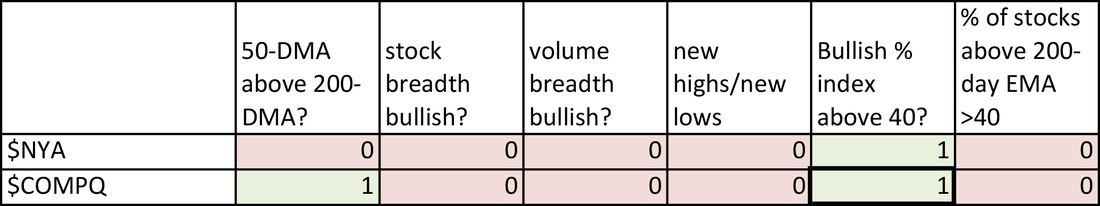
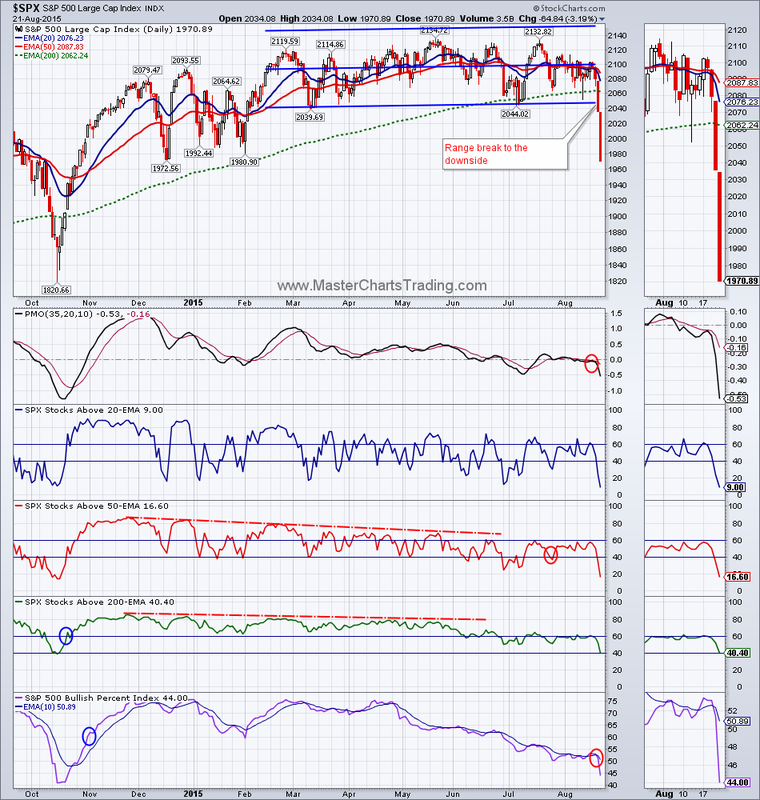
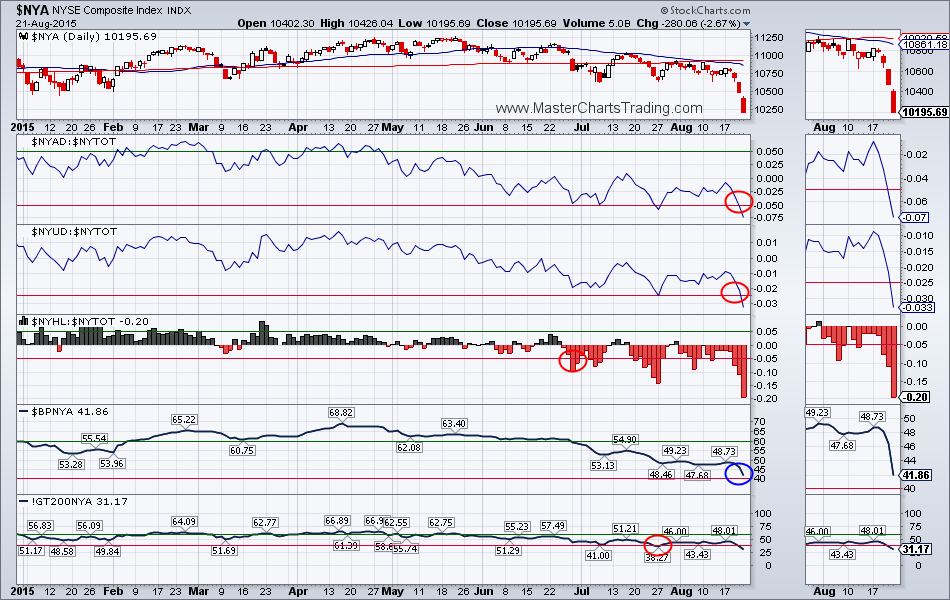
There is currently very little bullish evidence left out there. Bullish percent indices and the bullish NASDAQ moving averages are the only 3 pieces of the bullish equation. Currently the Bullish percent indices are hovering just above 40%. Should they drop below, I will consider the major indices to be in bear markets and look for shorting opportunities. As of the close on Friday, I think the major indices are very slightly long-term bullish.
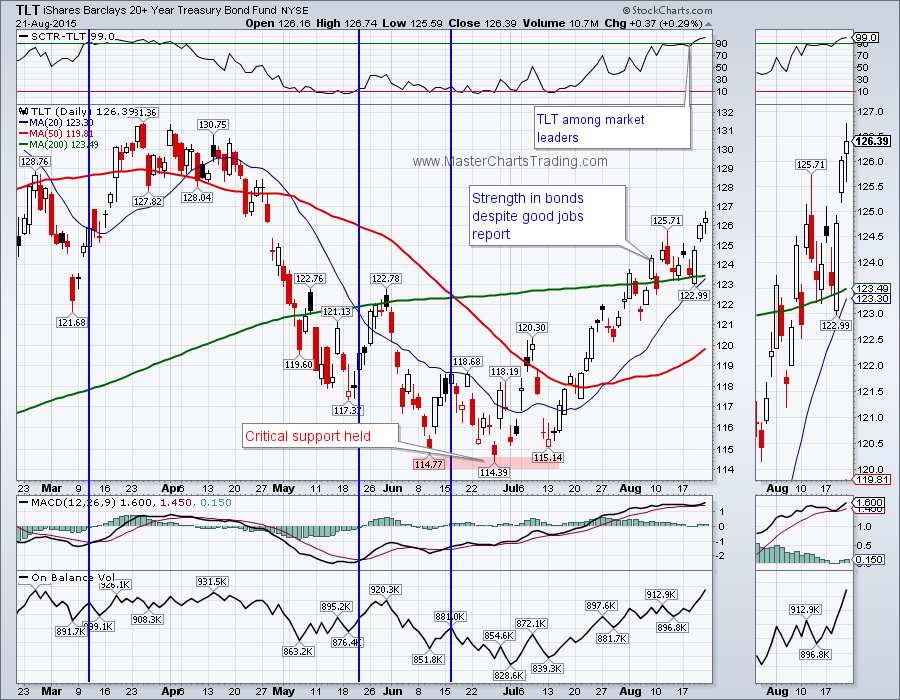
Bonds unsurprisingly did well for the week. TLT gained almost 2% and that’s despite all the talk of Federal Reserve raising interest rates (higher interest rates weigh on bond prices). TLT is somewhat overbought after 10+% gains over the last few weeks, but it certainly is not weak. Further weakness in the stock markets would likely be beneficial for bonds.
TLT chart here
TLT chart here
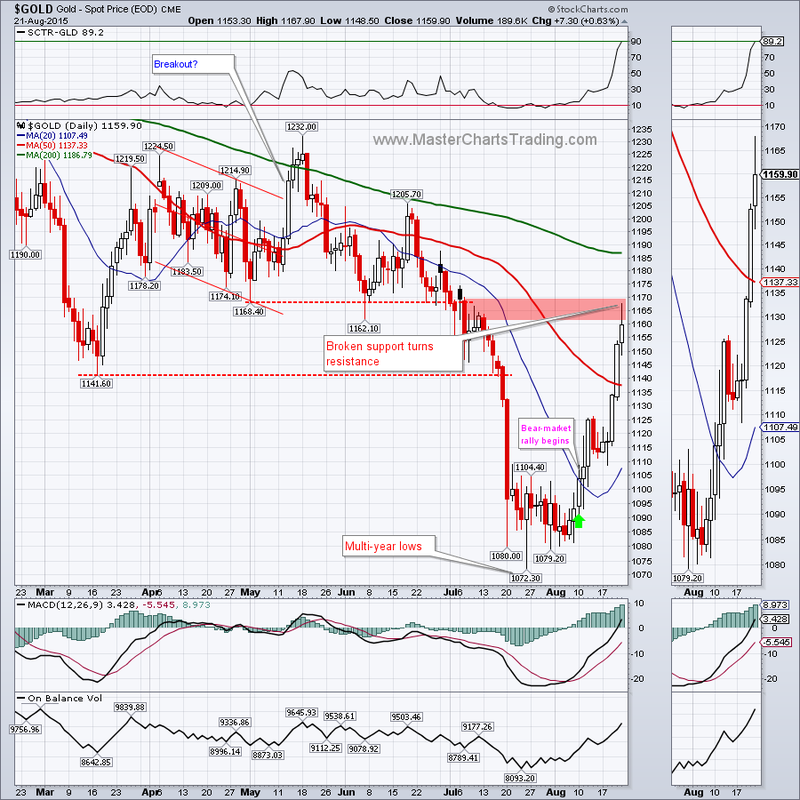
Gold had an excellent week as it added 4.2% to close exactly at the previous breakdown levels of $1159.90. Despite of what many gold bulls are saying, I still think that currently gold is in a middle of a bear-market rally. Bear market implies that we may still see lower lows and highs ahead. Working off that premise, gold is already short-term overbought so I will be looking for shorting opportunities in the days and weeks ahead.
Gold and other precious metals charts
Gold and other precious metals charts
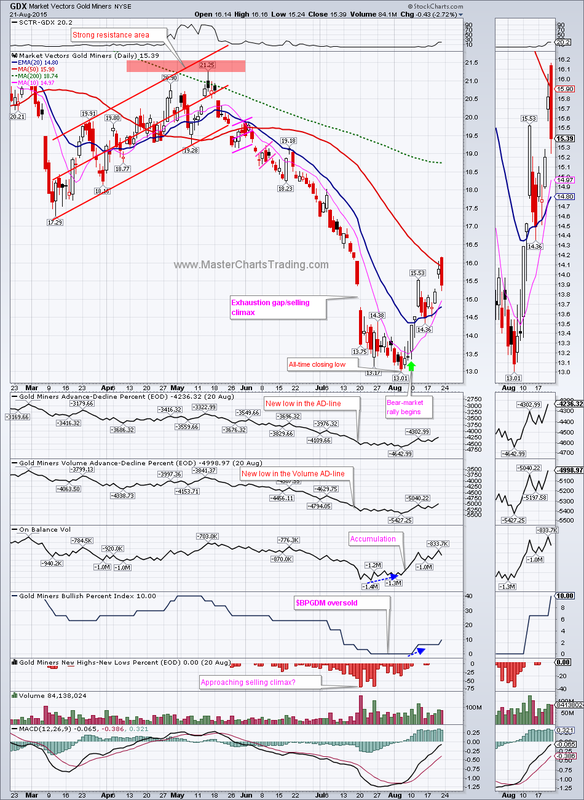
Gold miners (GDX) fared slightly better as it gained 6.2% for the week. Friday’s candlestick leaves much to be desired, though. It sure looks like a Bearish Engulfing pattern. Would GDX lead gold lower? We should have our answer next week. I am not yet comfortable shorting GDX and would like to see a little more upside before taking a short position.
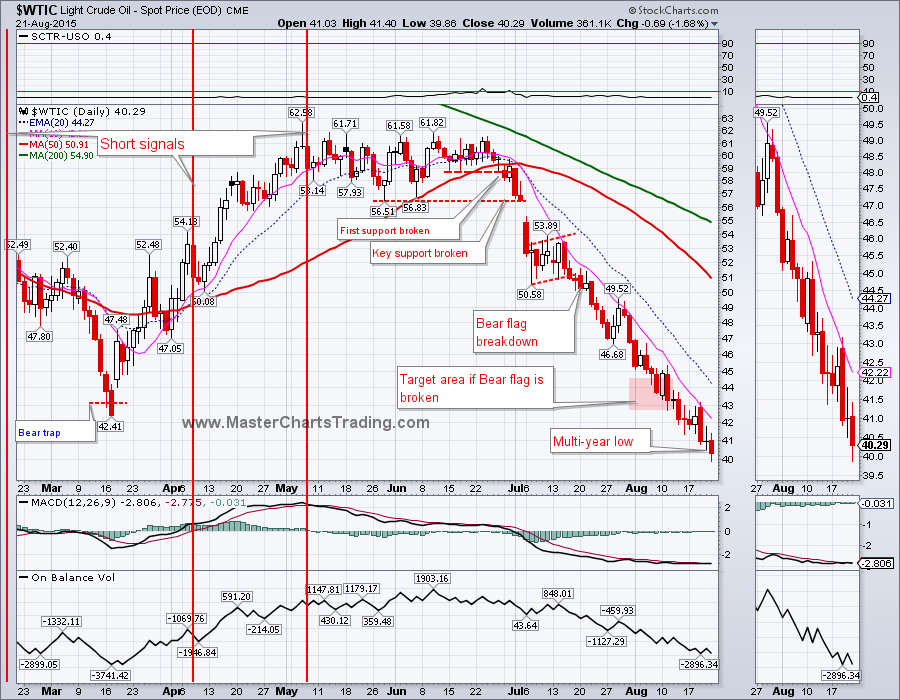
Oil ($WTIC) hit another multi-year low on Friday and briefly dipped below the $40/barrel mark to close at $40.29. $WTIC is quite oversold, but as I mentioned before: in downtrending securities oversold levels are usually ignored, while overbought readings are shorted.
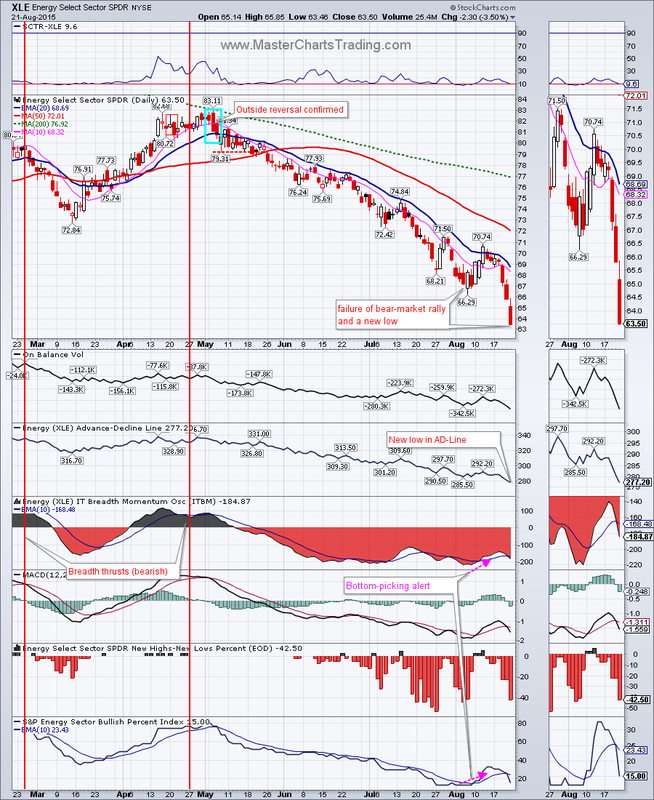
Finally on the dangers of picking bottoms. XLE sure looked like it was ready to rally in the beginning of August. Multiple indicators turned up from deeply oversold levels and price pushed slightly higher, only to be reversed immediately as the general market sold-off. Now we are again seeing new lows in the Advance-Decline line for XLE and the above-mentioned oversold indicators are again oversold. I usually try to not pick bottoms (or tops) and take the easier money in between.
That’s it for this week’s market recap,
Best Regards and have another great trading week!
** Special Announcement**
We are close to launching a stocks alert service. Please sign-up for our mailing list to be the first to take advantage of the discounted membership once it becomes available!
Alexander Berger (www.MasterChartsTrading.com)
Best Regards and have another great trading week!
** Special Announcement**
We are close to launching a stocks alert service. Please sign-up for our mailing list to be the first to take advantage of the discounted membership once it becomes available!
Alexander Berger (www.MasterChartsTrading.com)


 RSS Feed