|
PROGRAMMING NOTE!
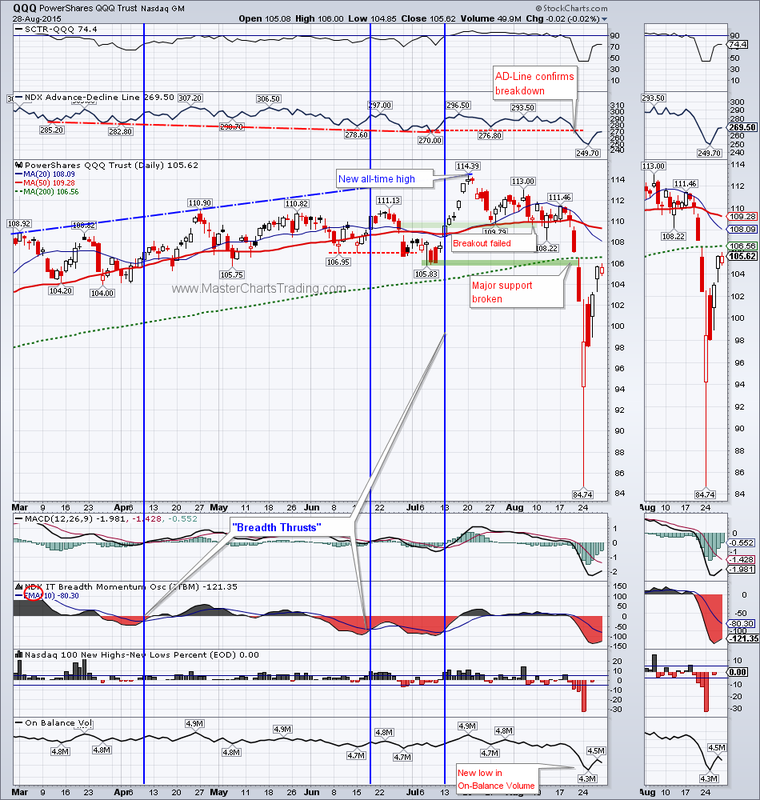
I will be out of town the entire week until September 5th and our public charts will not be updated. I apologize for any inconvenience. A wild week on Wall Street indeed! We have likely witnessed a flash crash of sorts on Monday, as many ETFs saw their prices cut in half within seconds of opening! Especially concerning was the fact that the underlying stocks that these ETFs held did not experience such drops. This does not inspire confidence in the stock markets … but we have to work with what we got. Overall stocks were up for the week with $SPX adding a bit under 1% while QQQ tacked on over 3%. Broad index charts are located here |
|
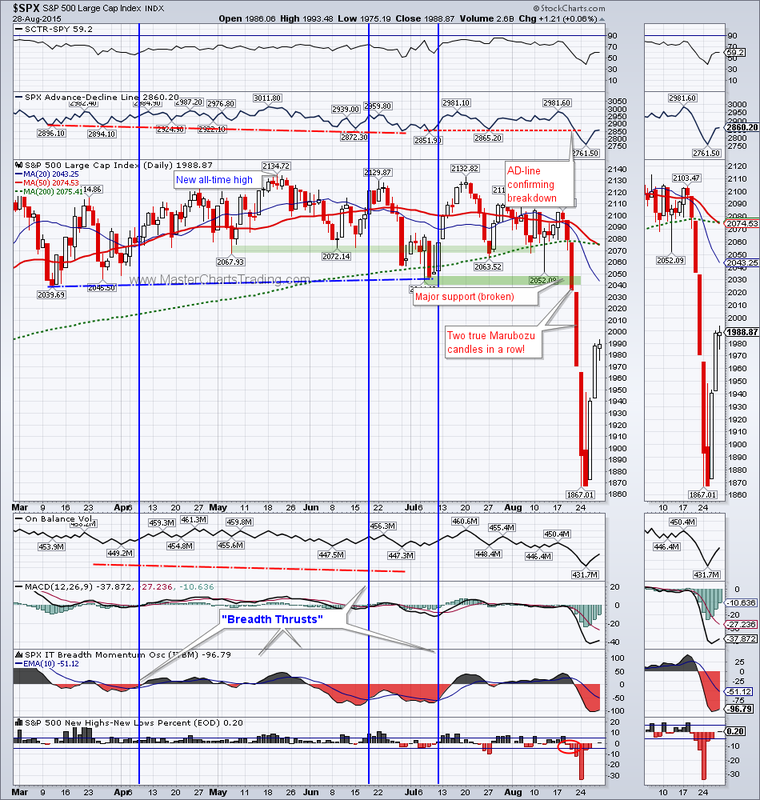
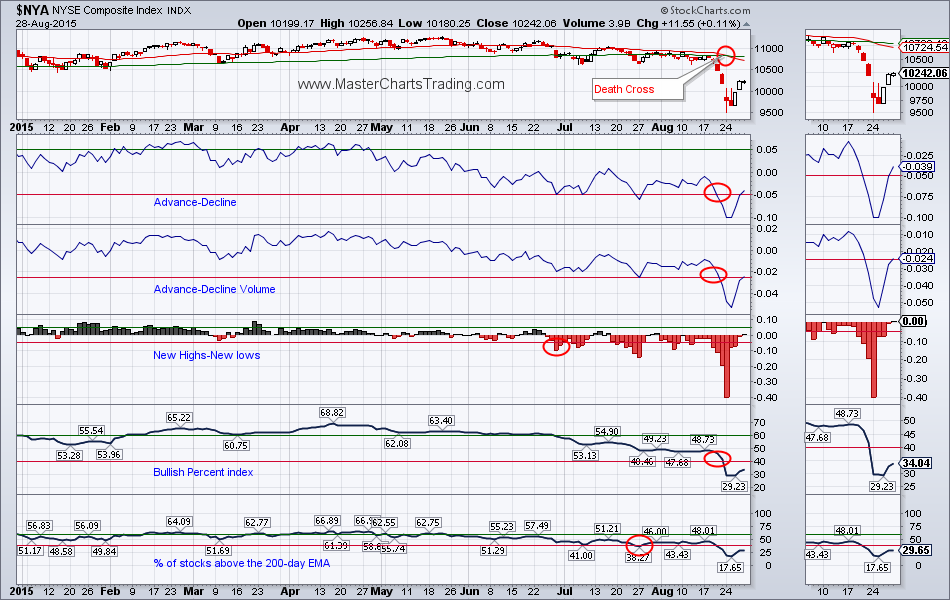
Last week I mentioned that market breadth deteriorated significantly for the Big Board (New York Stock Composite) and for the NASDAQ. I was waiting for the final confirmation from the Bullish Percent indices for both $NYA and the NASDAQ. Monday we got the bearish confirmation. Currently all ten of the market breadth indicators I follow are in the bear mode. In fact, we can add the Death Cross in the $NYA to the plethora of bearish indicators. Death Cross happens when the 50-day moving average crosses below the 200-day moving average. The NASDAQ composite’s 50-day is still above the 200-day for now.
Selling from the last week and from Monday was certainly overdone. The indices became clearly oversold and a snap-back rally ensued. If you were able to catch this move – good for you, but ideally, I would like to see market breadth get back to the bullish phase before jumping into stocks again. (Cash is a position.)
Selling from the last week and from Monday was certainly overdone. The indices became clearly oversold and a snap-back rally ensued. If you were able to catch this move – good for you, but ideally, I would like to see market breadth get back to the bullish phase before jumping into stocks again. (Cash is a position.)
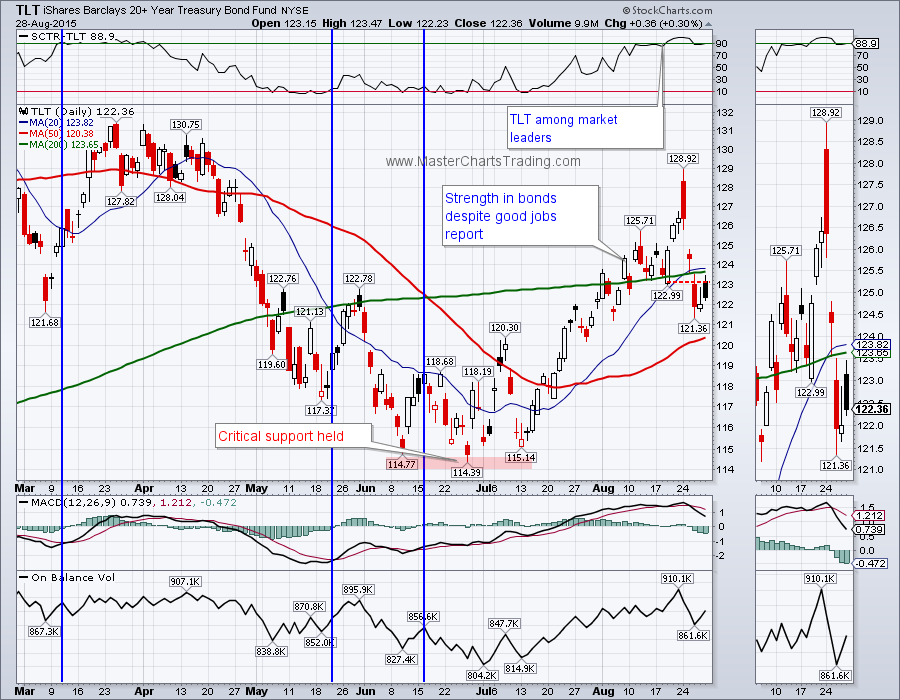
Bonds (TLT) ended the week with a loss. I think TLT is still long-term bullish, so I am viewing this as a corrective action in bonds. TLT is likely to correct further, possibly down to the 50-day moving average, but at that point it could represent a short-term bullish setup.
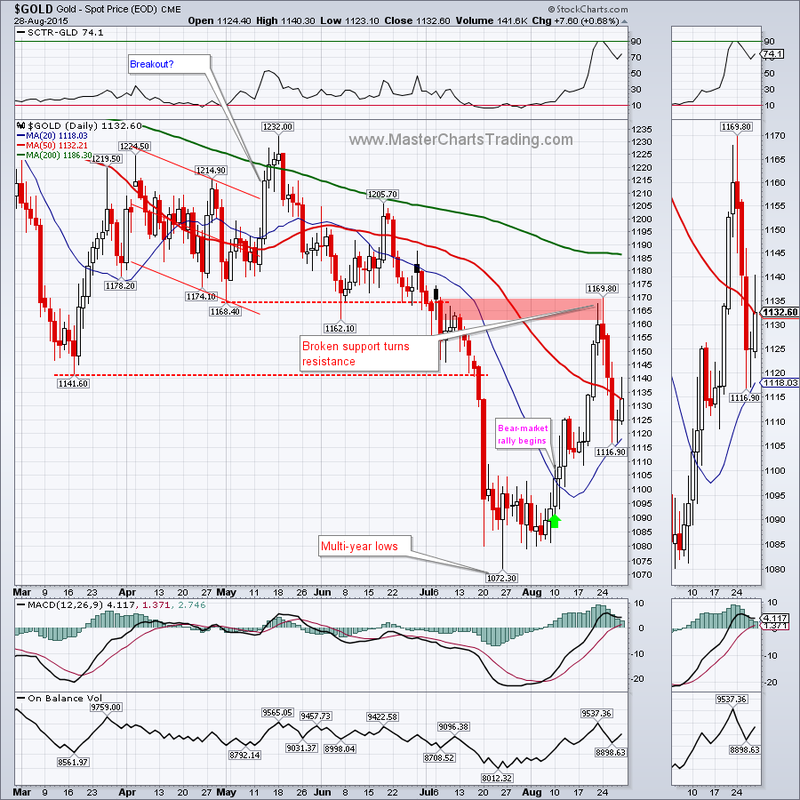
As if on cue gold ran into resistance in the $1169 area and pulled back. I am impressed with the gold’s ability to hold support around $1116. Even though gold is long-term bearish, I believe this counter-trend rally still has some room to run, at least to the $1169 area again. I am not yet comfortable shorting at this point, but will be once gold becomes more overbought then now.
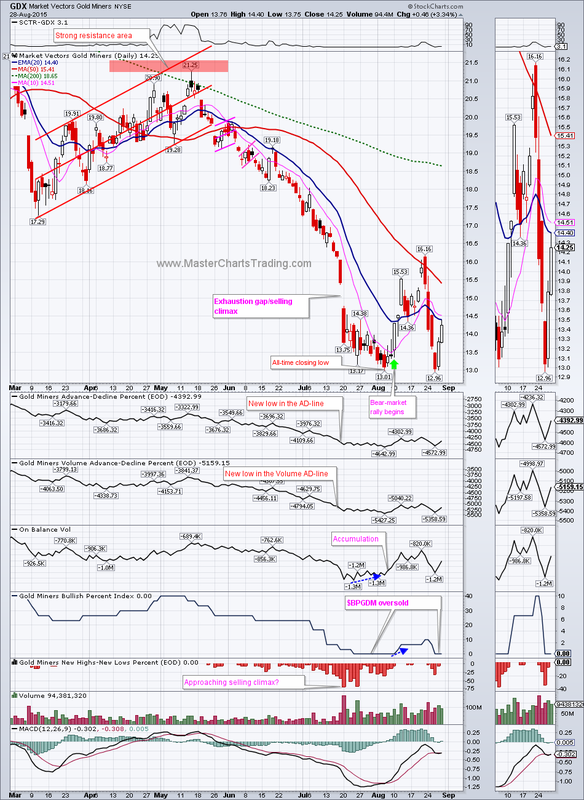
GDX followed more or less what gold did, but with larger amplitude. GDX again was at support on Wednesday and very oversold. The fact that GDX rallied off this support inspires confidence that it may try to retest its downward-sloping 50-day moving average again. As with gold, I would like to see GDX more overbought then it is now before shorting.
Charts of gold and gold miners
Oil ($WTIC) staged an impressive rally after hitting multi-year lows at $37.75, $WTIC is up over 12% for the week! Long-term oil is still bearish, so as with gold, I will be looking for shorting opportunities in the future.
Rebound in oil finally relieved the unrelenting pressure on the energy ETF – XLE. Several weeks ago XLE attempted to rebound, but quickly failed. Why? I think it is because oil did not follow XLE (or vice versa). This week XLE was extremely oversold on multiple indicators. For example the Bullish Percent index for XLE was at zero – truly a rare event. XLE has reached at least a short-term bottom for now. If oil holds up, we may see a rally in XLE up to the 50-day moving average or higher – so possibly another 7-10% or so.
XLE chart
PROGRAMMING NOTE!
I will be out of town the entire week until September 5th and our public charts will not be updated. I apologize for any inconvenience.
That’s it for this week’s market recap,
Best Regards and have another great trading week!
** Special Announcement**
We are close to launching a stocks alert service. Please sign-up for our mailing list to be the first to take


 RSS Feed