|
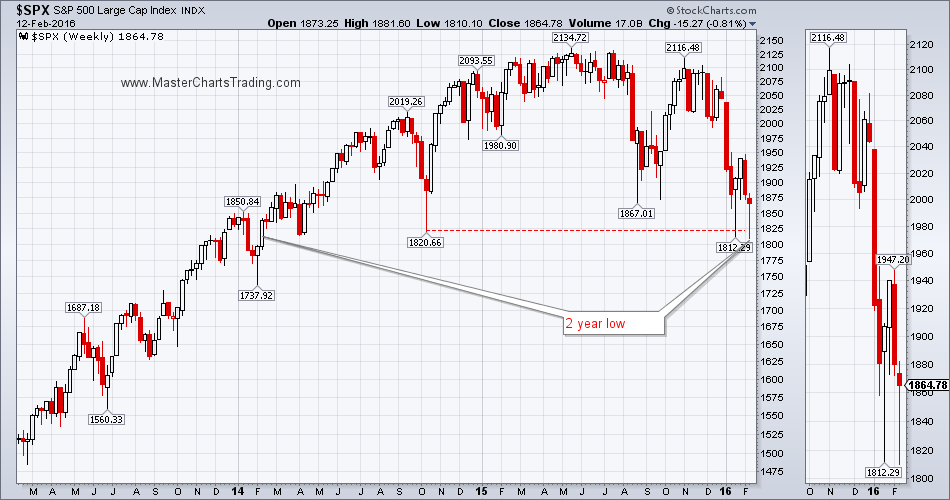
S&P 500 hit a two-year low on Thursday and then bounced strongly on Friday. Could this be the beginning of the long-awaited oversold bounce? Many signs are pointing towards it. For me, should this bounce materialize, it would be an opportunity to get short, as I am certainly not looking to bottom pick. Many traders attempt to pick bottoms in down trending stocks only to find their trading accounts shrink.
CHART OF $SPX |
|
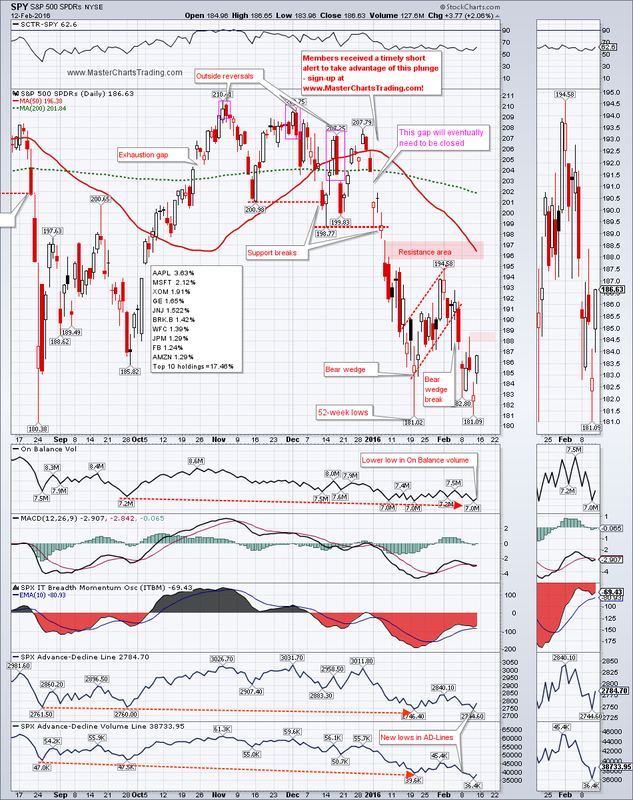
Chart of SPY seen below includes dividends, so it did not yet hit a 2-year low unlike the underlying $SPX, but came very close on Friday. SPY is approaching the first resistance level in the $188.50 area. Should that area be breached, the next strong resistance is in the $195 neighborhood.
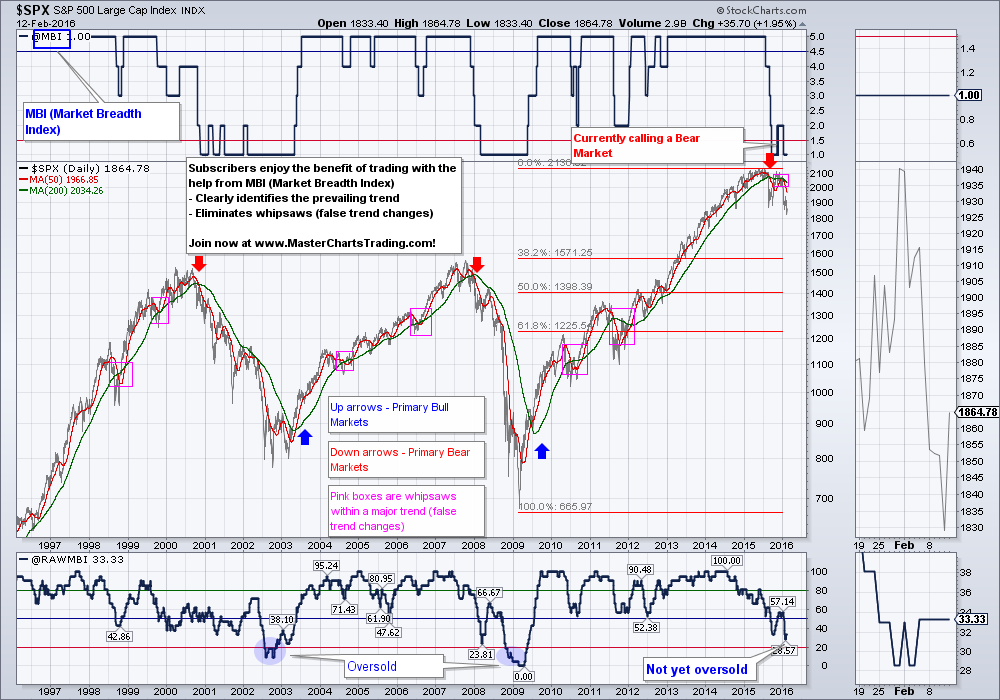
Many of the market breadth indicators for $SPX just hit new lows for the move. The On Balance volume, the Advance-Decline (AD) Line and the AD-volume line are all pushing lower. This is all confirming a long-term bearish posture. As I mentioned above, for now I am treating this rebound as a counter-trend rally.
What will it take for me to turn bullish? We need to see a strong, broad rally that would turn many of the indicators I am watching into the bullish territory. Then a pullback would provide for a good entry opportunity for me.
CHART OF SPY
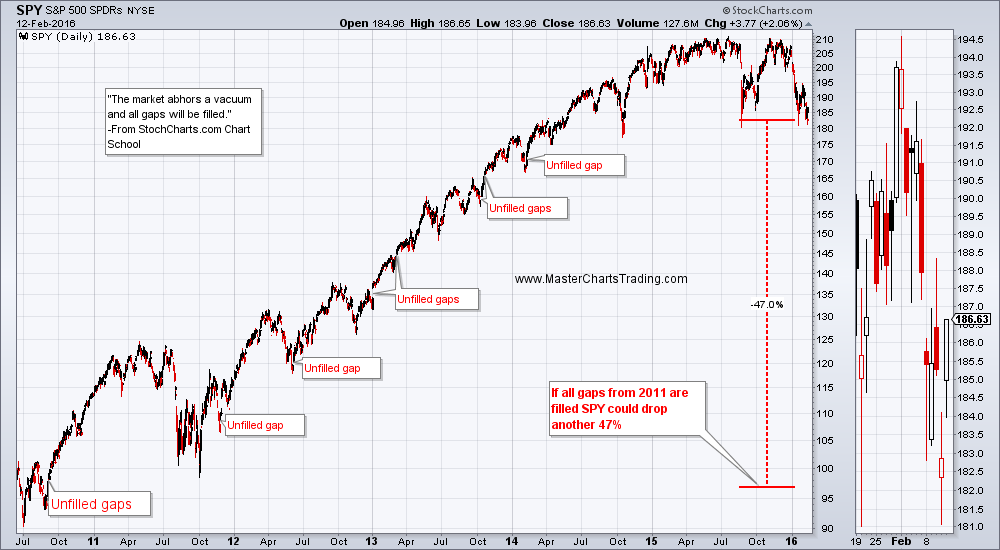
Many gaps on the chart of SPY dating back to as far as 2010 remain unfilled. An old Wall Street saying goes something like: “The market abhors a vacuum and all gaps will be filled.” Should this entire gap filling process materialize, we could see a drop of another 47% from today’s prices for SPY. This would translate to $SPX bottoming out somewhere around 1100 (not a prediction).
Unfilled gaps on chart of SPY
Unfilled gaps on chart of SPY
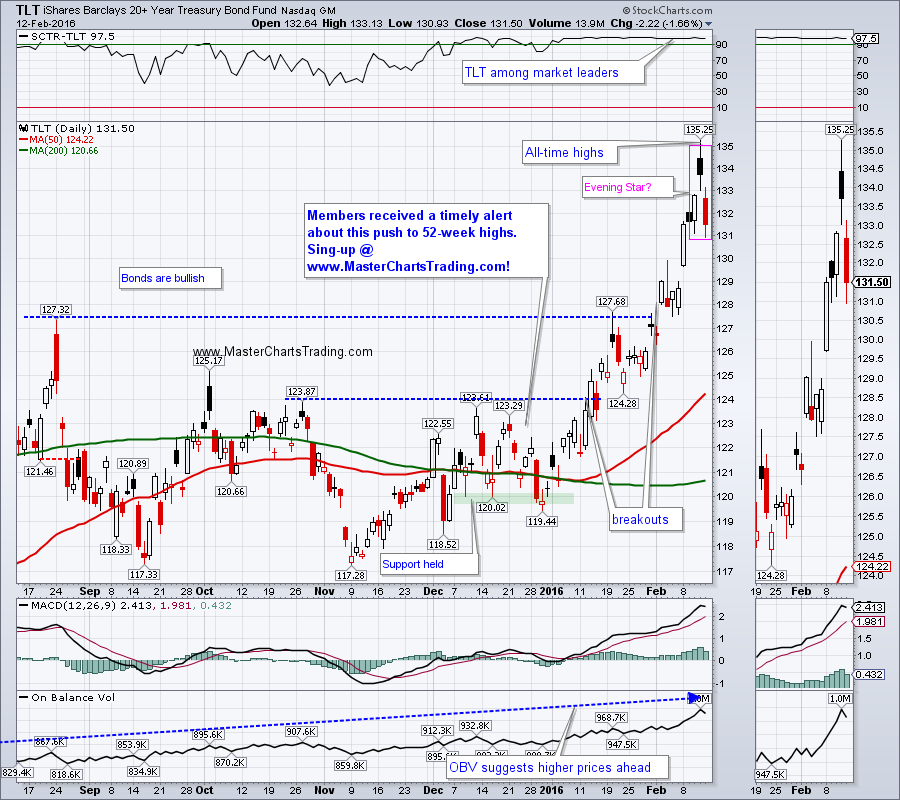
Bonds clearly benefited from all the turmoil in stocks and hit all-time highs this week. Worried investors simply want to return their capital. A return on capital takes a backseat during the bear market periods. TLT hit an all-time high at $135.25 (adjusted for dividends) and then pulled back on Friday. We now have a possibility of an Evening Star pattern on many bond charts, TLT included. Bonds moved powerfully off the November/December lows, so a pause in price gains could be upon us.
CHART OF TLT
CHART OF TLT
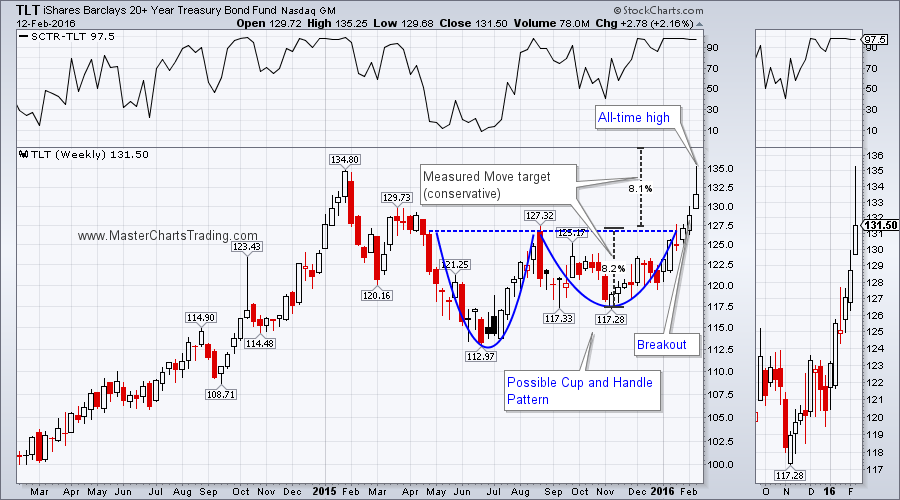
Long-term bonds and Treasuries still look very bullish and a breakout with a close above all-time highs looks possible.
LONG-TERM TLT CHART
LONG-TERM TLT CHART
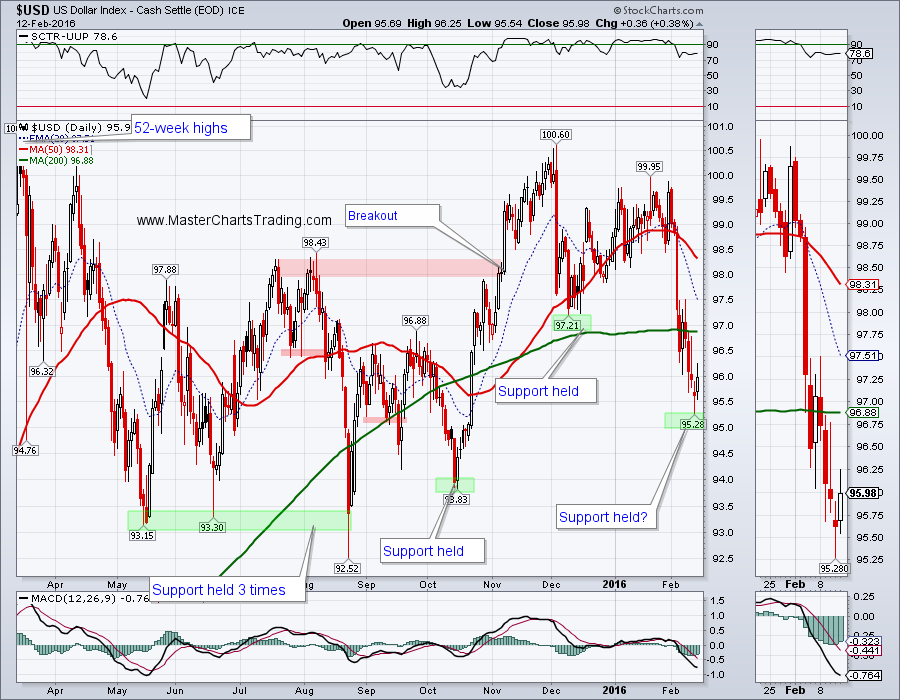
In the currency trading community there was lots of chatter of late about a reversal in the US Dollar. To me $USD chart still looks bullish. Most likely US Dollar bulls have already stepped in on Friday and this short trading week will likely see the dollar rebound to around the 200-day moving average.
CHART OF $USD
CHART OF $USD
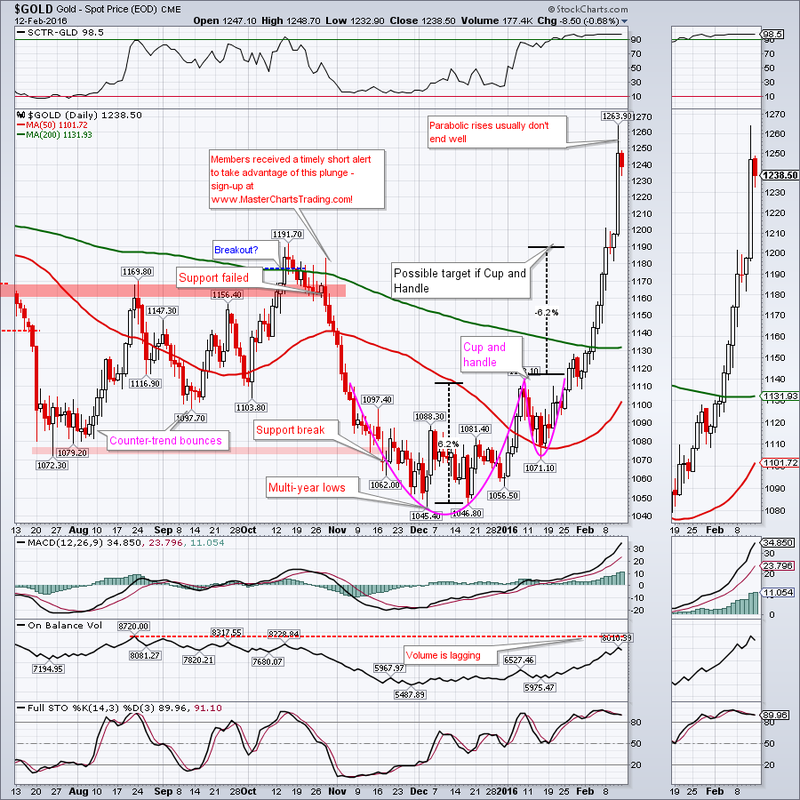
On to the touchy subject of “has gold finally ended its bear market”? The short answer to that is: I don’t think so just yet.
Now the long answer…
Gold bottomed out in early December of last year at $1045.40. If you were lucky enough to buy at the very bottom and exit at the very top in just 2 month, you would have made around 21%. One doesn’t have to be a market professional to see that gold is extremely overextended to the upside in the short-term. So even the ardent gold bugs would agree that at the very least a short term pullback is in order.
GOLD CHART
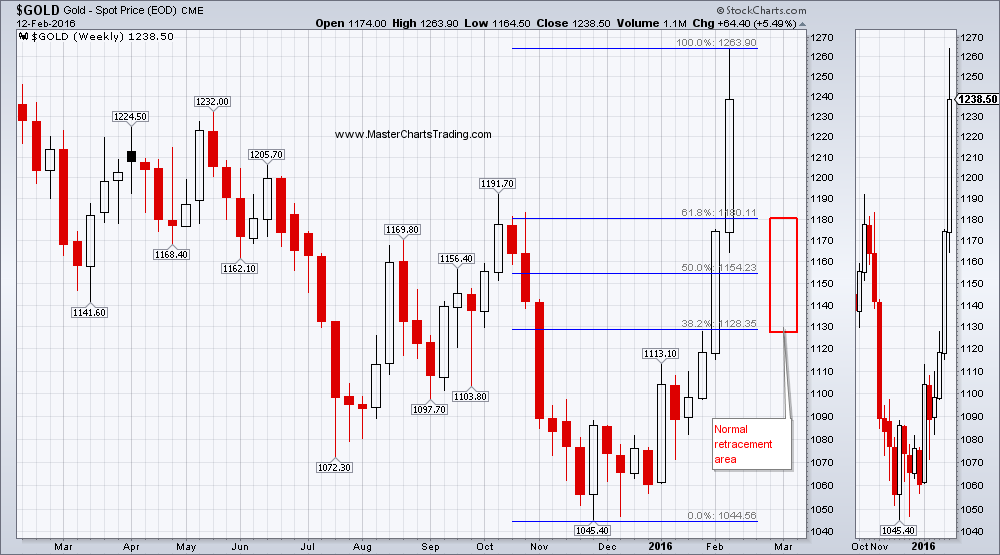
From a longer-term perspective, where would this pullback take gold? I drew in Fibonacci retracements from the December bottom to this Thursday’s top. As you can see, a normal pullback can take gold back down to at least $1180, or even lover to $1130. A deeper pullback below $1130 would most likely indicate a failure of this possible breakout and a retest of multi-year lows.
LONG-TERM CHART OF GOLD
LONG-TERM CHART OF GOLD
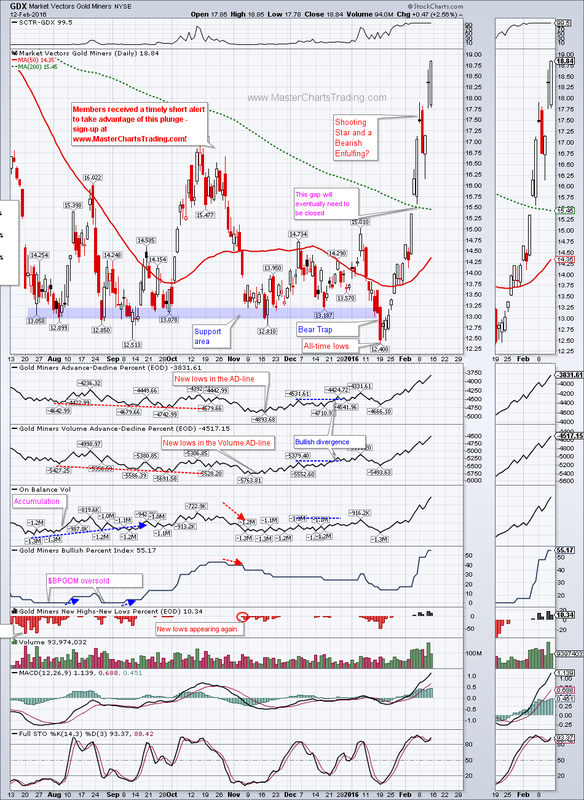
Gold miners of course move a lot more then gold and are up a little over 50% since bottoming in early January. This advance is extremely steep. Should gold roll over, GDX is surely going to follow in its steps, albeit in its normal volatile fashion.
CHART OF GDX
CHART OF GDX
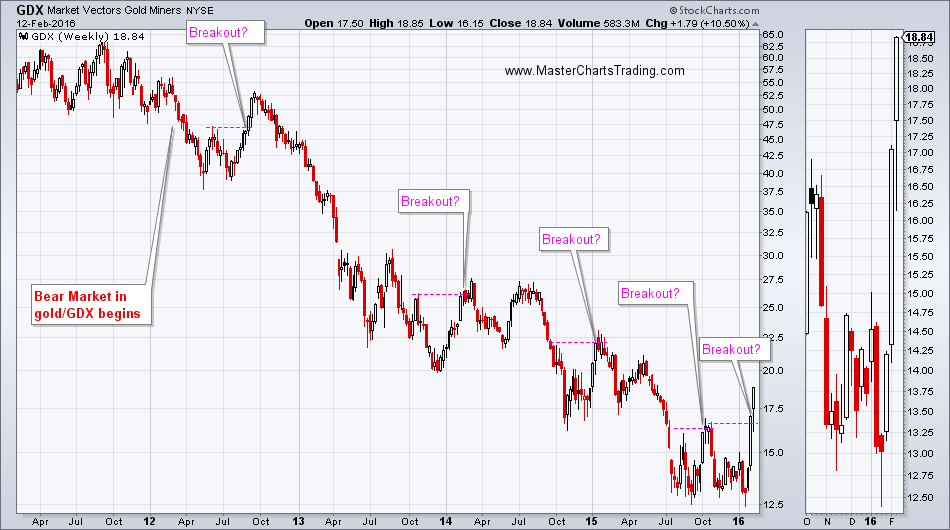
Looking at the weekly GDX chart going back 5 years, we can see that GDX had similar breakout attempts in the past. Ultimately these breakouts failed and we saw new lows in both gold and GDX. Will this time be different? LONG-TERM GDX CHART
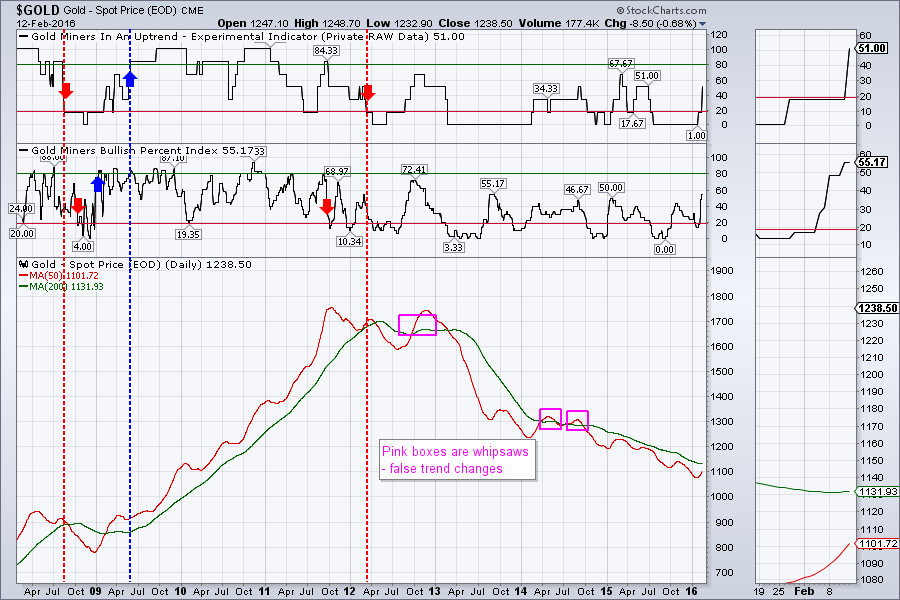
Next chart shows that we are not yet in a new bull market for gold. According to the parameters I follow, at the very least we need to see two of the following:
1.A 50-day moving average cross above the 200-day moving average
2.Bullish Percent index surge above 80
3.My in-house Gold Miners in an uptrend indicator cross above the bullish threshold.
As of the close on Friday, February 11 there were zero of the above three in the bullish camp. Until more improvement manifests, I will treat this “breakout” as a bear-market rally.
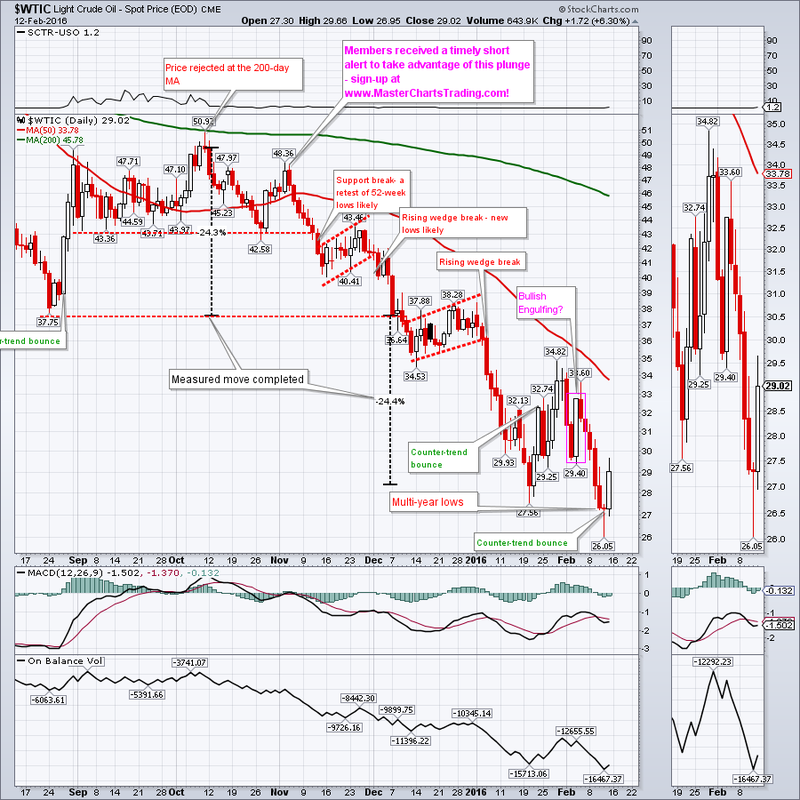
Oil got a big oversold bounce on Friday. The bigger picture is still rather bearish, but a rally to around $35 cannot be excluded. There is a lot of overhead resistance in that area from the broken support and the failed rally attempt in late January.
CHART OF $WTIC
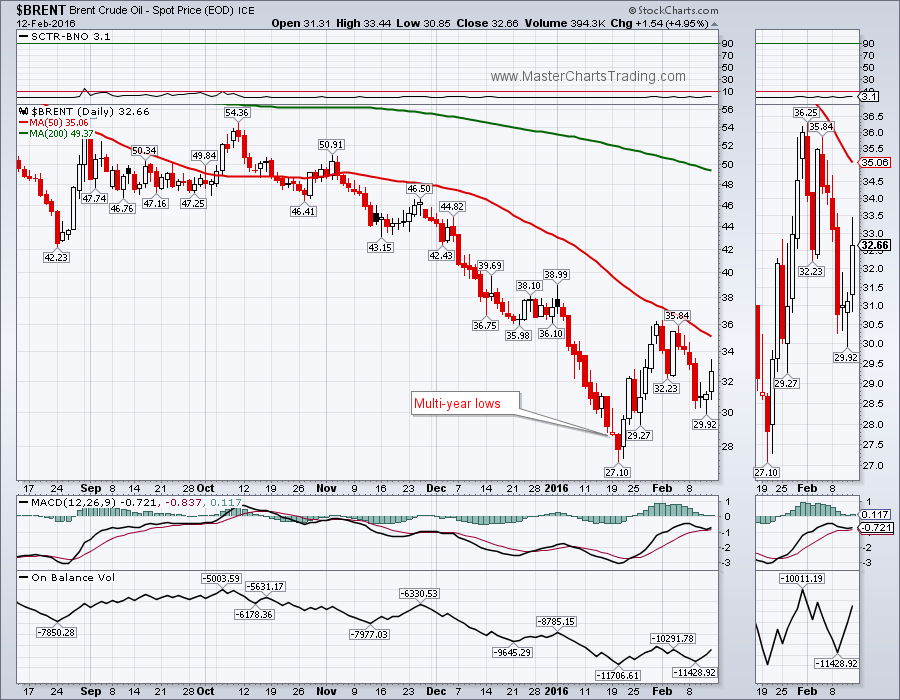
Interestingly, the Brent benchmark for crude oil did not make a lower low, unlike its US West Texas Intermediate counterpart. We could potentially read it as a bullish divergence.
CHART OF $BRENT CRUDE
CHART OF $WTIC
Interestingly, the Brent benchmark for crude oil did not make a lower low, unlike its US West Texas Intermediate counterpart. We could potentially read it as a bullish divergence.
CHART OF $BRENT CRUDE
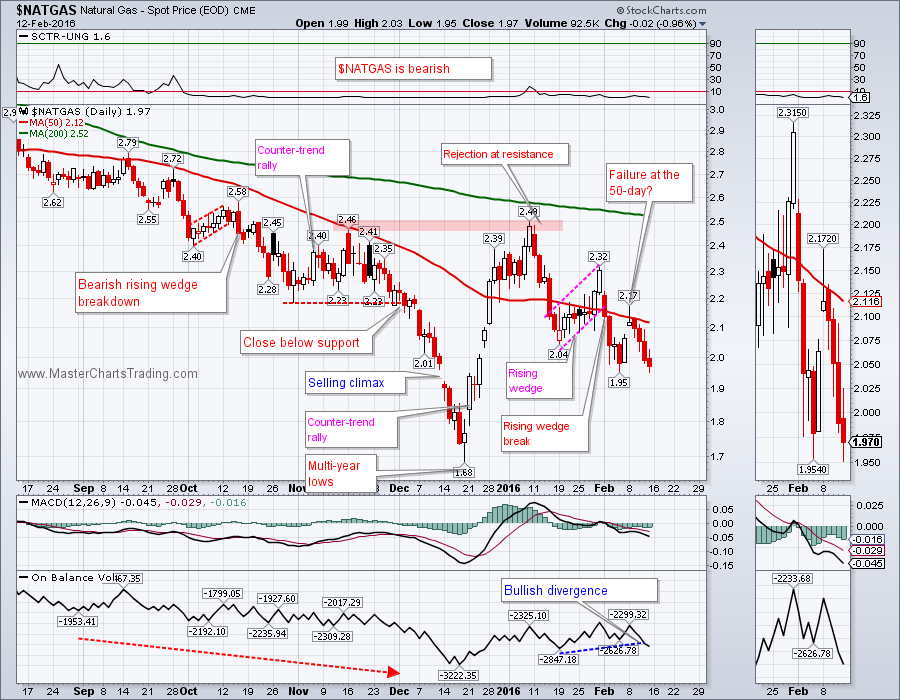
NATGAS seems to have failed at resistance just at the 50-day moving average and is attempting to break below the early February lows. Should it succeed, a retest of multi-year lows is very likely.
CHART OF NATGAS
CHART OF NATGAS
Trade Alerts Service is now live – please sign-up here!
That’s it for this week’s market recap,
Best Regards and have another great trading week!
Alexander Berger (www.MasterChartsTrading.com)
That’s it for this week’s market recap,
Best Regards and have another great trading week!
Alexander Berger (www.MasterChartsTrading.com)


 RSS Feed