|
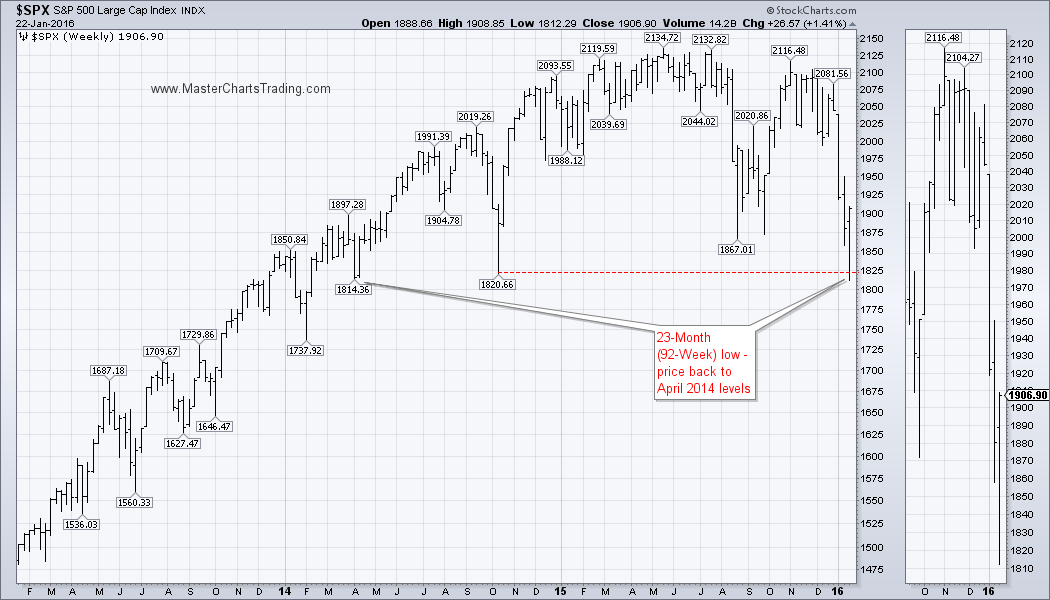
Stocks spiked to 92-week lows on Wednesday and bounced towards the end of the week. 92-week low is an awkward number, but it translates into a 23-month low not seen since April of 2014. Technically, I cannot call this a multi-year low just yet, but we certainly look set to continue on the downside.
CHART OF $SPX LONG-TERM $SPX CHART |
|
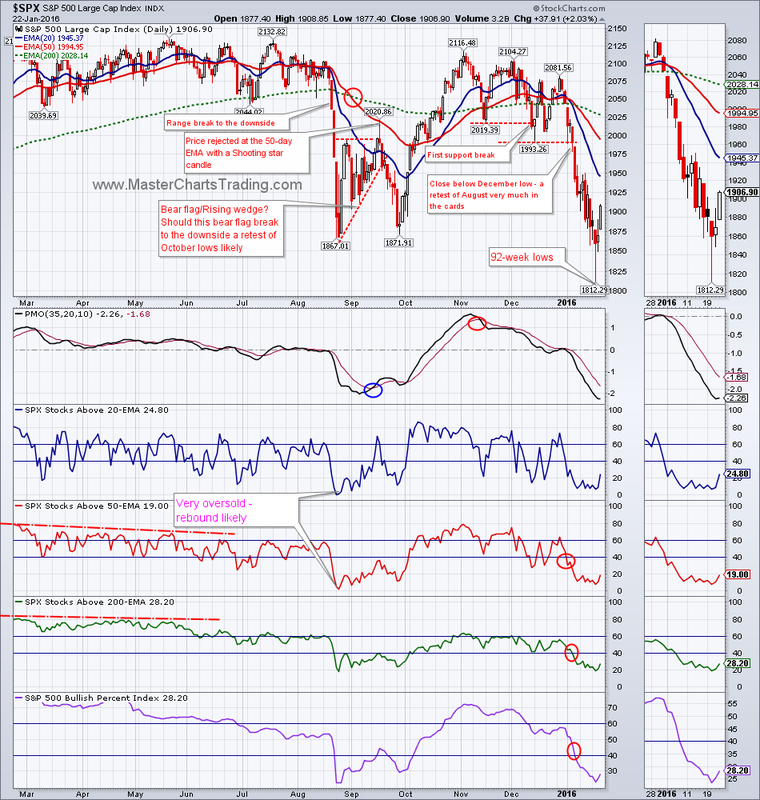
I have been saying that stocks entered a bear market some time in September of last year. The October 2015 rally that almost reached new highs was likely the first bear-market rally of this new bear market. (A bear market is characterized by lower lows and lower highs.) I think we are currently in the 2nd bear market rally. Speculators will attempt to pick bottoms and push the prices higher, but trend traders (me included) will look for the signs of failure and attempt to time the entry on the short side. Subscribers are already sitting on around 8% profit from the short we opened in December.
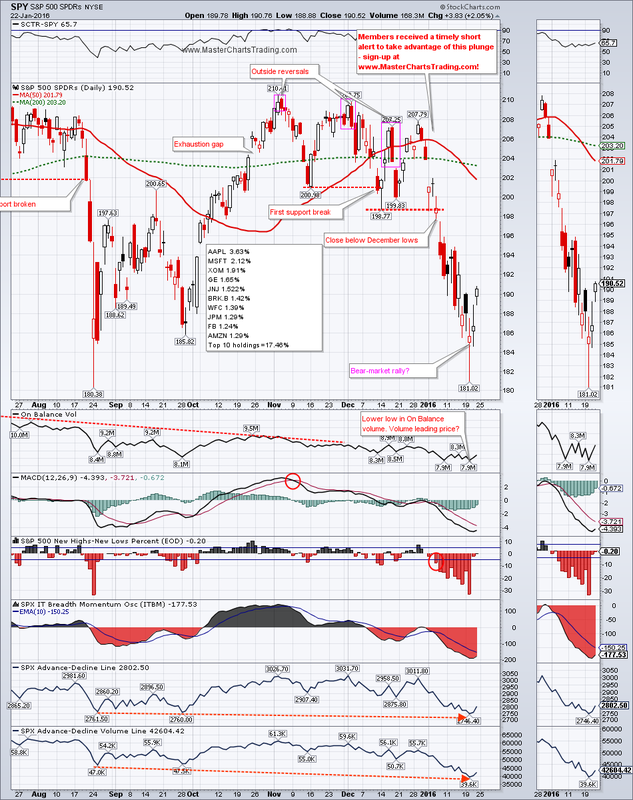
For now market breadth is decidedly bearish and the only positive thing I could say about it is that breadth is somewhat “oversold”. However, oversold in a downtrend is not very relevant because during the downtrends oversold is a rule rather then an exception. In downtrends we will look for overbought conditions to time short entries rather then attempt to pick bottoms. The bigger trend is down, so why fight it?
CHART OF SPY
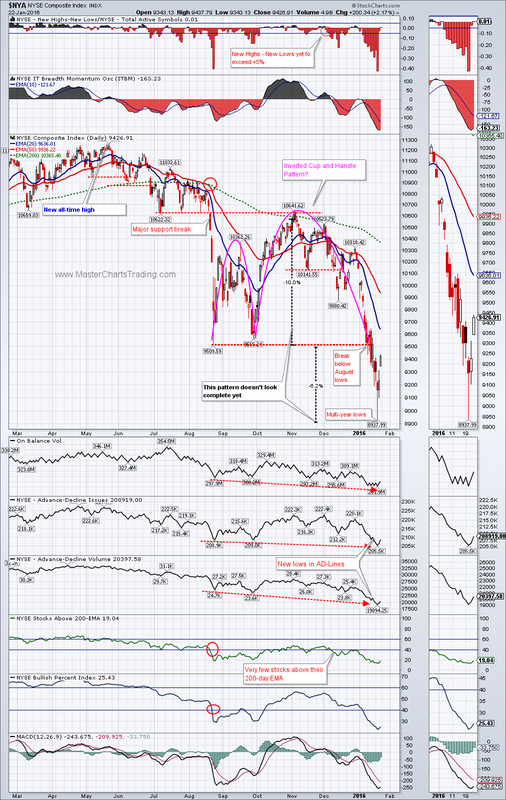
I pointed out a possible inverse cup and handle pattern the chart of New York Stock Exchange Composite ($NYA) a few weeks back. Looking at the chart, it doesn’t look complete yet. At a minimum the downside target is about 8500, we got down only to around 8900.
CHART OF $NYA
CHART OF $NYA
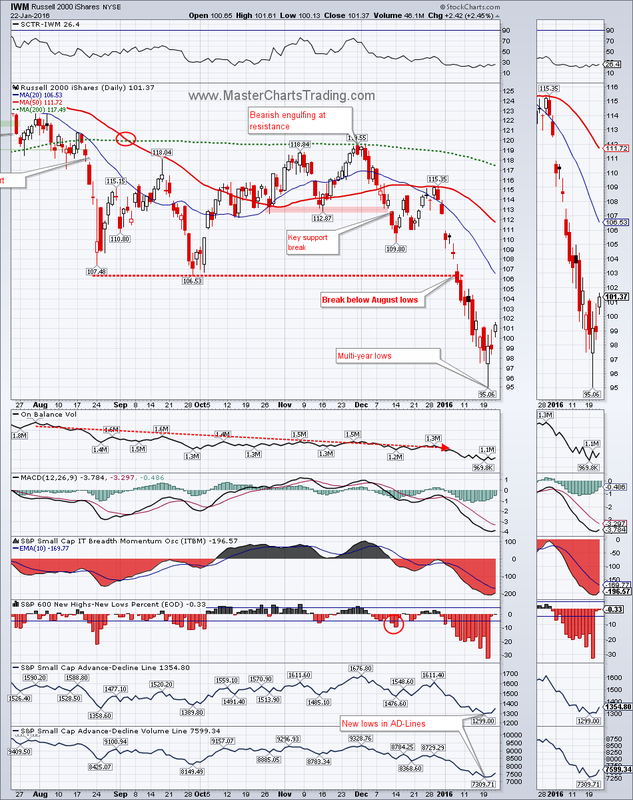
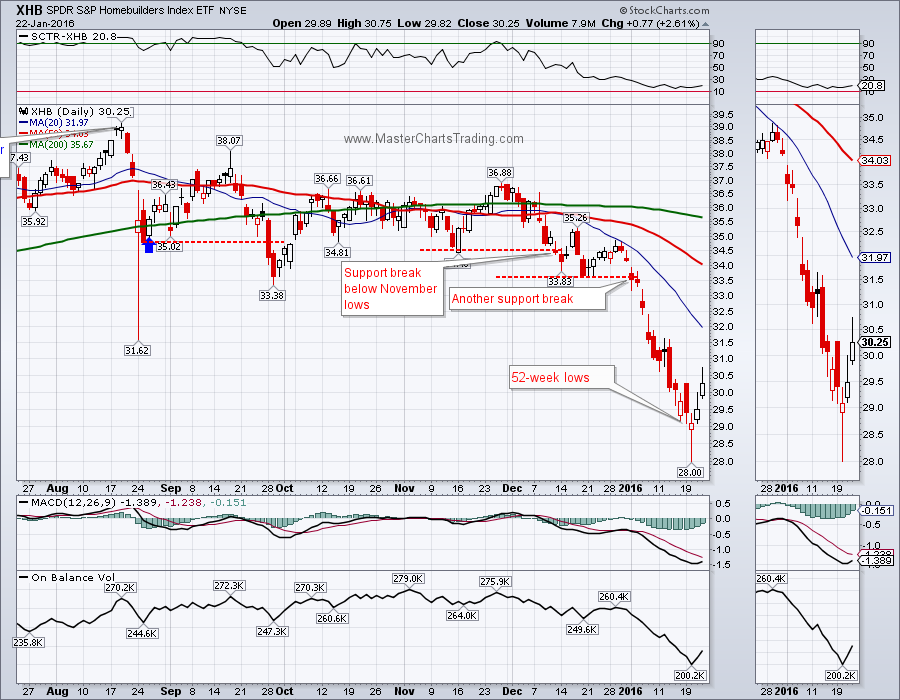
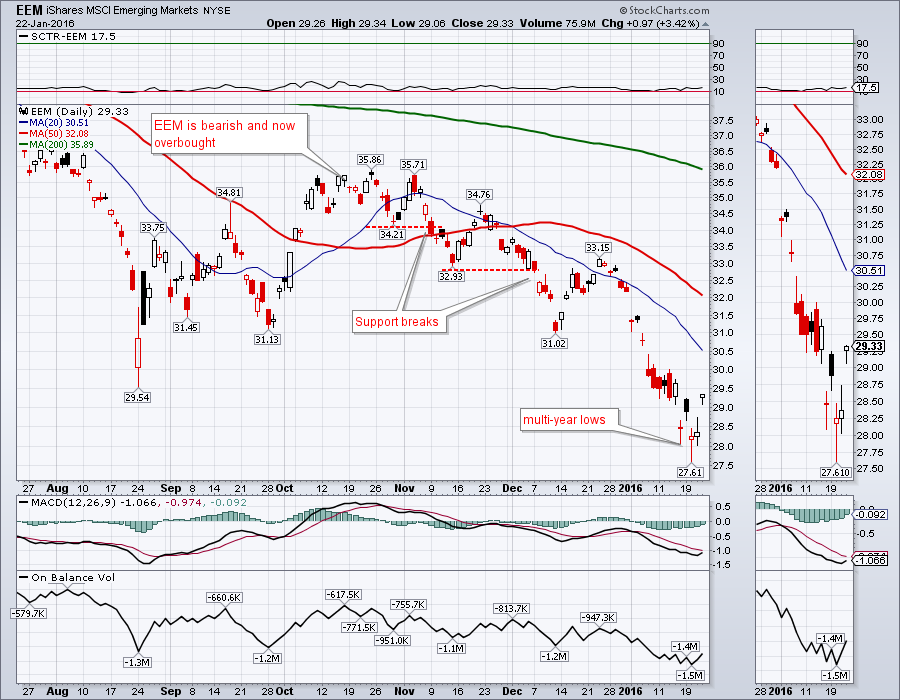
Many of the higher beta ETFs hit multi-year lows and 52-week lows this week as well. IWM (small caps), XHB (homebuilders), EEM (emerging markets) are pretty much following the general market, but from the much lower levels and are by extension much weaker the general market.
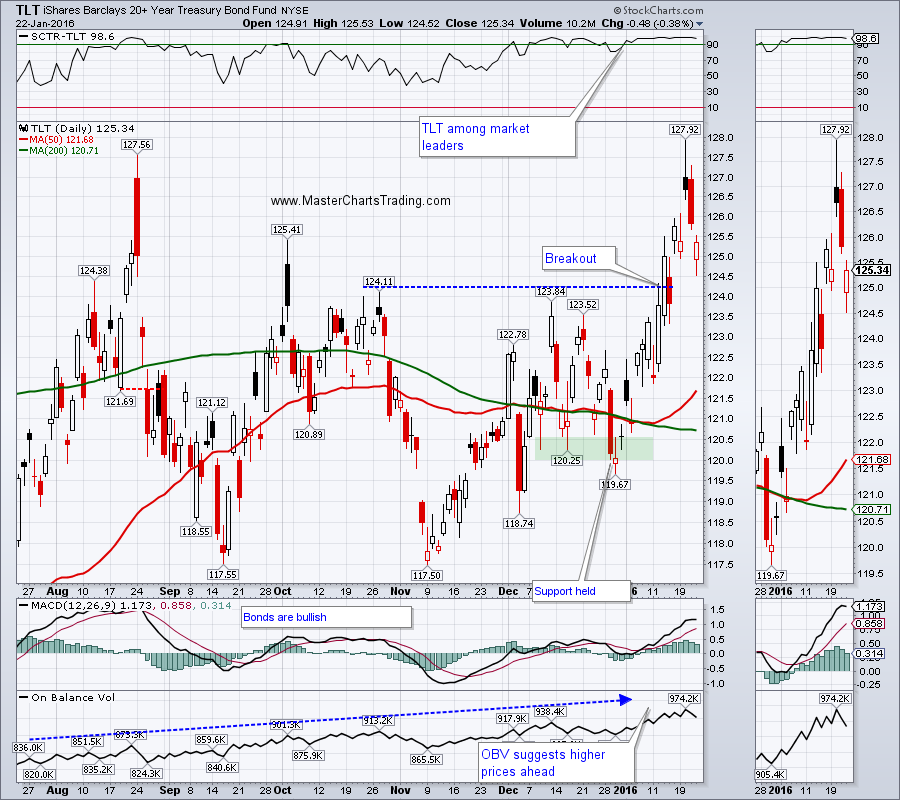
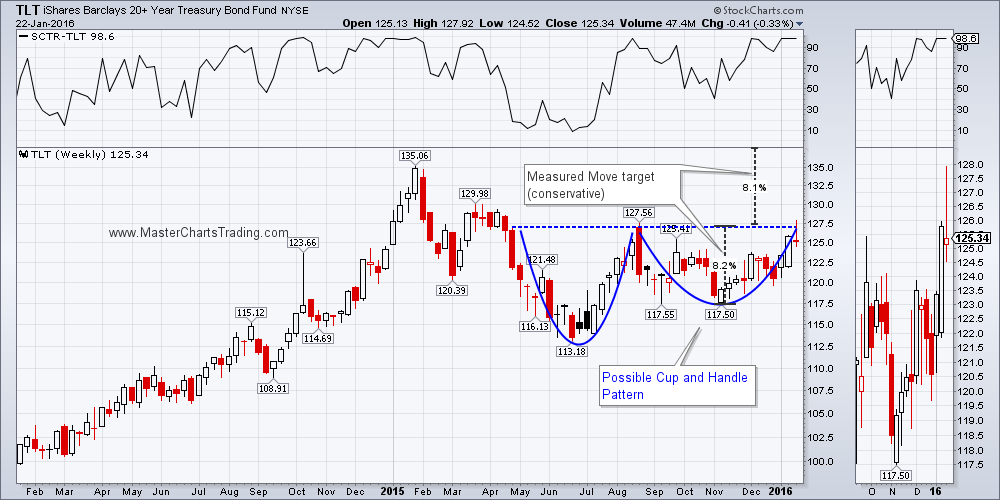
Bonds broke out above September-October highs, but fall back this week. For now the breakout is holding and the pendulum is swinging in favor of stocks, at least temporarily. I think bonds are bullish and the longer-term weekly chart shows a possible cup and handle formation. A breakout above the lip of this cup with a weekly close above $127.56 should trigger the move higher. A conservative estimate is at least a challenge of all-time highs from 2015. A more aggressive estimate would call for new all-time highs some time in the next 3-6 month.
CHART OF TLT
LONG-TERM TLT CHART
CHART OF TLT
LONG-TERM TLT CHART
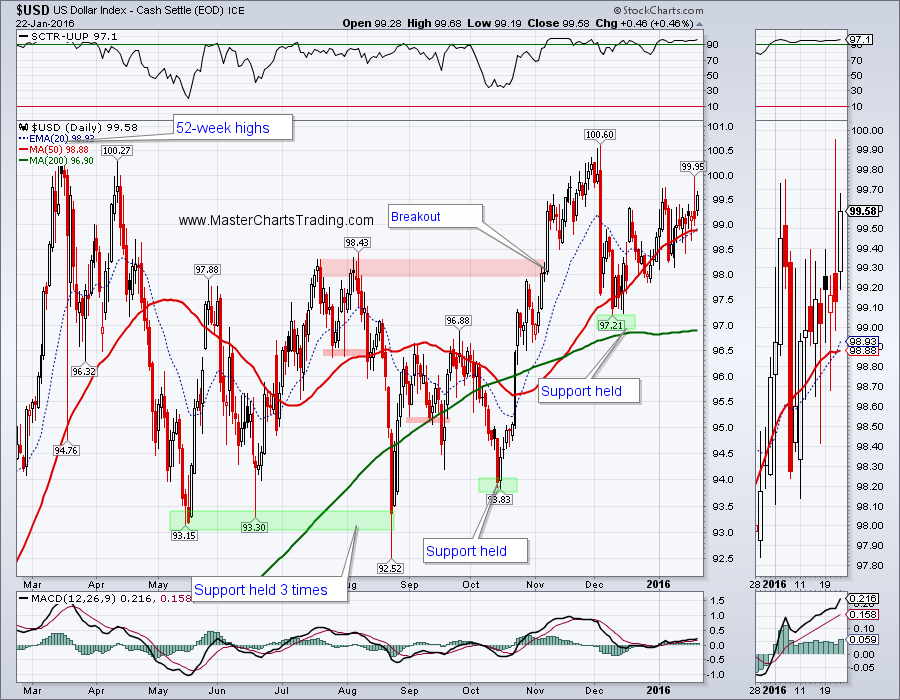
The dollar is still pushing towards 52-week highs. There were fresh hints for more stimuli from Mario Dragni and Haruhiko Kuroda, respectively of the European Central Bank and the Bank of Japan. This is understandably bullish for the US dollar.
CHART OF $USD
CHART OF $USD
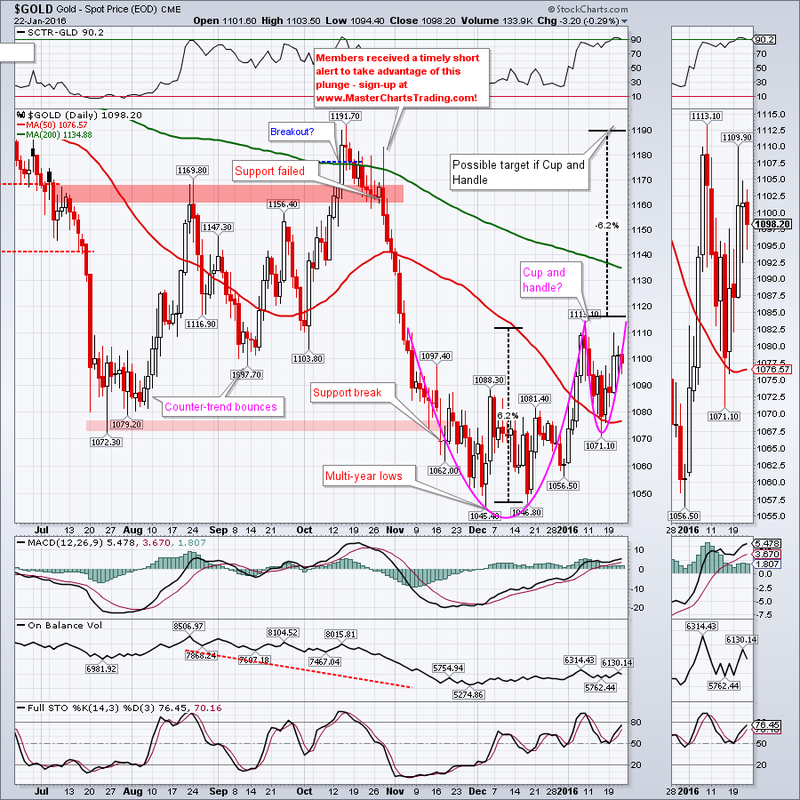
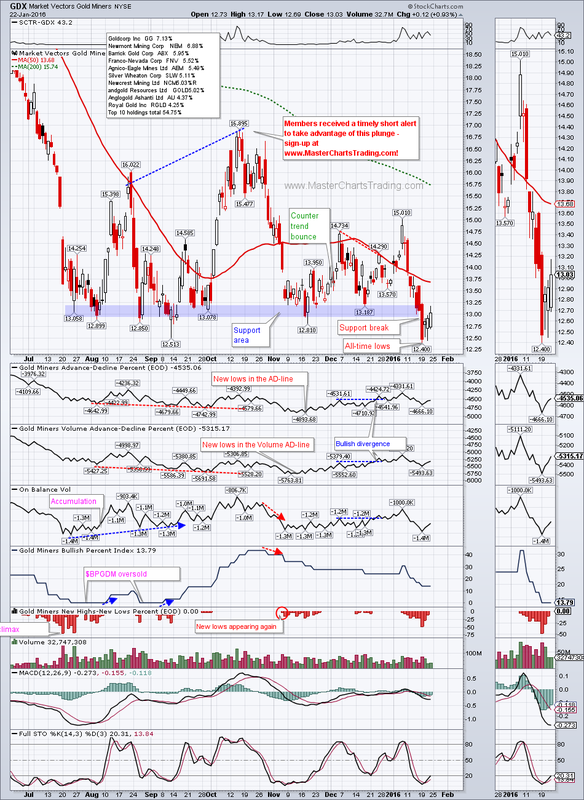
Gold and gold miners are sending mixed messages: gold is trading above its 50-day moving average, while GDX crashed through support, hit an all-time low and is now trading below the 50-day. Which one is correct? It is indeed difficult to say sometimes, and when such conundrums hit me, I simply stay out of the particular market.
My gut feeling is that gold is correct and a rally to $1140 or even $1190 is not to be ruled out. Its possible that a cup and handle pattern is playing out on the chart of gold. If correct $1190 would be the upside target for the move.
GOLD CHART
My gut feeling is that gold is correct and a rally to $1140 or even $1190 is not to be ruled out. Its possible that a cup and handle pattern is playing out on the chart of gold. If correct $1190 would be the upside target for the move.
GOLD CHART
GDX chart is a mess, but if gold rallies, there is no early reason why GDX should not at least attempt a bounce to around $15.
CHART OF GDX
CHART OF GDX
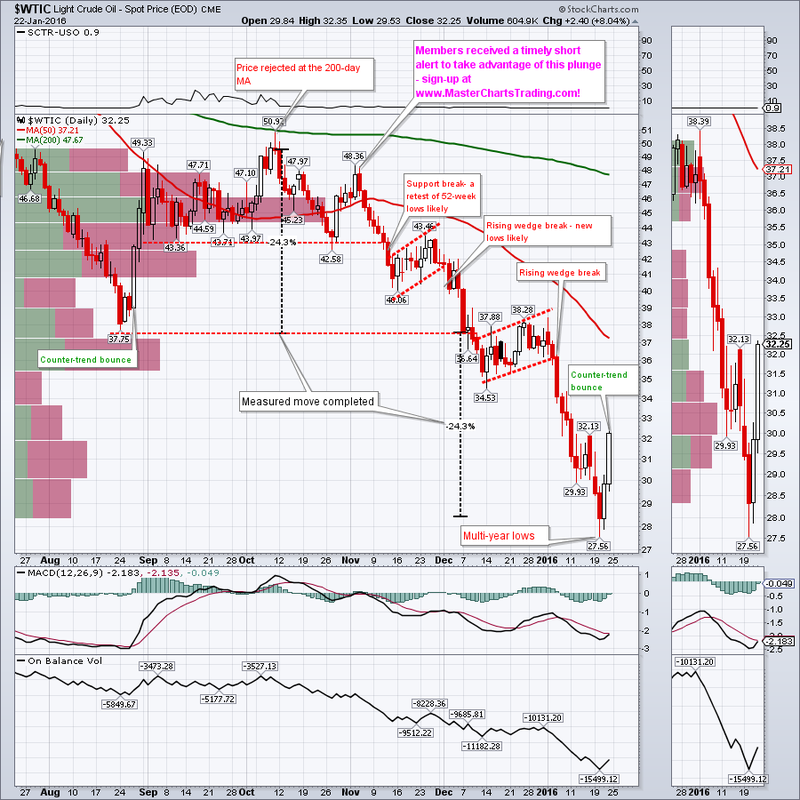
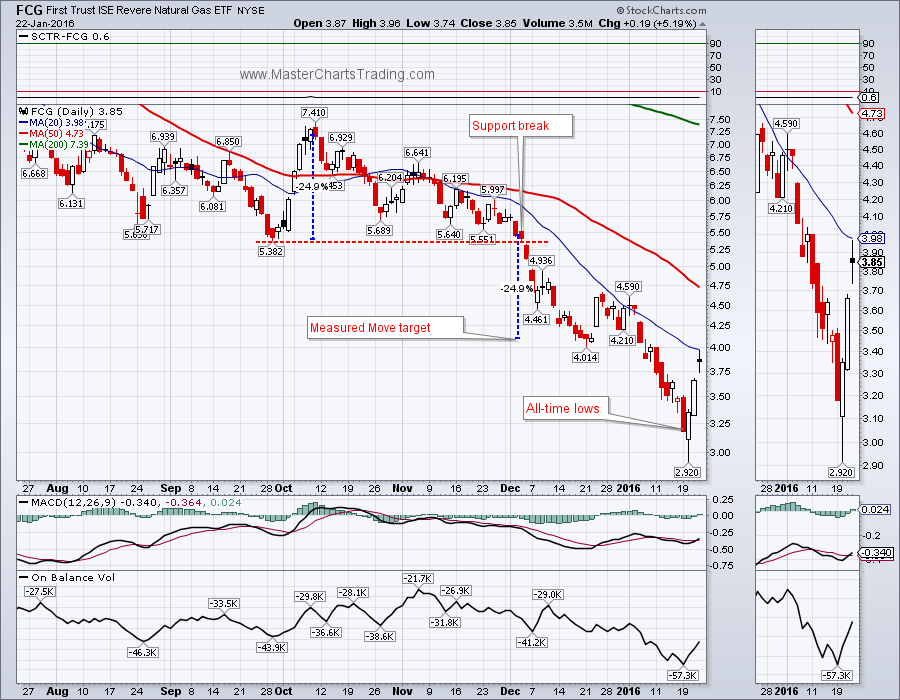
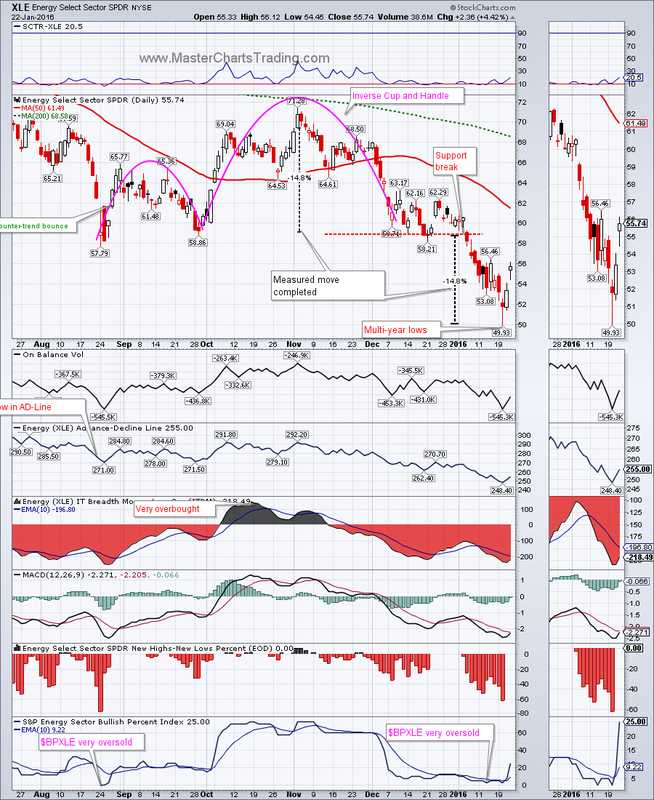
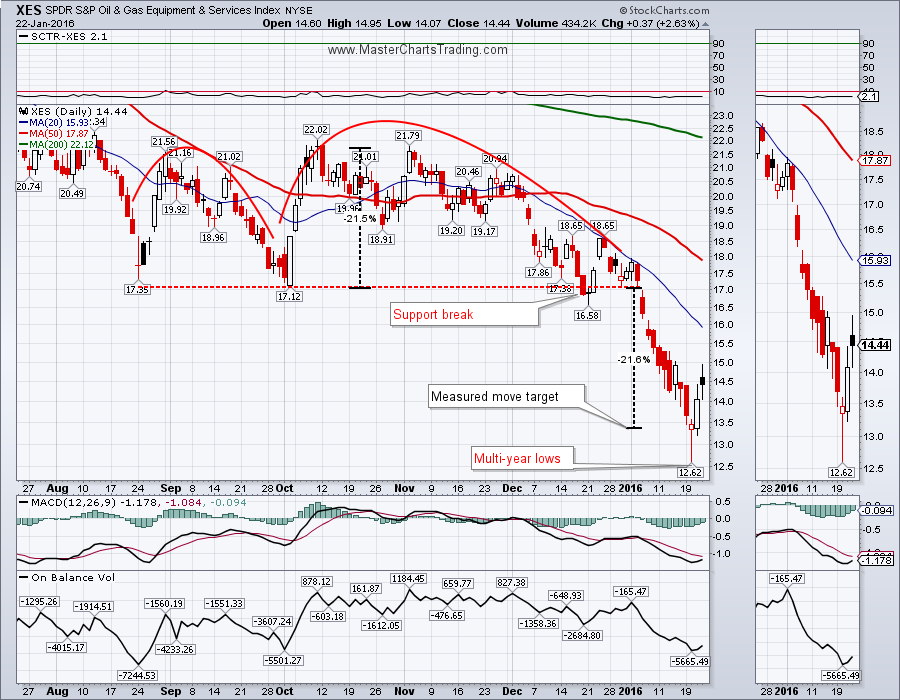
Last week I pointed out that several oil related funds such as Energy fund (XLE) and Oil & Gas Equipment Services fund (XES) completed their downside targets for now. (Of course occasionally an overshoot occurs like the one that just happened with the gas-related ETF – FCG.) But, lo and behold XLE and XES bounced (along with the rest of the market) at exactly the targets! More importantly, a similar pattern completed on oil chart, and we got a strong short-covering rally. Last time a similar rally occurred was in August of last year and oil bounced as much as 35%. Current bounce is around 17%, so more upside would not surprise me. Bigger trend is clearly down (we hit multi-year lows), so I will be looking for signs of a failure. There is some resistance in the $37 area, and very strong resistance in the low to mid $40s.
CHART OF $WTIC
CHART OF $WTIC
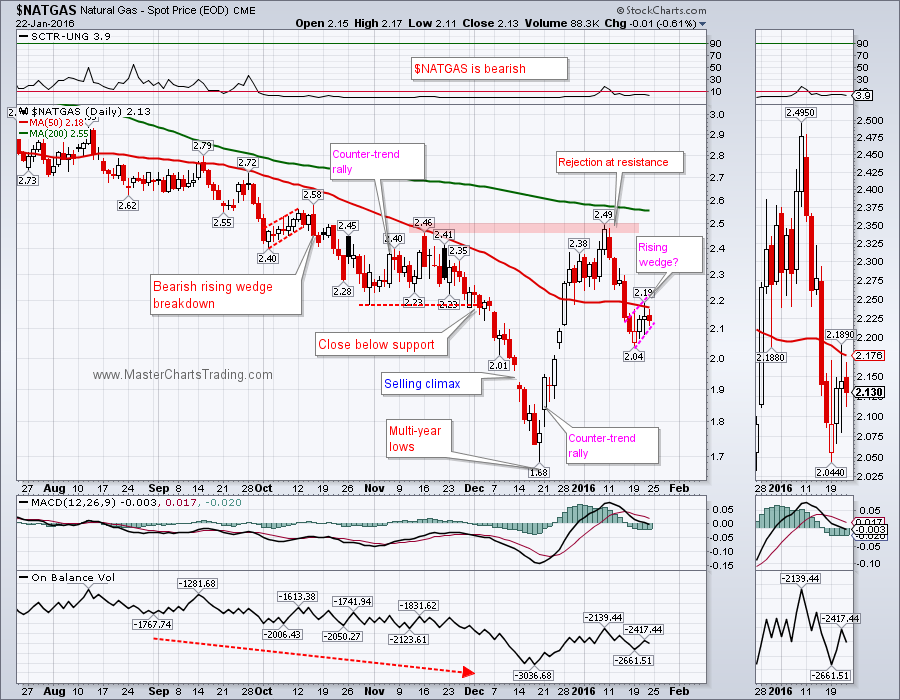
NATGAS is a bearish security. Chart of NATGAS is showing a possible rising wedge. As I said before, a rising wedge in a bearish security is a bearish continuation pattern, once the wedge is broken to the downside. Should this wedge break down, a retest of multi-year lows would be very likely.
CHART OF NATGAS
CHART OF NATGAS
Trade Alerts Service is now live – please sign-up here!
That’s it for this week’s market recap,
Best Regards and have another great trading week!
Alexander Berger (www.MasterChartsTrading.com)
That’s it for this week’s market recap,
Best Regards and have another great trading week!
Alexander Berger (www.MasterChartsTrading.com)


 RSS Feed