Charts mentioned are located here http://stockcharts.com/public/1229503/tenpp
|
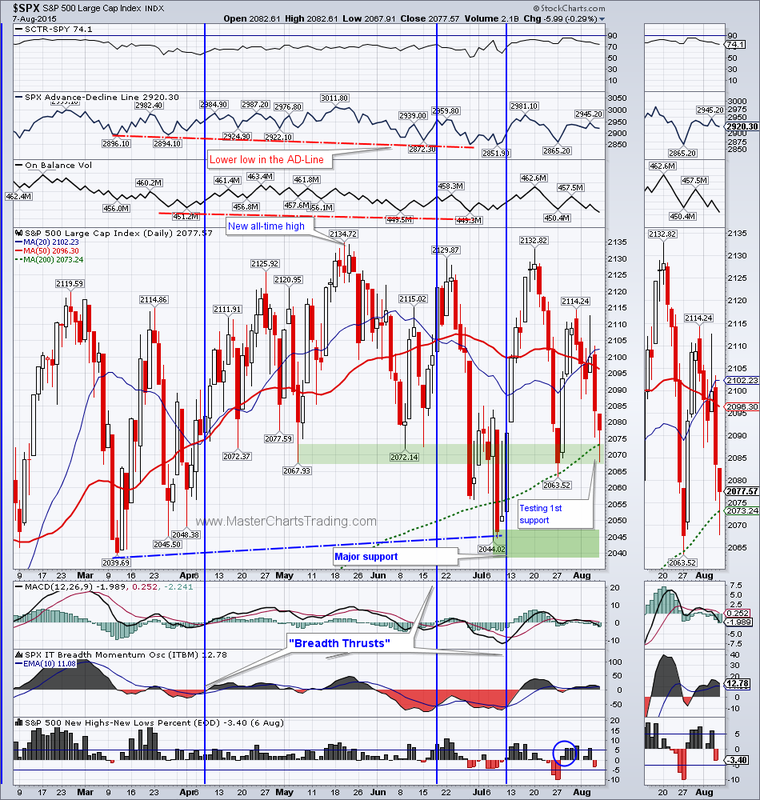
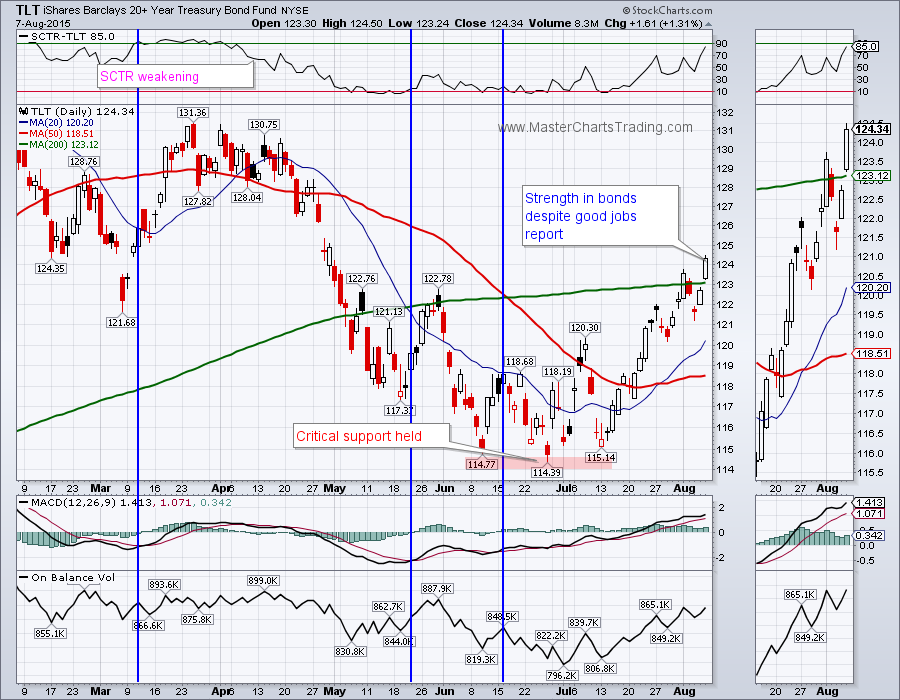
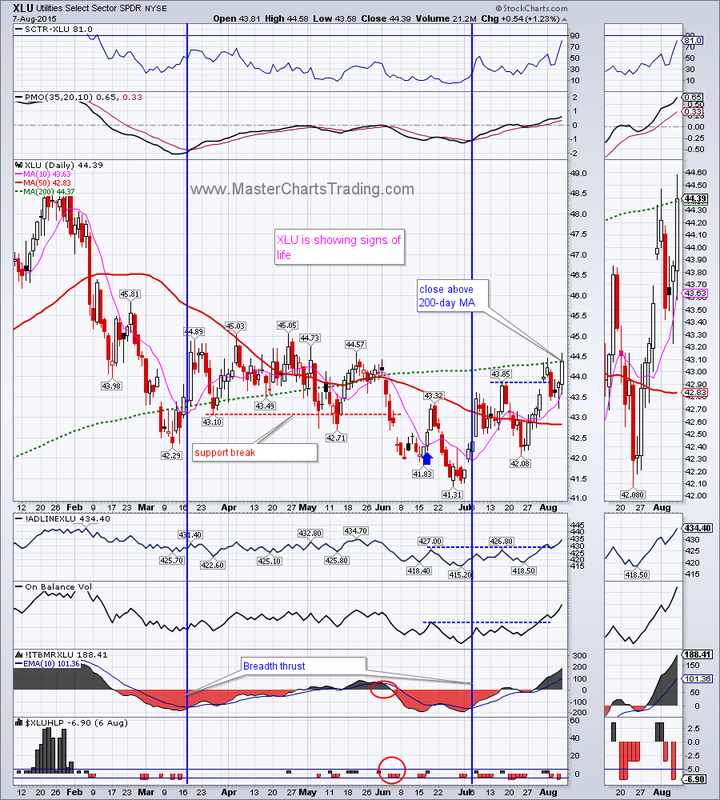
I am getting a feeling that some sort of a “flight to safety” is taking place within the markets. Of the major ETFs two gainers stood out: bonds (TLT) and utilities (XLU). These assets are the traditional go-to during the time of market stress. On average stocks ($SPX) lost a little over 1% for the week – not much of a concern for me at this point.
|
|
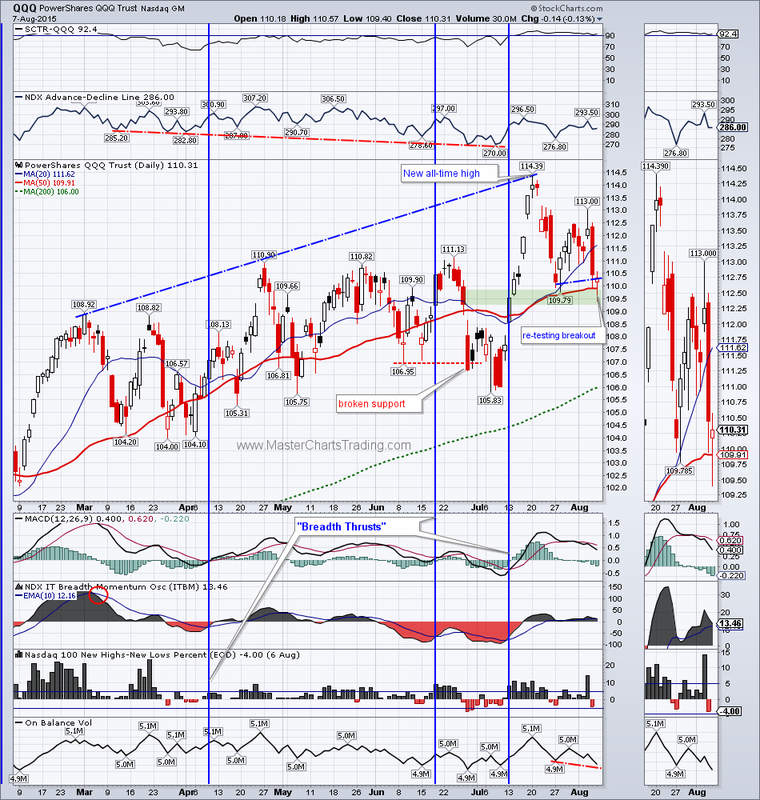
QQQ is holding up better then the rest of the major ETFs, even though it is retesting its prior breakout for the second time in as many weeks. Volume pattern for QQQ is suggesting we may see some lower prices ahead first, before the uptrend resumes. Market breadth is still lagging for QQQ.
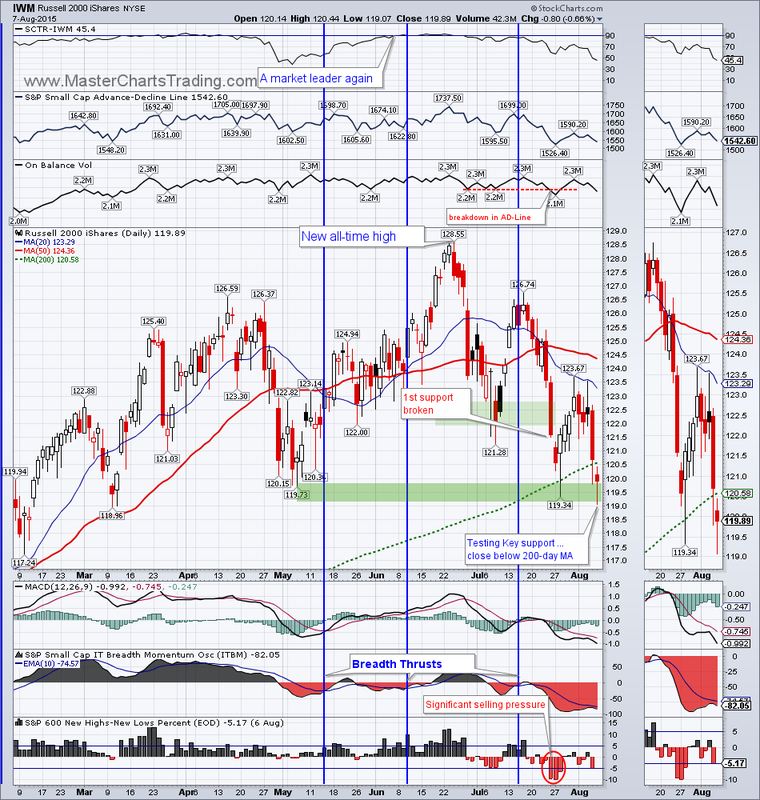
This latest bout of selling seems to be more confined to the small cap sectors of the market. IWM lost over 7% from its June all-time high. There was also a breakdown for the AD-Line. The New-Highs New Lows indicator for IWM is showing quite a few new lows being registered over the past month or so. Also, IWM closed below the 200-day moving average today. I think small caps held support from the May lows for now. IWM is certainly oversold and may present itself to be a decent re-entry opportunity in the near term once the uptrend resumes.
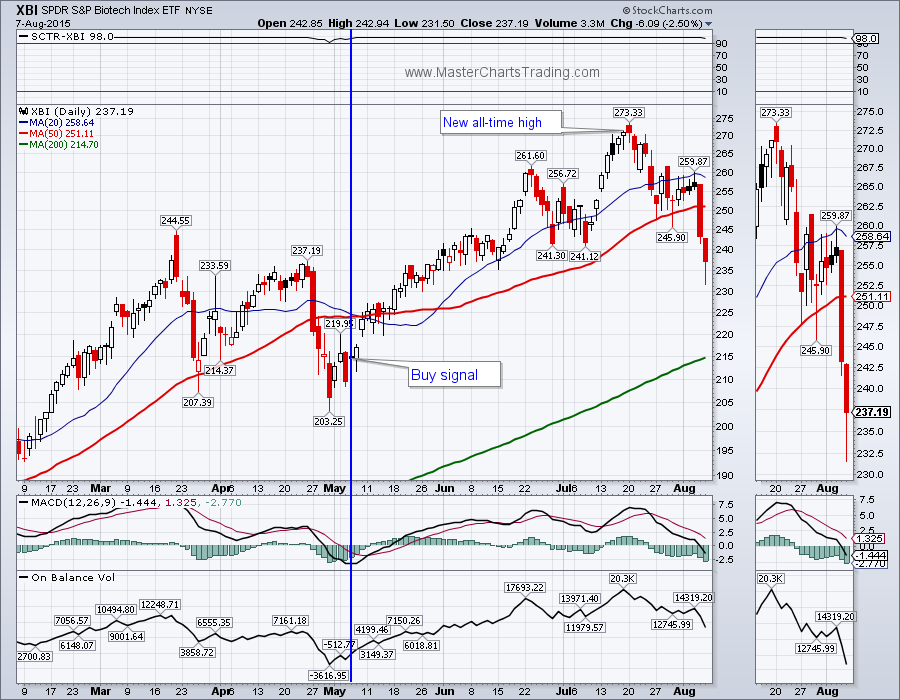
Speaking of oversold sectors, the diversified (basically equal weight) biotech ETF – XBI lost over 15% from its all-time high in mid-July. Bigger trend is clearly up, so what we have right now is an oversold security within a bigger uptrend – a recipe for a bounce higher. We are waiting for our trigger to re-open a position in XBI.
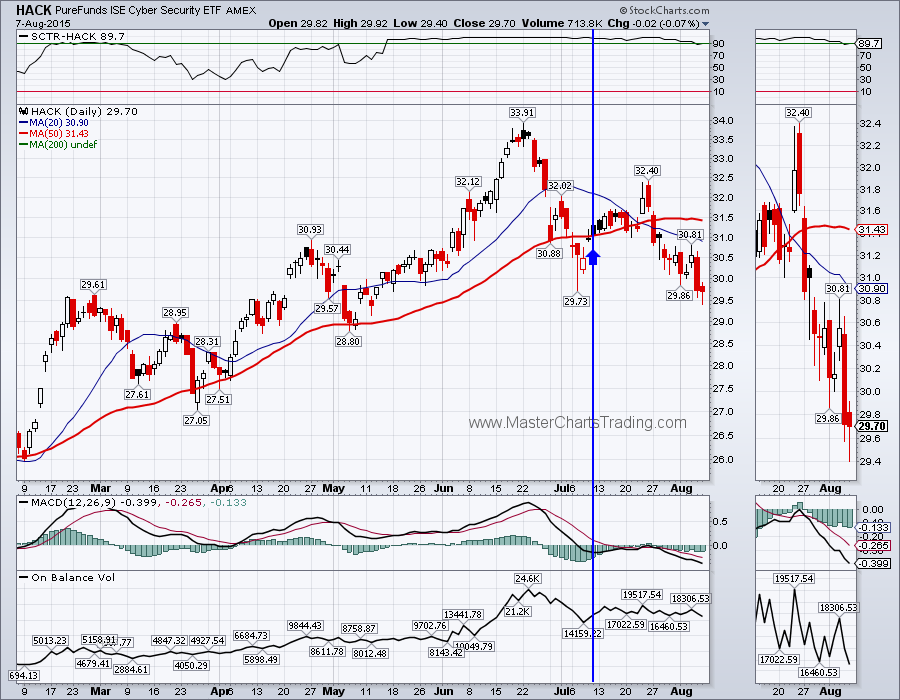
Similar story on another high volatility ETF named HACK. This ETF holds a basket of various cyber-security stocks. It too lost over 13% from its peak in late June. HACK is at support from July 7 lows – a logical place to regain its footing and push higher.
Similar story on another high volatility ETF named HACK. This ETF holds a basket of various cyber-security stocks. It too lost over 13% from its peak in late June. HACK is at support from July 7 lows – a logical place to regain its footing and push higher.
Bonds (TLT) held up very well for the week. Friday’s action in TLT shows a considerable buying interest, even in the face of a positive jobs report. Does it mean bonds are sensing some trouble ahead that did not yet show up in the stock market?
Utilities and REITs are sectors that traditionally benefit from the low interest rates. Since bonds are gaining, interest rates are dropping again. XLU gained almost 1% for the week and managed to close above the 200-day moving average – something it hasn’t been able to do since late May. Same as bonds, utilities are the defensive assets that investors rotate into during the time of stress and stock market uncertainty.
Utilities and REITs are sectors that traditionally benefit from the low interest rates. Since bonds are gaining, interest rates are dropping again. XLU gained almost 1% for the week and managed to close above the 200-day moving average – something it hasn’t been able to do since late May. Same as bonds, utilities are the defensive assets that investors rotate into during the time of stress and stock market uncertainty.
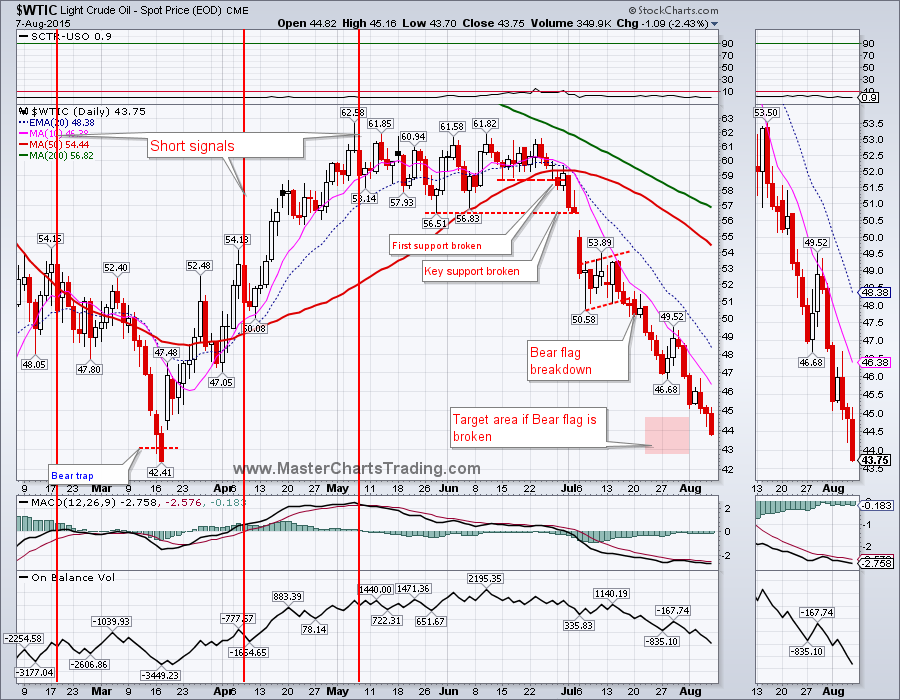
In the early July I pointed out a “Bear Flag” pattern on the chart of oil ($WTIC). Then I mentioned that, should this pattern break down, we could see prices in the low $40s. On Friday $WTIC closed at $43.74. $WTIC is quite oversold and now finally reaching its March lows, so I would not be surprised if a short-covering rally takes place.
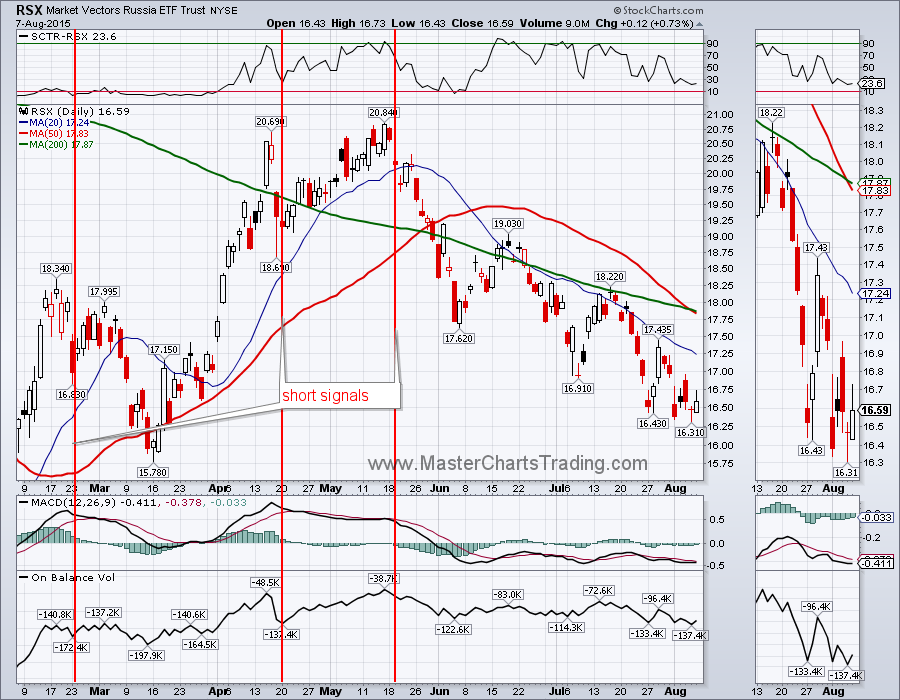
Oil related equities are also down together with oil, as are countries that rely on oil revenue as their major source of income. Russia comes to mind as one of them. RSX – the Russia ETF, just keeps sliding down since our short signal in May. In fact just now the 50-day moving average has crossed below the 200-day moving average on the chart of RSX. This is called a “death cross” and many investors will consider RSX to be in a bear market now. (To me RSX has been in a bear market all along, even though the 50-day MA was above the 200-day MA from June till now.)
That’s it for this week’s market recap,
Best Regards and have another great trading week!
** Special Announcement**
We are close to launching a stocks alert service. Please sign-up for our mailing list to be the first to take advantage of the discounted membership once it becomes available!
Best Regards and have another great trading week!
** Special Announcement**
We are close to launching a stocks alert service. Please sign-up for our mailing list to be the first to take advantage of the discounted membership once it becomes available!


 RSS Feed