|
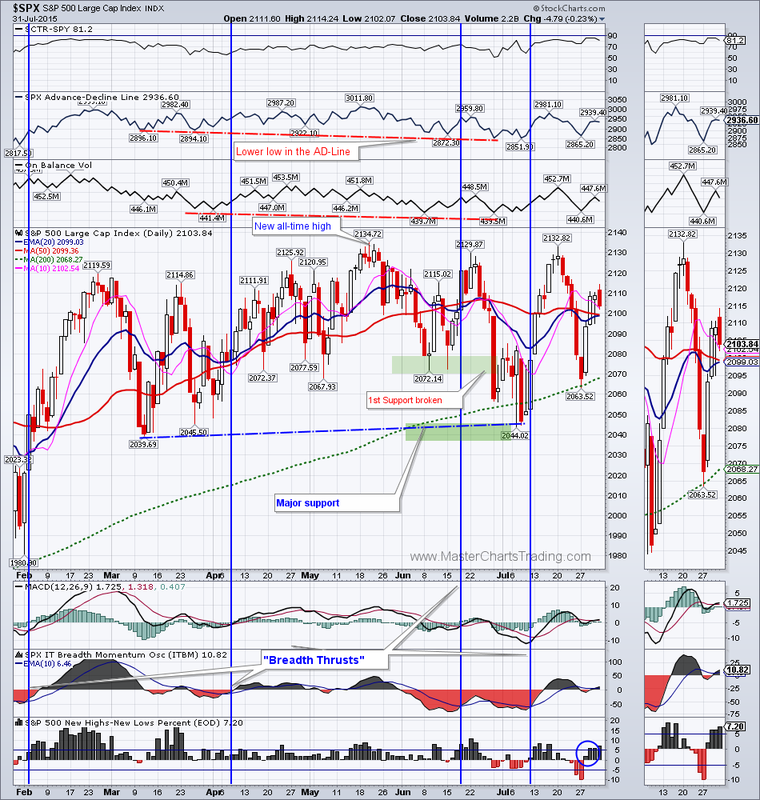
More choppiness this week in the markets as the S&P 500 rebounded off the 200-day moving average. $SPX gained a little over 1% for the week. Market breadth picture improved somewhat as the New highs – New lows percent indicator flipped back into positive territory. I think the longer-term picture for the stocks is still bullish, and we may see new highs soon, provided breadth improves further. Chart of $SPX |
|
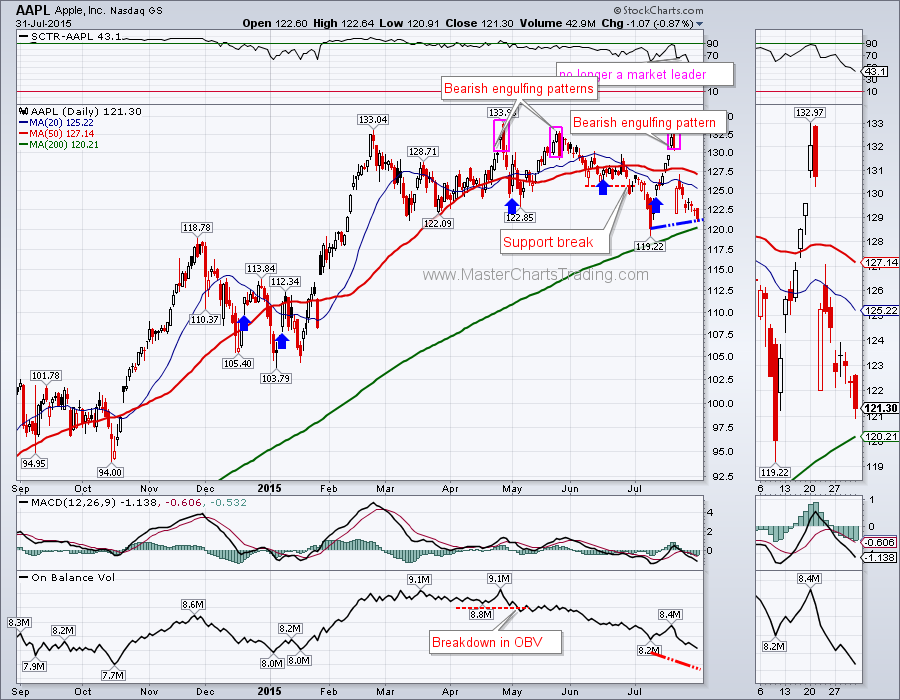
The NASDAQ 100 ETF (QQQ) also was testing support this week, but of its prior breakout. Unlike $SPX, QQQ did break out to the upside out of its trading range. QQQ is heavily market cap weighted, so weakness in Apple is weighing on the overall index. In fact AAPL could still see some downside before any meaningful rebound takes shape. The On Balance volume is diverging with the price itself, and I think AAPL could retest its breakout from last December at around $118.
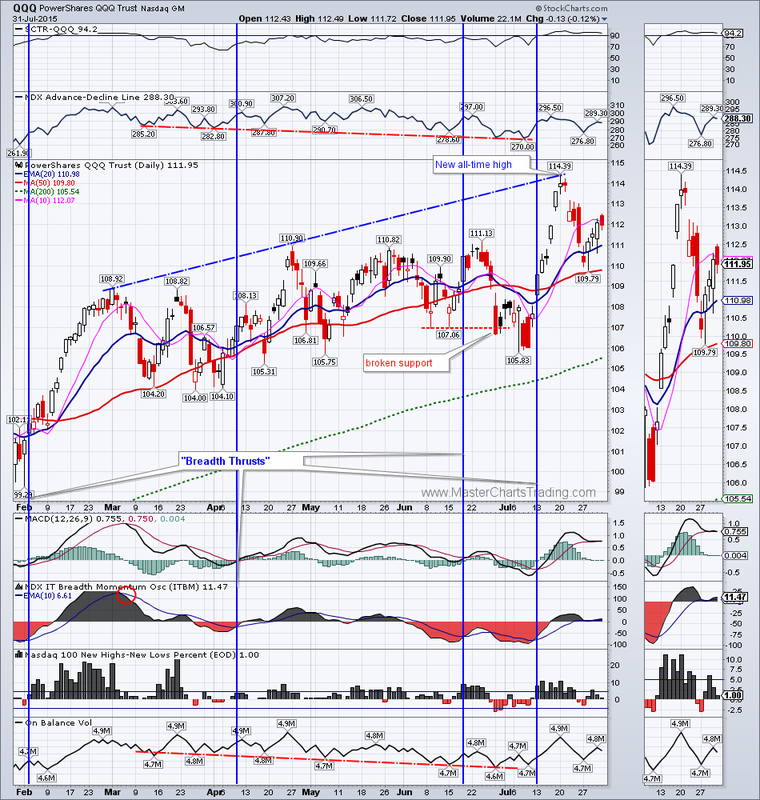
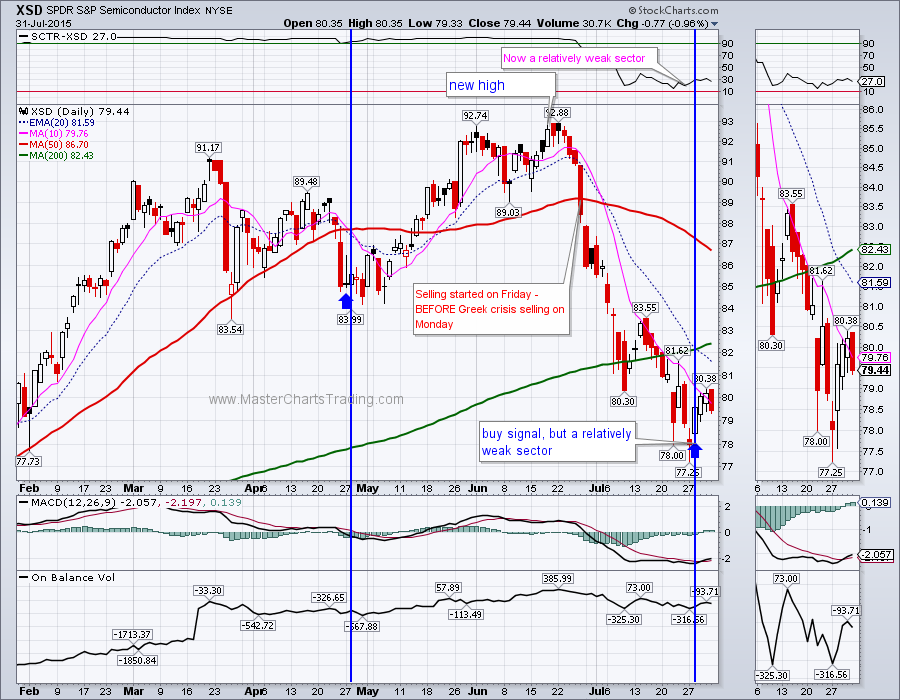
Similar breadth concerns remain for QQQ – we need to see broader participation in this rally. The semiconductors ETF (XSD) got hit very hard in the latest correction that started in mid-June loosing over 15%. The semiconductors represent about 7% of stocks in QQQ and they also have some catching-up to do if QQQ’s breadth is to improve.
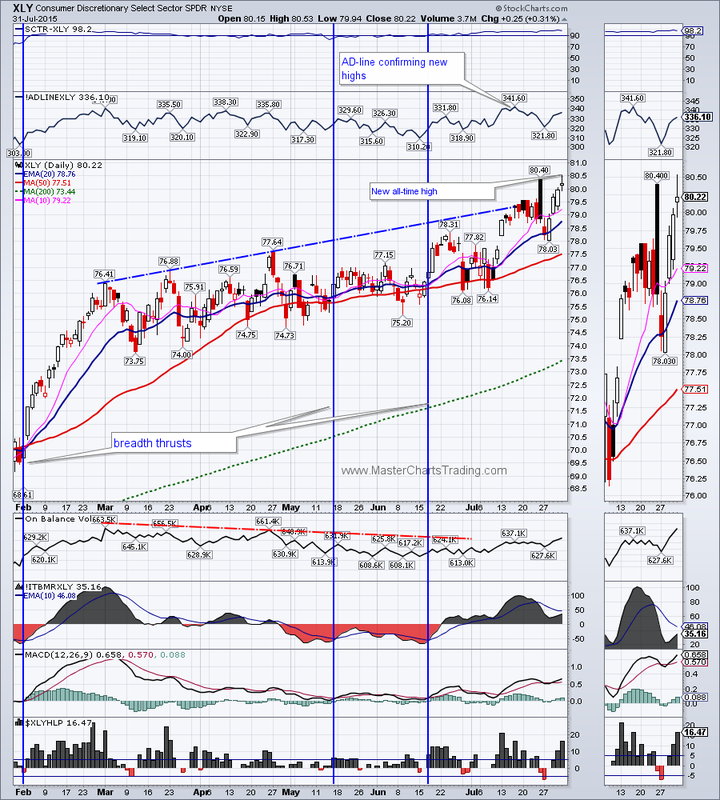
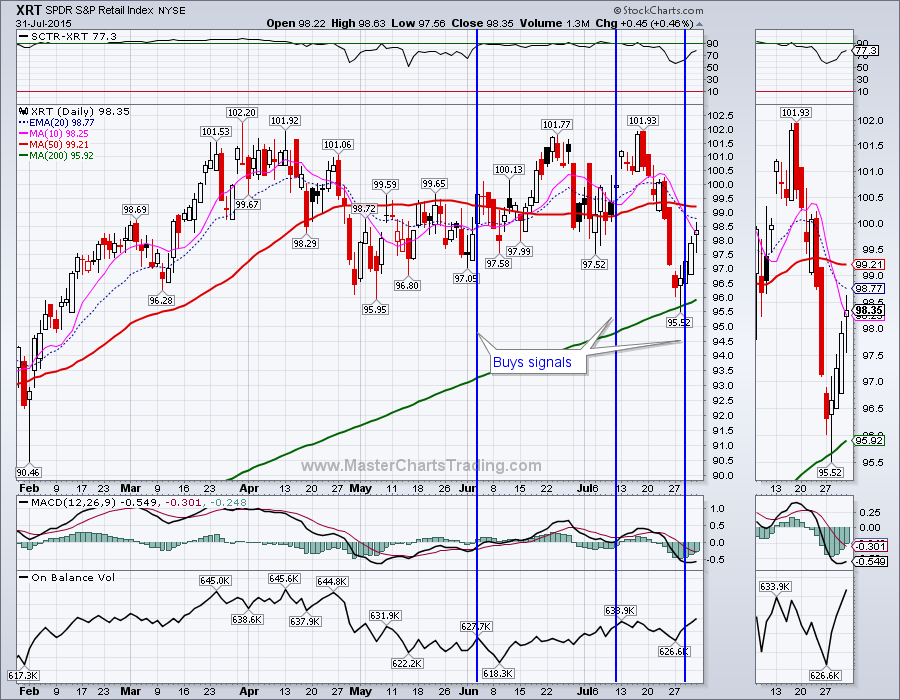
ConsumerDiscretionary Sector (XLY) hit a new high this week. XLY is the most economically sensitive sector, so strength in XLY is a welcome sign for the overall market since it shows that consumer demand is alive and well. Retail ETF (XRT) is part of the Consumer Discretionary sector and it went on our buy signal this week after testing the 200-day moving average.
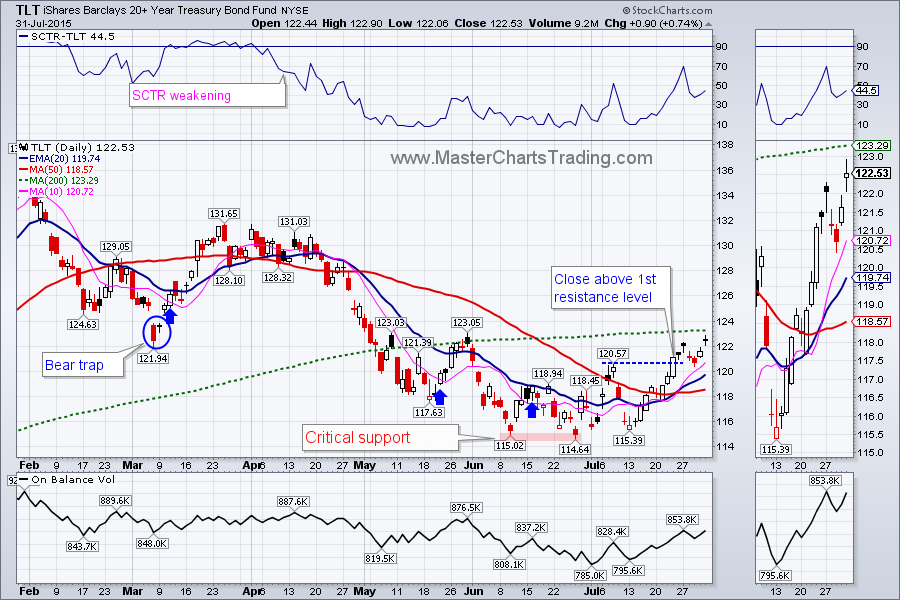
Bonds (TLT) broke out above 1st resistance last week and consolidated its gains this week. A very important test for TLT is likely coming very soon as TLT challenges the overhead resistance provided by the 200-day moving average. Last time TLT failed this test in May and moved to new lows. Will this time be different?
TLT chart
TLT chart
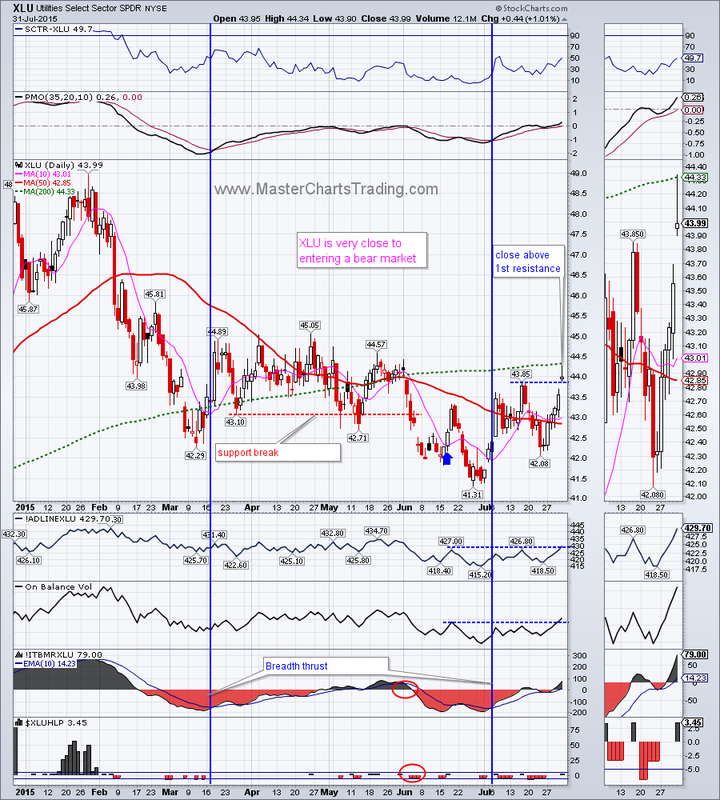
Interest rate-sensitive industry groups are benefiting from the strength in bonds. Utilities (XLU) were the biggest gainers last week and they also managed to close above resistance on Friday. So far the price was rejected at the 200-day average. Market breadth for XLU is looking promising as the Advance-Decline line and the On Balance volume broke out above its previous peaks.
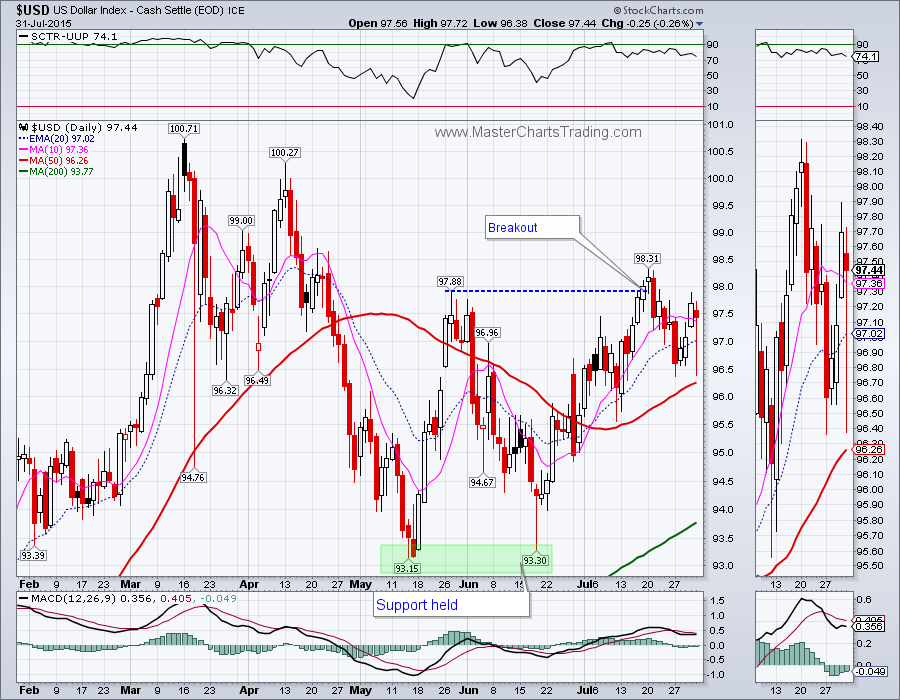
The dollar index ($USD) broke out above a previous peak 2 weeks ago and spent the last few days consolidating its gains. There were two throwbacks and they both seemed to have held. As I mentioned in the past, continuing strength in the US dollar is weighing on commodities and their producers.
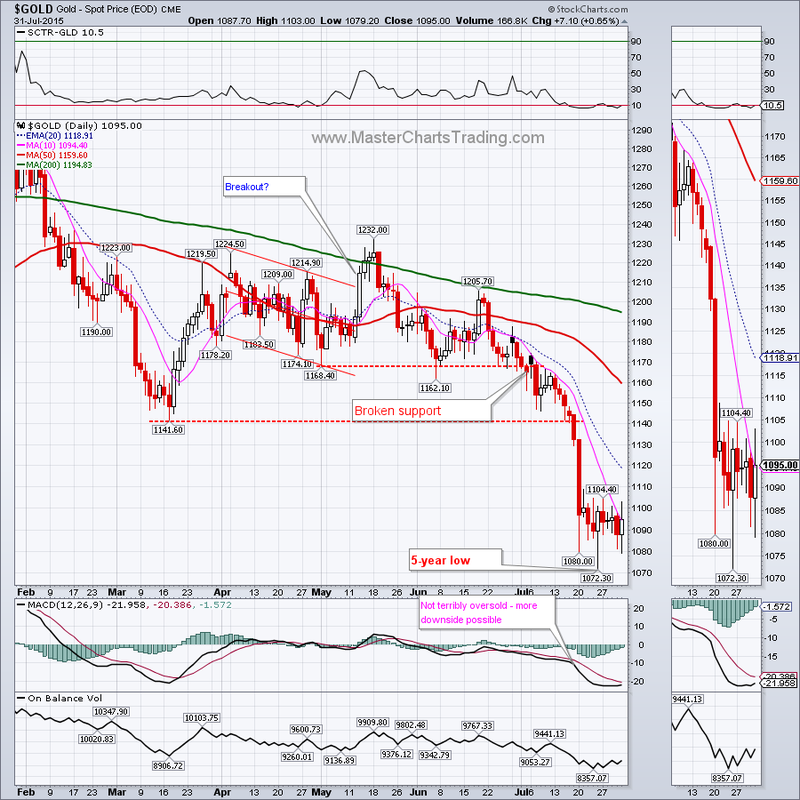
Has gold bottomed? No one knows that for sure. One thing I can tell you for sure is that gold is in a bear market. Bear markets are characterized by lower peaks and lower lows. This is also known as a downtrend. Currently gold is oversold after 6 weeks of non-stop steep price drops. If you are trying to time the bottom it is very difficult to do so. Gold could easily see another leg down before the rebound takes place. Having said that, in the short-term I think gold could rebound to its broken support in the $1140 area, possibly even higher. At that point it would again present itself as a decent shorting opportunity.
Charts of gold and other precious metals
Charts of gold and other precious metals
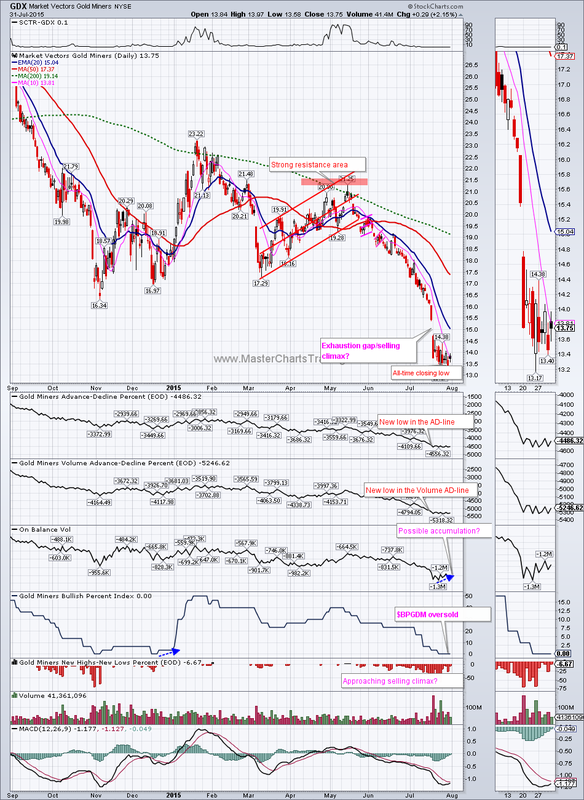
Gold miners (GDX) had an all-time closing low on Thursday, but rebounded on Friday. GDX is strongly bearish. It is also very oversold - even considering that I normally ignore oversold conditions in a bearish security. At the very least, the downside momentum has slowed down. As I mentioned last week the Bullish percent index ($BPGDM) is currently at zero. In other words not a single stock within GDX is currently on a Point & Figure chart buy signal. In the past GDX rallied after hitting similar readings. There are also possibly some accumulation patterns showing up in the On Balance volume indicator. We might see a rebound to the $16.50 area. As with gold, should this rebound take place, GDX again would be vulnerable to short sellers.
Chart of GDX
Chart of GDX
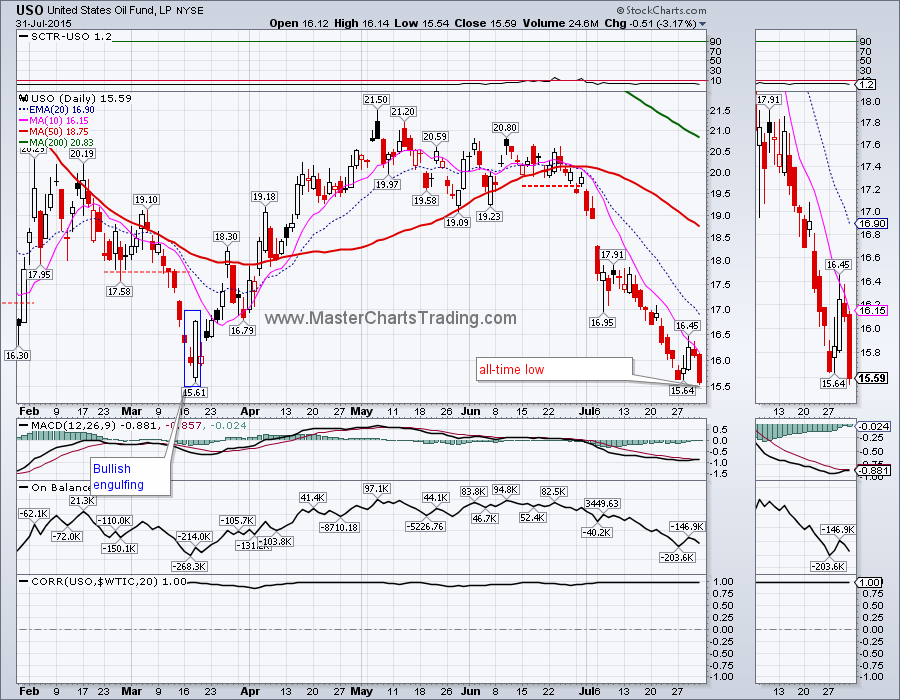
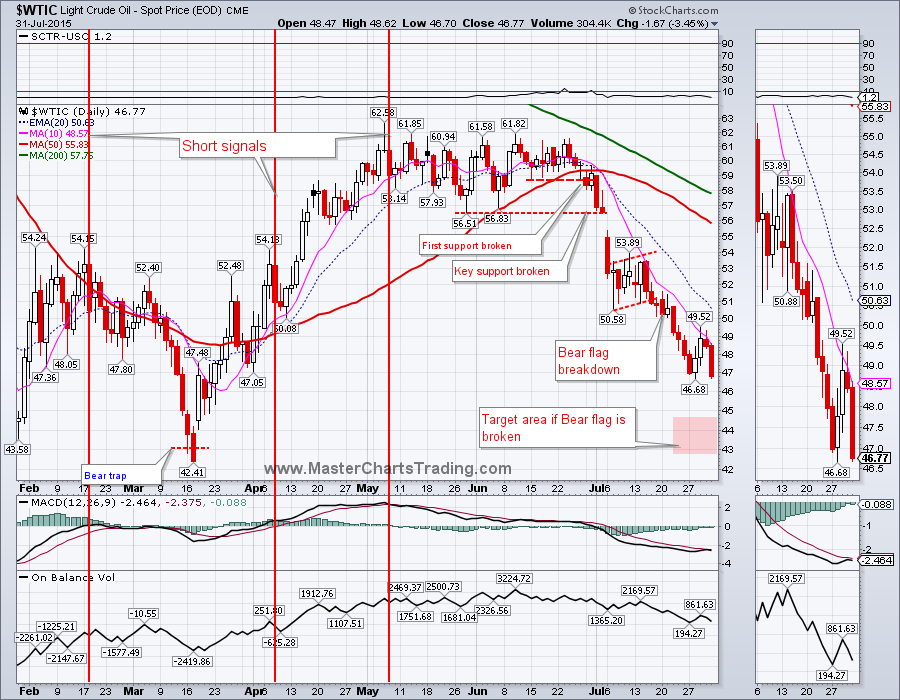
USO (the oil tracking ETF) hit a new all-time low today. USO correlates well to the oil price ($WTIC) on the daily charts, but since it is not the commodity itself, there is some slippage and discrepancy between charts of USO and $WTIC. I mentioned 2 weeks ago that a Bear Flag pattern was taking shape on the chart of $WTIC and a breakdown from this pattern could take oil all the way down to the low $40s. $WTIC is certainly on its way there as it closed at $46.77 on Friday.
That’s it for this week’s market recap,
Best Regards and have another great trading week!
** Special Announcement**
We are close to launching a stocks alert service. Please sign-up for our mailing list to be the first to take advantage of the discounted membership once it becomes available!
Alexander Berger (www.MasterChartsTrading.com)
Best Regards and have another great trading week!
** Special Announcement**
We are close to launching a stocks alert service. Please sign-up for our mailing list to be the first to take advantage of the discounted membership once it becomes available!
Alexander Berger (www.MasterChartsTrading.com)


 RSS Feed