|
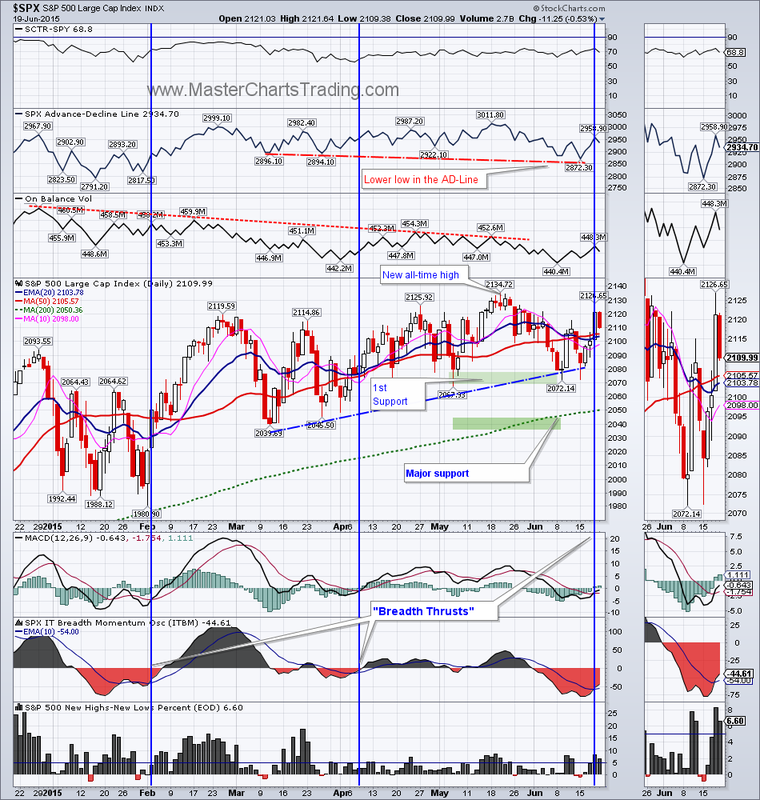
The S&P 500 retested support in the 2072 area on Monday and held it. Stocks then continued up strongly for the rest of the week, taking a breather on Friday. For the week, all major stock indices are up.
All major indices are showing improved breadth momentum and participation. There are divergences present in the $SPX. Namely in the AD-Line and the On Balance Volume indicator. Whether these divergences would lead to a deeper pullback, or simply disappear, remains to be seen. For now, stocks continue to show bullish resolve and are very close to new all-time highs. Charts of major indices |
|
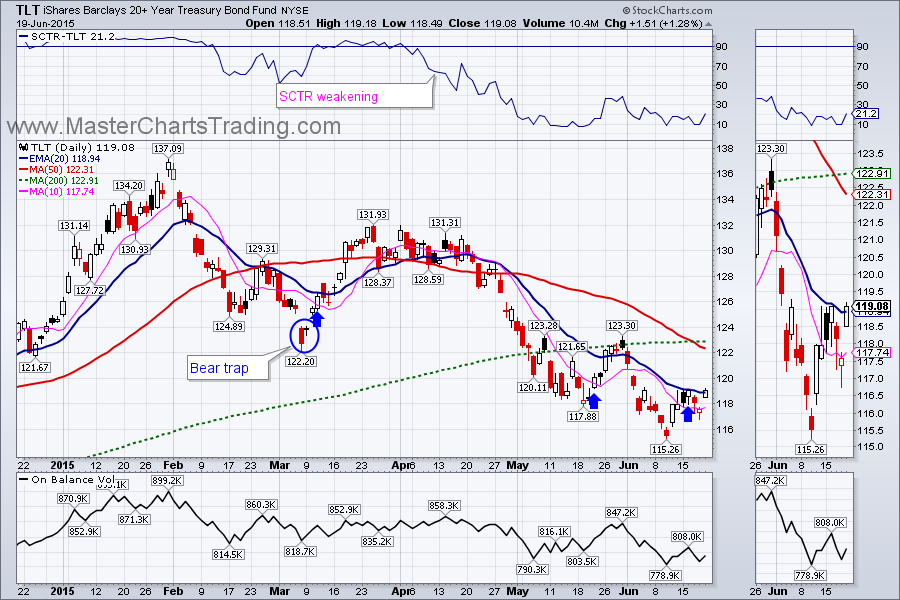
Interestingly, bonds (TLT) also gained for the week. We are entering the summer months, which traditionally have a bullish bias for bonds and bearish bias for stocks. July and August are especially bullish for bonds. Could the investors be jockeying into an advantageous position for this time period? Our system did generate a buy signal for bonds and we opened a small position. TLT chart
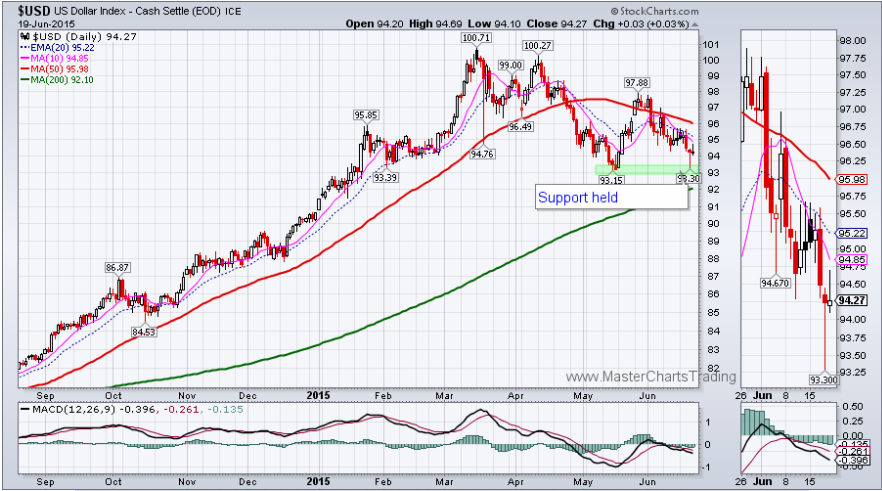
The dollar may have held support from mid-May and is ready for a rebound. Should the dollar push higher; it would weigh on commodities of all sorts. Oil and gold in particular are vulnerable to astrong dollar.
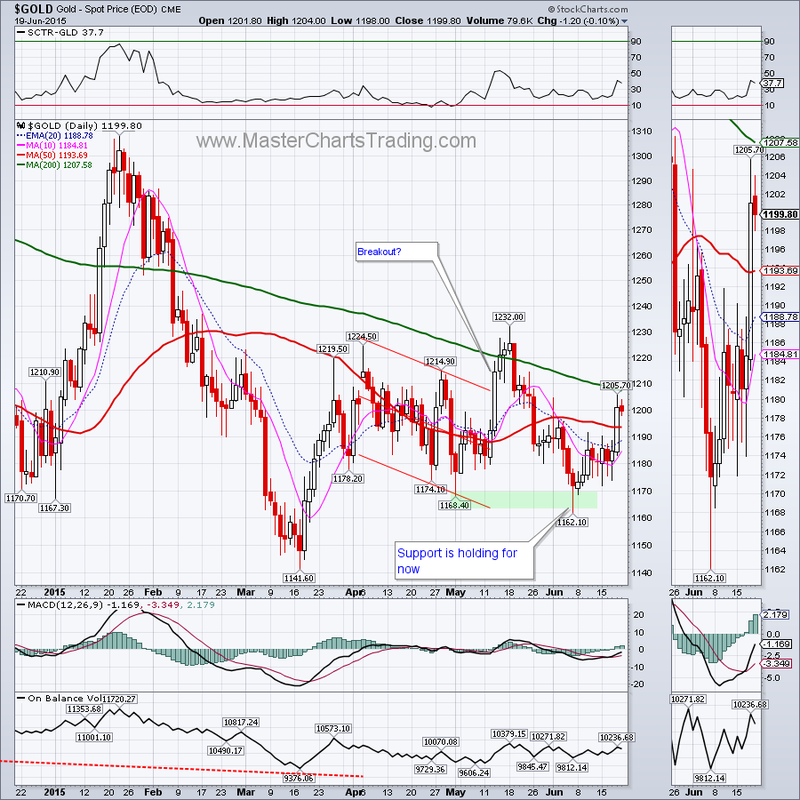
As I mentioned last week, gold held support in the $1162 area and rebounded. The rebound continued into this week and gold is up over 3.5% for this latest move. Should the dollar rally now, gold is very likely to continue its slide and retest at least the March lows.
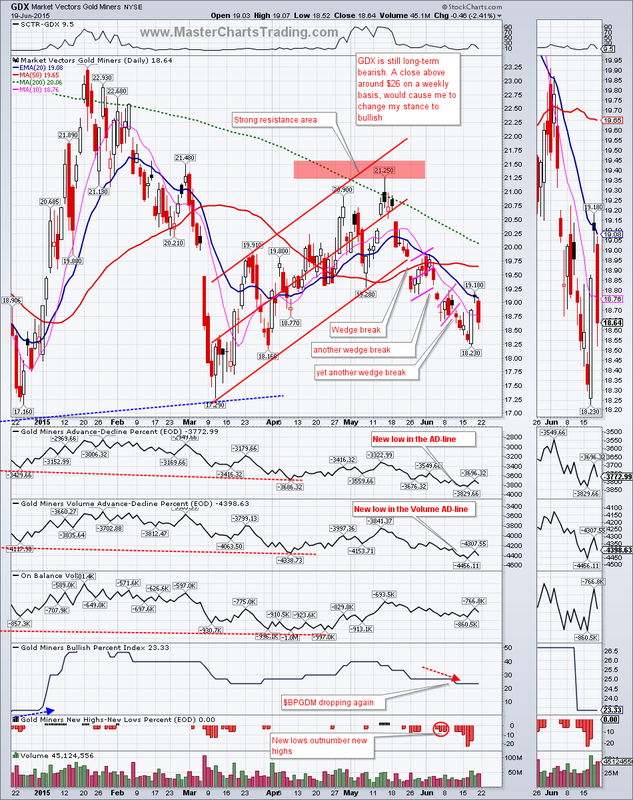
Gold miners bounced along with gold, but Friday’s close leaves much to be desired for the gold bulls. Whereas gold dropped a fraction of a percent on Friday, GDX plunged 2.4%. GDX was not even able to close above its 20-day exponential moving average. With new lows registered just a few days ago in the AD-Lines for GDX, my money is (literally) on more downside for gold miners.
Gold and gold miners charts
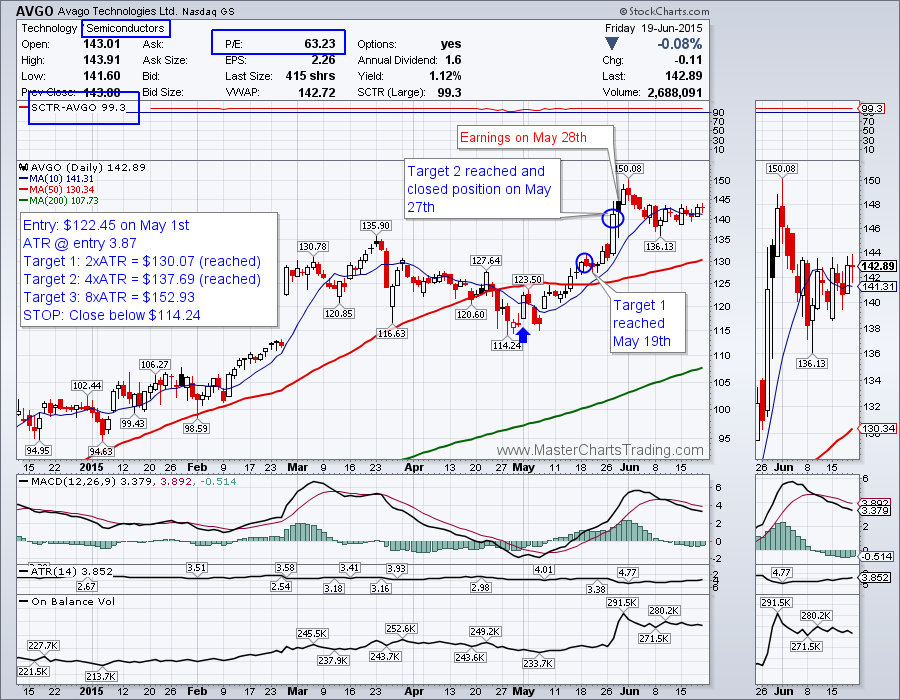
Now I wanted to highlight a recent trade that I did and thus illustrate my way of stock picking, risk controls, and market timing. This is a type of trade information that will be available to subscribers in real time once our trading service starts up (hopefully soon).
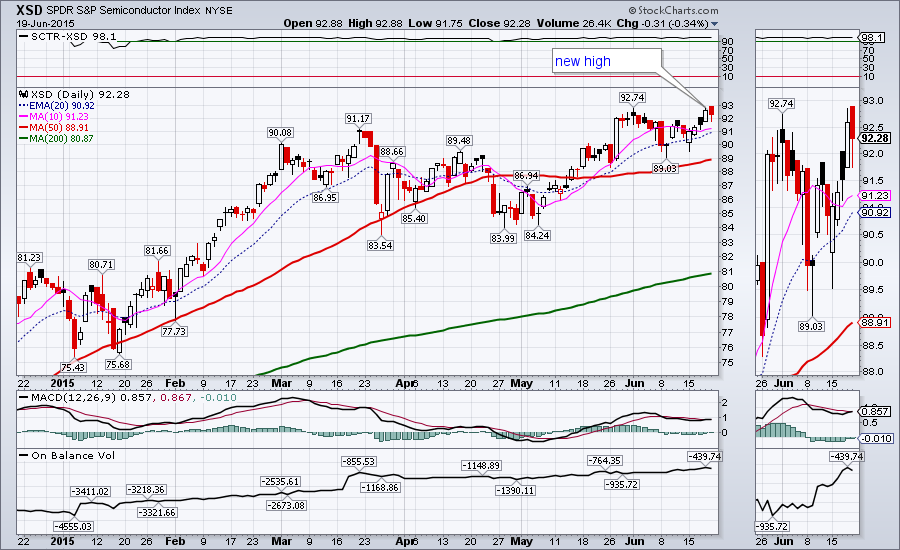
Avago Technologies is a semiconductor stock that has been on a tear for the past few years. Semiconductors (XSD) are also among the market leaders currently, so the industry group is helping with a bullish momentum for AVGO.
Avago Technologies is a semiconductor stock that has been on a tear for the past few years. Semiconductors (XSD) are also among the market leaders currently, so the industry group is helping with a bullish momentum for AVGO.
AVGO is clearly in a strong uptrend. Then in March of this year AVGO hit a new high and started a pullback. This pullback lasted quite a while and was relatively deep. Now the stock has become oversold within a bigger uptrend, but its momentum wasn’t damaged much. Then on May 1st, AVGO rebounded and triggered our buy signal.
We entered the trade in AVGO on May 1st with a stop below the recent low and 3 target prices set based on the ATR. ATR (average true range) is a measure of how much a stock fluctuates in a time period.
Our 1st target was reached on May 19th. We took profits and moved our stop to break-even. Then several days later our 2nd target was reached on May 27th. However we closed our entire position on that day because of the earnings report that was due on May 28th. Our average gain for this trade was over 11% in just 17 days!
If you look on the chart of AVGO, you will notice that the price continued higher after the earnings, but what if there was an earnings miss? The price could have just as easily gapped down and we would have been left with a much lower profit for the trade or possibly a loss. In other words: why gamble on an earnings report and risk loosing your profits?
Link to AVGO chart
That’s it for this week’s market recap,
Best Regards and have another great trading week!
** Special Announcement**
We are close to launching a stocks alert service. Please sign-up for our mailing list to be the first to take advantage of the discounted membership once it becomes available!
Alexander Berger (www.MasterChartsTrading.com)
Best Regards and have another great trading week!
** Special Announcement**
We are close to launching a stocks alert service. Please sign-up for our mailing list to be the first to take advantage of the discounted membership once it becomes available!
Alexander Berger (www.MasterChartsTrading.com)


 RSS Feed