|
www.MasterChartsTrading.com Friday, June 26th, 2015 Weekly Market Recap.
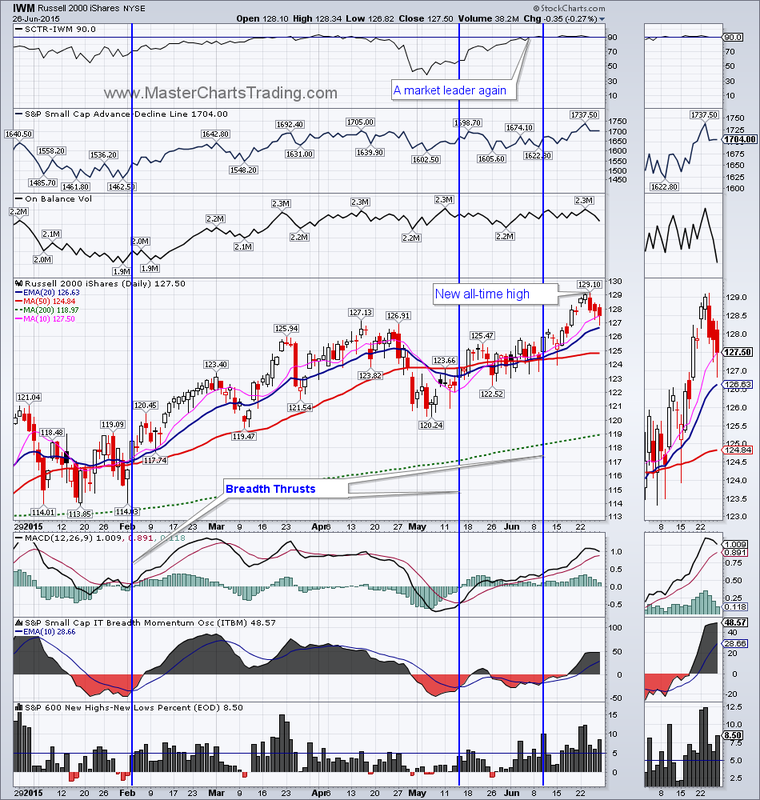
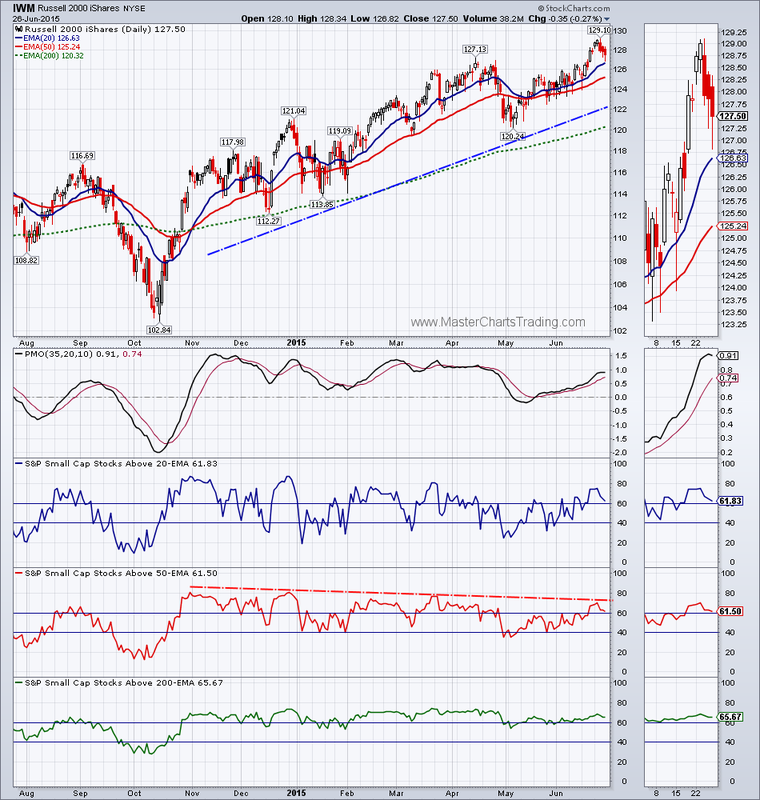
We are continuing to see both relative and absolute strength in the small-cap universe. This week IWM hit both an all-time high and an all-time closing highs – this is a bullish development. Market breadth for IWM has some minor divergences, but overall, the underlying breadth is confirming the new highs. IWM breadth chart 1 IWM breadth chart 2 |
|
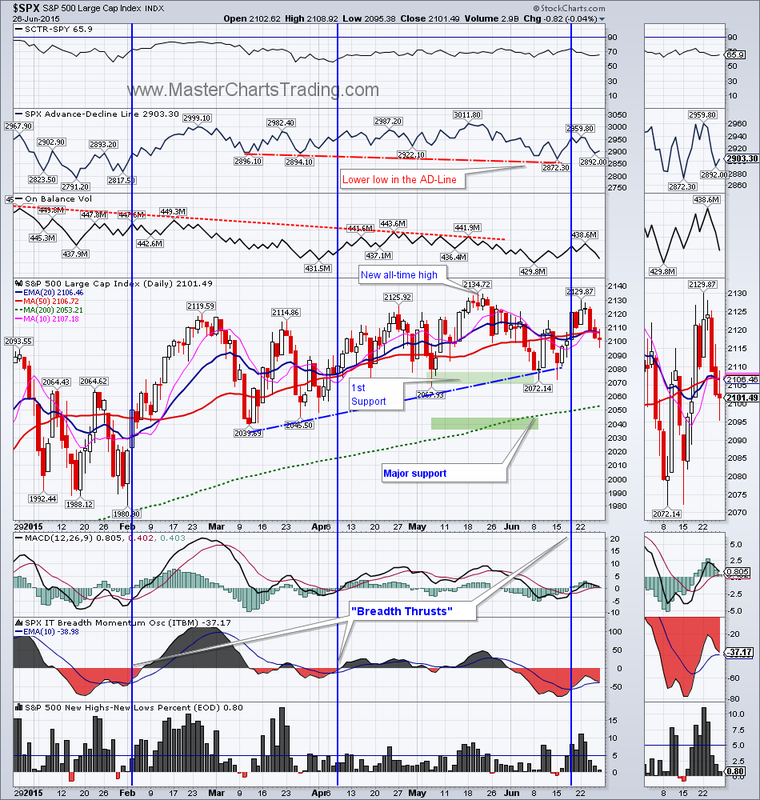
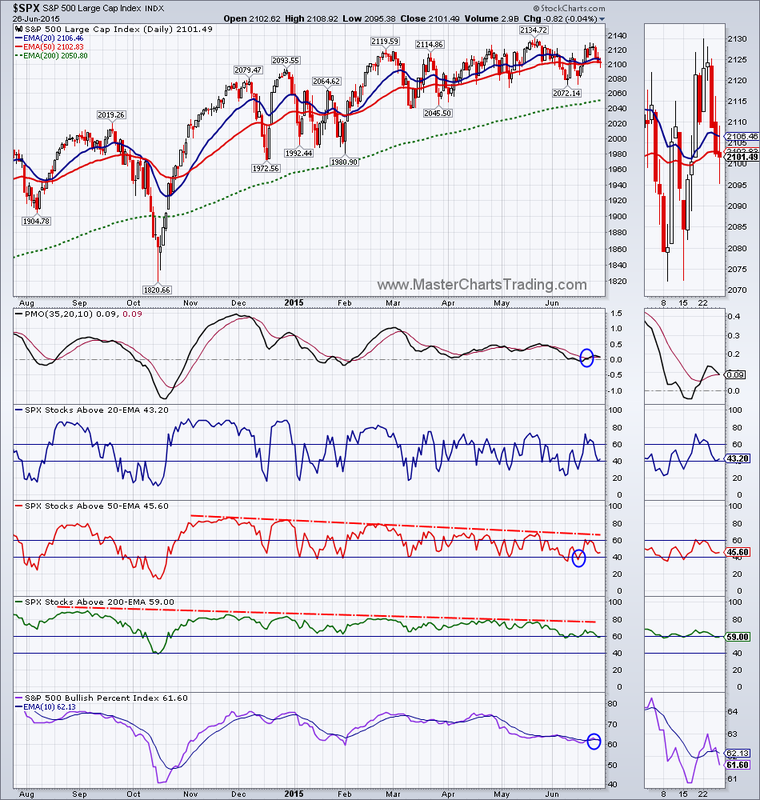
Within the large cap area, $SPX came close, but did not hit any highs this week. Moreover, the market breadth divergences are present on the chart of $SPX. The look of the Advance-Decline line improved somewhat, but I still would like to see a higher low in the AD Line to ease my worries. The same goes for the On-Balance volume (OBV) indicator. It feels like $SPX is marching higher, but on lesser volume. OBV needs to push above mid-April high for me to feel better.
Percentage of stocks above the 200-day and the 50-day exponential moving averages (EMA) for $SPX has also been steadily trending lower since December. This indicates that the participation in this rally from the October low is steadily dropping.
$SPX Market breadth chart 1
$SPX Market breadth chart 2
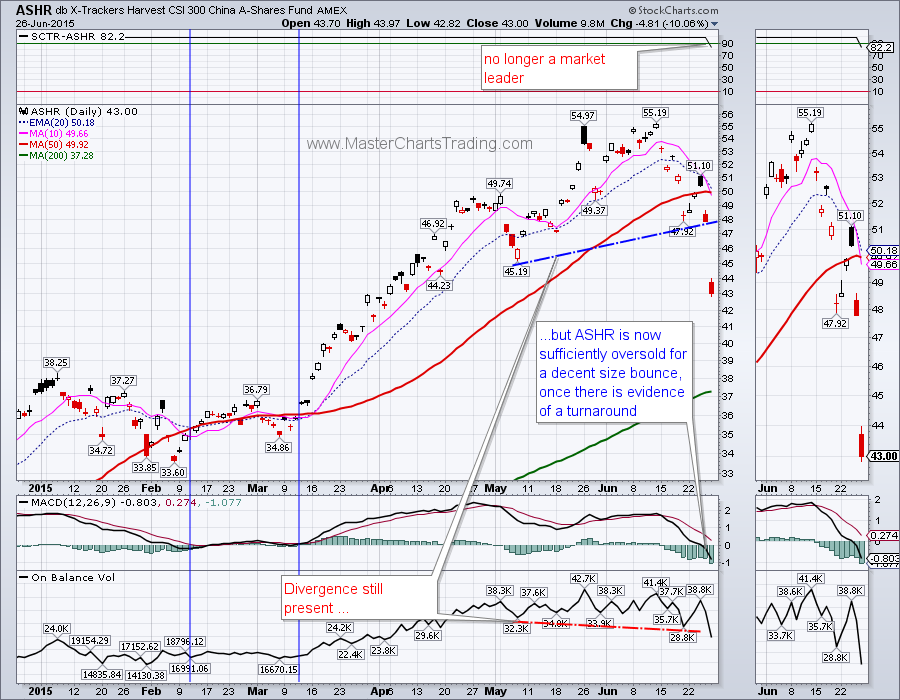
Chinese shares were all the news past few weeks. ASHR – the ETF that tracks 300 most active shares from the Mainland China exchanges, dropped over 22% in just 11 trading sessions. Friday’s gap and drop lower was particularly nasty, with ASHR closing down over 10%! The question now of course is: do we re-enter the Chinese equities for a pop higher, or do we stay away? Let us examine the evidence at hand.
Positives for Chinese Shares:
1. ASHR has had an uninterrupted SCTR rank of over 90 since September of last year. This means ASHR outperformed most of the other ETF’s in the non-leveraged, non-inverse universe
2. From the time ASHR’s SCTR rank popped above 90 to its peak just a few days ago, it gained over 120%
3. ASHR is now oversold on momentum indicators, such as MACD, or stochastic.
Now the negatives
1. SCTR for ASHR is now below 90. This means that other sectors and areas of the stock market are outperforming the Chinese shares and speculative money may no longer flow into China as freely as before
2. The On-Balance Volume (OBV) showed a bearish divergence in mid-June and now OBV broke below that low. This is indicating large distribution volumes
The bottom line: ASHR is still long-term bullish, and considering how oversold it is right now, a pop higher is very likely. But since it is no longer a market leader with SCTR below 90, we have to be even more careful with our timing.
Chart of ASHR
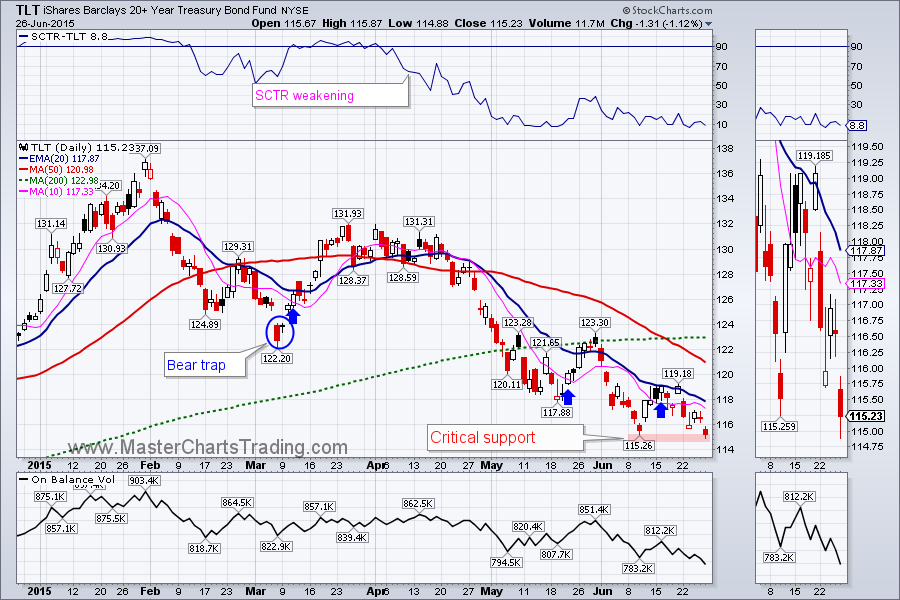
Bonds (TLT) ended the week at a critical support. Bonds have been under severe pressure since February. If TLT closes below this week’s low, I believe TLT would enter a bear market. This would mean that it would be more profitable to short the rallies in TLT then to time entries on the long side.
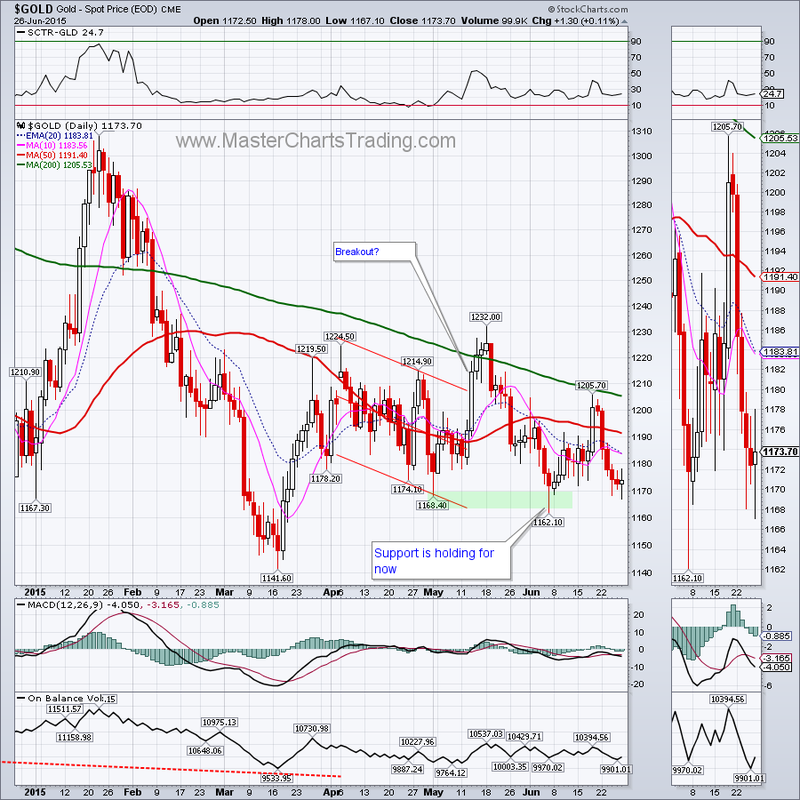
Last week’s pop in gold was completely negated by this week’s performance. Gold lost over 2%, to end the week at $1173. Gold is currently below all major moving averages, but the support in the $1162 area is holding for now.
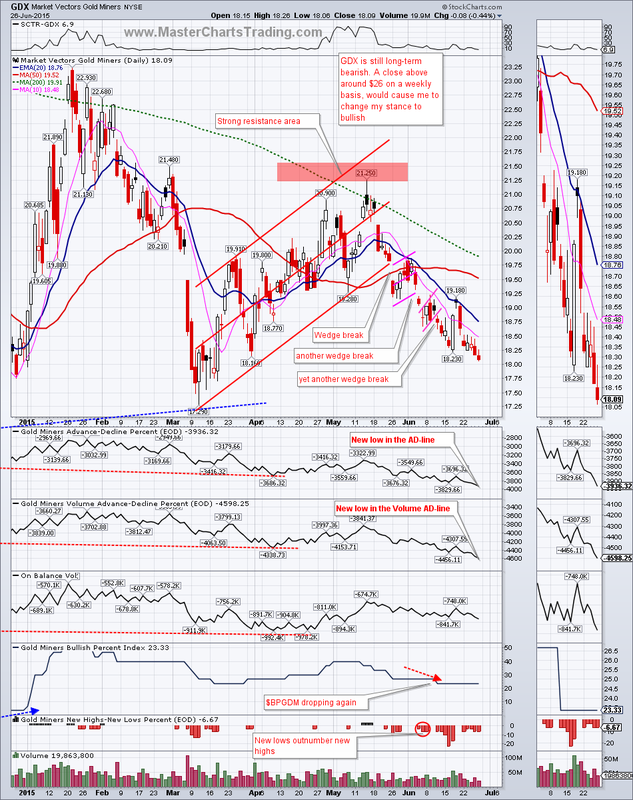
GDX fared even worse as it ended the week on a decidedly negative note with two bearish candles in a row on Thursday and Friday. Market breadth for GDX is hitting new lows already before the price of GDX itself. This is a bearish divergence and would likely weight further on GDX price. I am expecting at least a retest of March lows around $17.50.
Gold and gold miners charts here
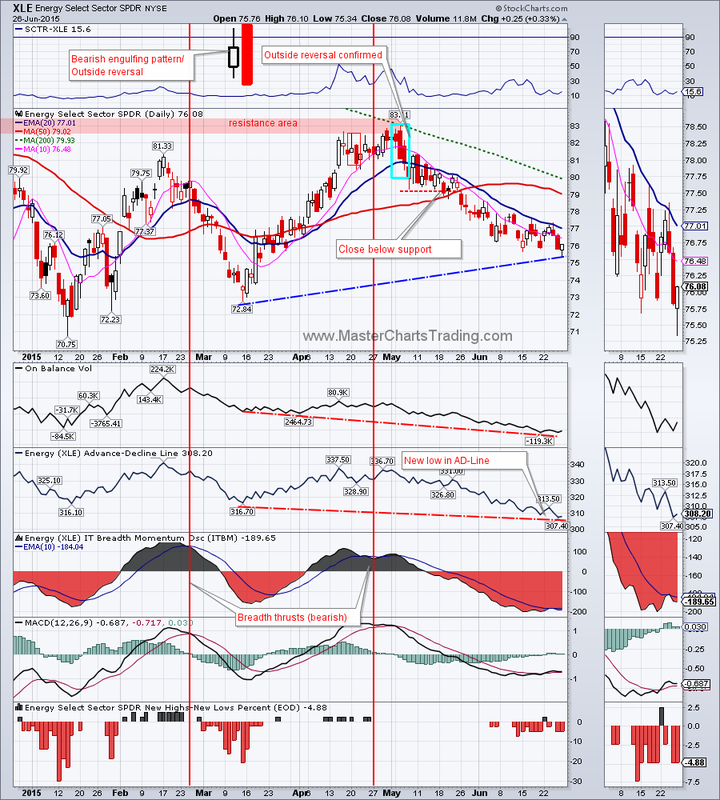
A very similar picture to GDX is unfolding in the Energy Sector ETF – XLE. From our short signal in late April till the low on Friday, XLE lost over 7%. Both the OBV and the AD-Lines for XLE hit a new low for the move, but XLE itself is still well above the low from March. This is again a negative divergence and I am expecting lower prices in XLE especially if oil finally rolls over to the downside.
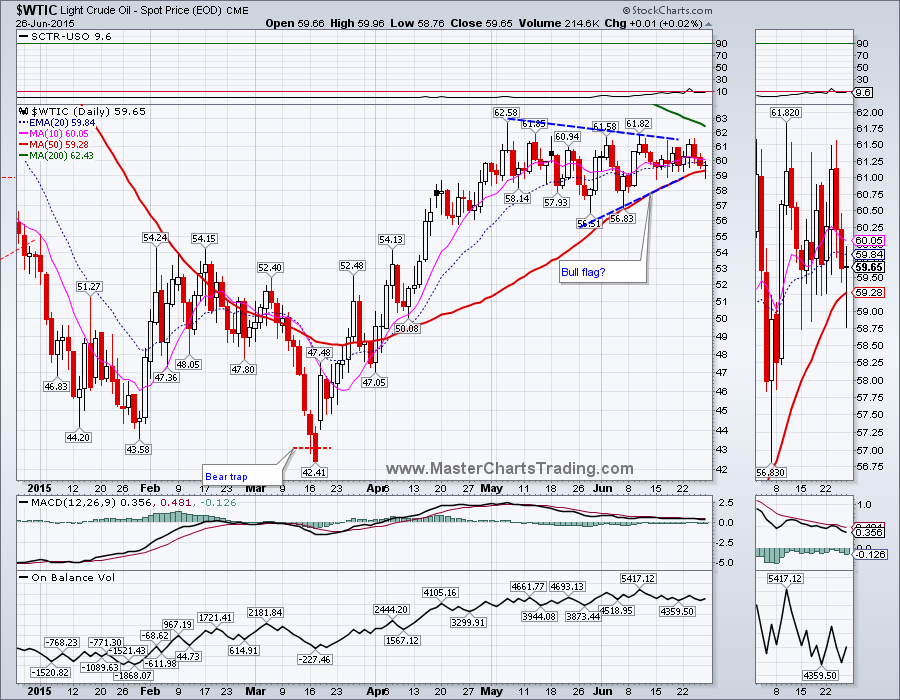
Oil may finally be rolling over to the downside (it is still long-term bearish). On Friday, the West Texas Intermediate (WTIC) tested and barely held the 50-day moving average. A close below the late May lows at $56 would call for at least a drop to the $54 area and possibly lower. If XLE is any indication, we might get this move soon.
Chart of XLE
Chart of West Texas Intermediate Crude Oil
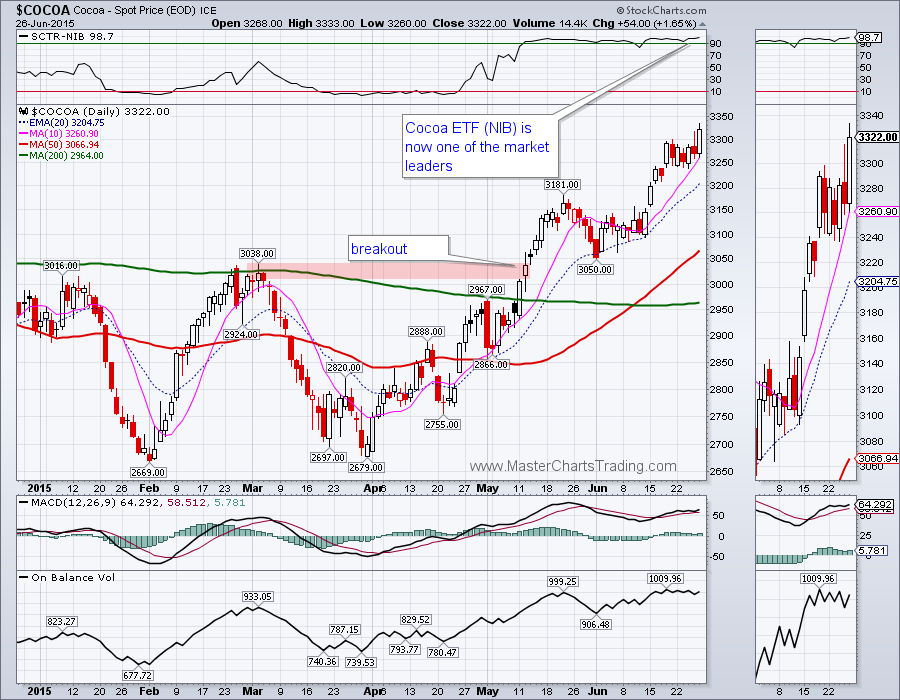
A chart of $COCOA peaked my interest. $COCOA made a classic breakout-throwback-breakout move over the past month or so. The cocoa-tracking ETF – NIB now became one of the market leaders with SCTR score of over 90. I am now watching NIB for a relatively safe re-entry opportunity, which may come if $COCOA retraces some of this move to around the 50-day moving average.
That’s it for this week’s market recap,
Best Regards and have another great trading week!
** Special Announcement**
We are close to launching a stocks alert service. Please sign-up for our mailing list to be the first to take advantage of the discounted membership once it becomes available!
Alexander Berger (www.MasterChartsTrading.com)
Best Regards and have another great trading week!
** Special Announcement**
We are close to launching a stocks alert service. Please sign-up for our mailing list to be the first to take advantage of the discounted membership once it becomes available!
Alexander Berger (www.MasterChartsTrading.com)


 RSS Feed