|
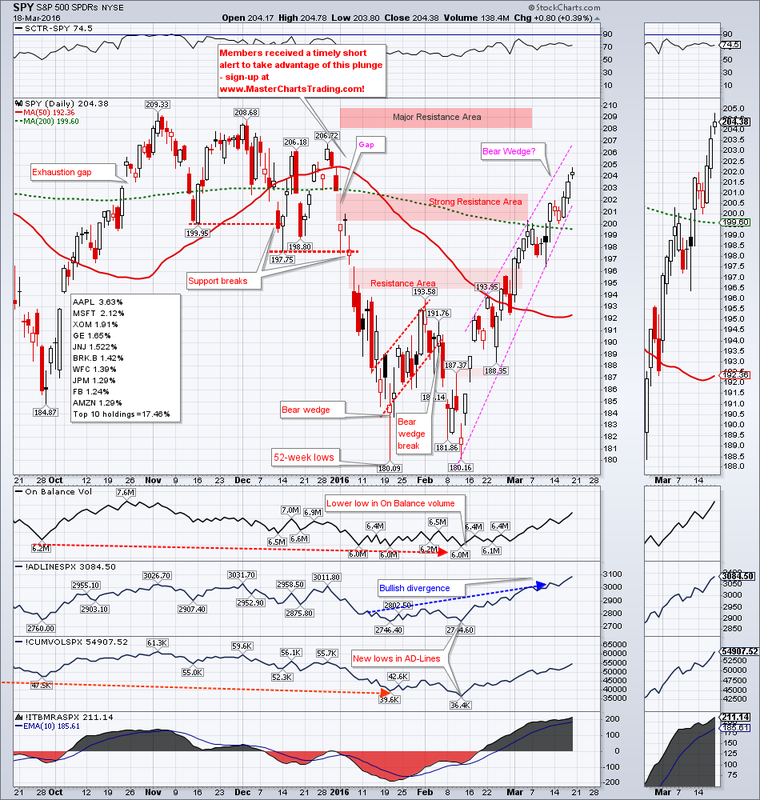
There is no denying it: a stock rally off the 52-week lows set in January of this year is impressive. SPY keeps pushing higher towards the all-time highs set in July of last year. Stocks were able to clear the strong resistance in the $201-$202 area and close above the gap-down from the beginning of this year. Bulls will argue that these are all positive developments.
CHART OF SPY |
|
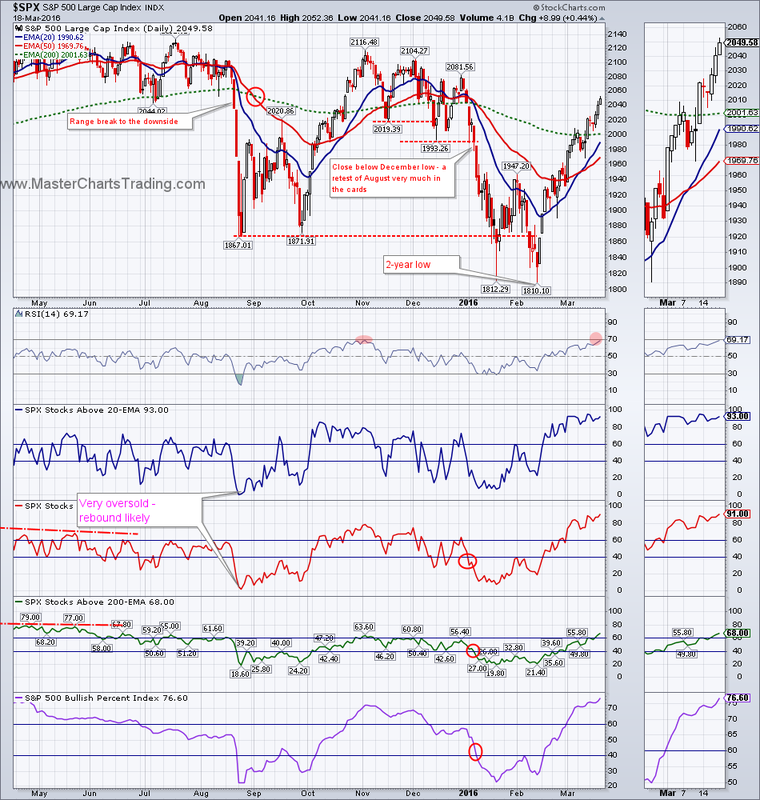
My argument has been consistently that stocks are currently in a bear market and this rally off the 2-year lows in $SPX is a counter-trend rally. You may argue that rallies of these proportions do not happen during the bear markets. Nothing could be further from the truth!
CHART OF $SPX
CHART OF $SPX
Take a look at the chart of $NYA from the beginning of the bear market back in 2001. Notice how $NYA made a low in March of 2001 and then rallied over 20% for 2 month! What happened afterwards? $NYA turned around and collapsed over 25% from May 2001 into September of 2001. This was all within a context of a bigger downtrend in stocks that incidentally was just getting started.
Currently we have a very similar picture as $NYA rallied almost 15% off the multi-year lows set in February. Can stocks continue higher? Absolutely! However within the context of the existing and ongoing bear market, stocks could easily roll over with a vengeance and break the January lows.
CHART OF $NYA
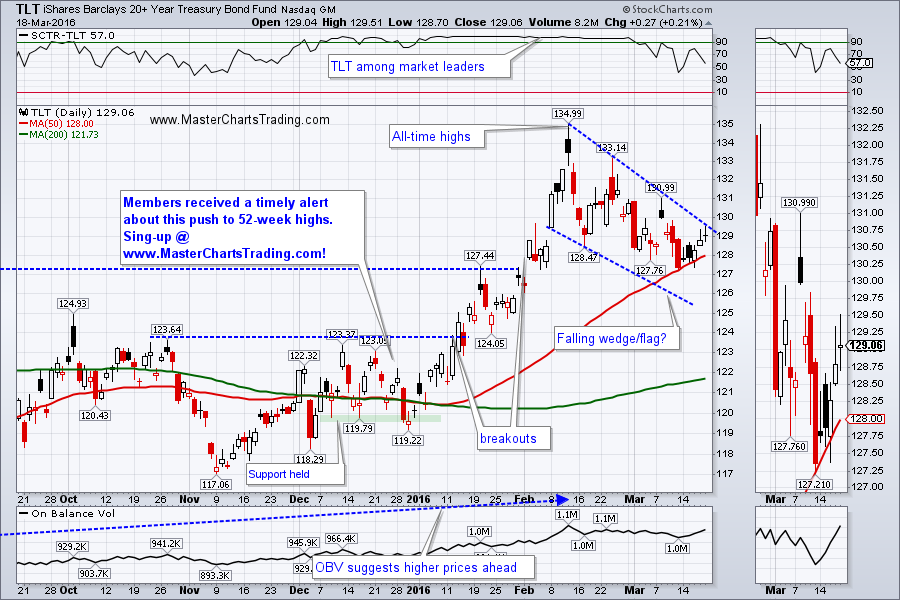
trength in bonds should also be of a concern to the stock bulls. TLT made an all-time high in February and corrected into March. We might get some more back and forth with TLT, but an uptrend could resume soon. This will certainly come to pass if the stocks come under selling pressure going forward.
CHART OF TLT
CHART OF TLT
I changed the long-term chart of TLT and there is a possibility of a cup and handle being traced out there. This is a massive cup with a 20% depth of the pattern. Should it play out TLT could run quite a bit higher, with a projected price of about $160. Of course TLT running this much higher would mean stocks have came down quite a bit from today’s levels.
LONG-TERM TLT CHART
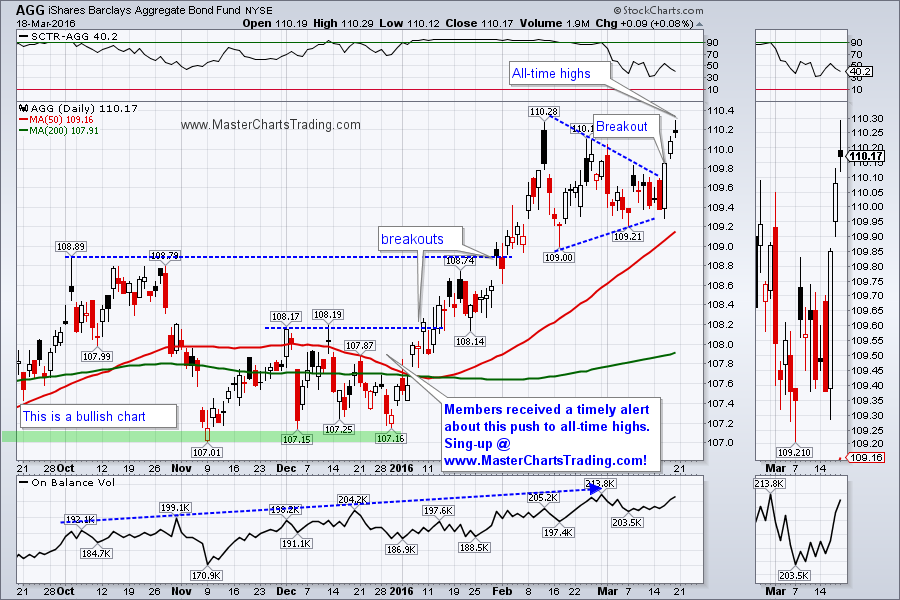
Diversified bonds fund, AGG, hit all-time highs this Friday, but pulled back. New highs are very bullish and we could expect more highs in the not so distant future.
CHART OF AGG
LONG-TERM TLT CHART
Diversified bonds fund, AGG, hit all-time highs this Friday, but pulled back. New highs are very bullish and we could expect more highs in the not so distant future.
CHART OF AGG

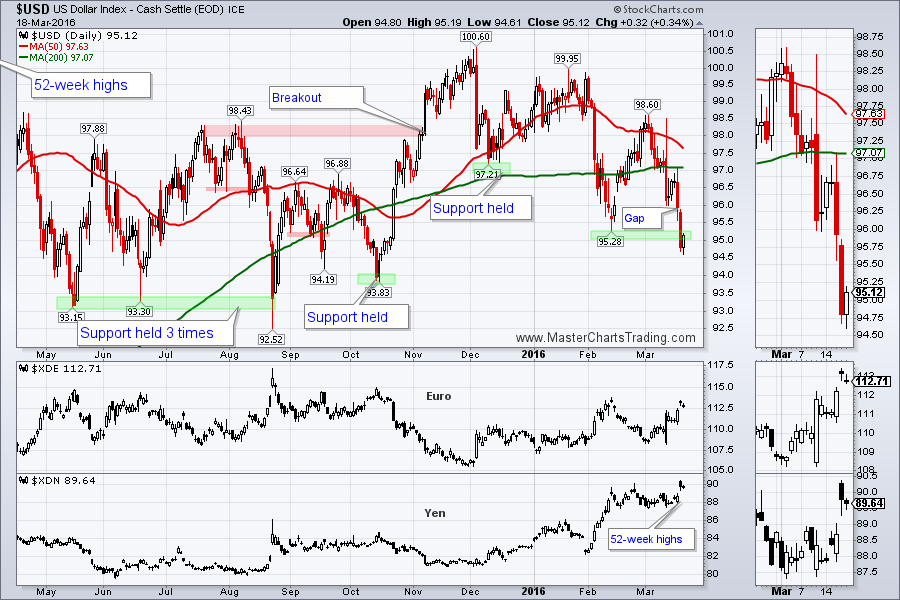
The Dollar pulled back for the third week in a row on the heels of losses versus both the Euro and the Yen. The Euro is trading in a sort of a range, but the safe-haven Yen seems to want to go higher, despite a massive intervention by the BOJ.
CHART OF $USD
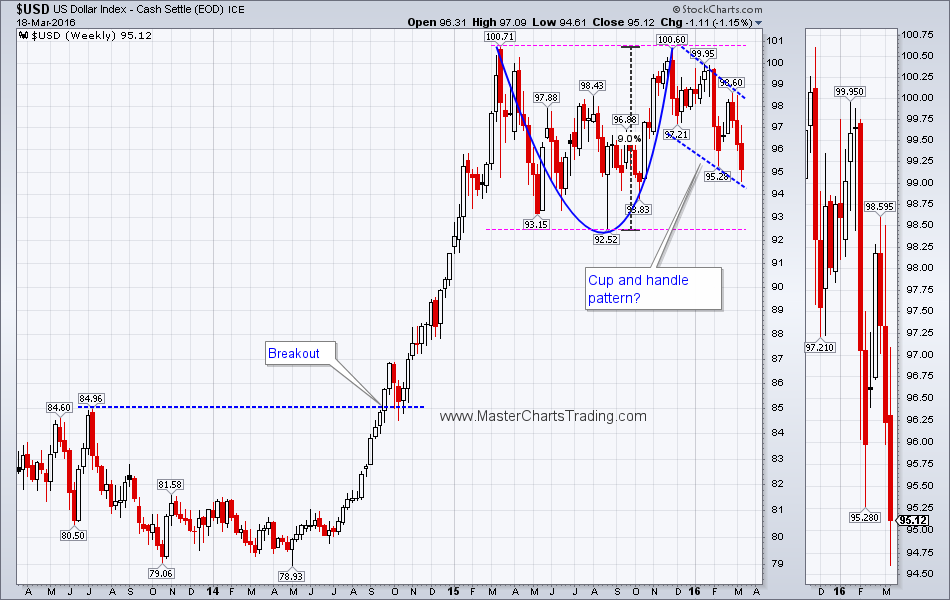
Long-term there could be a cup and handle on the chart of $USD, and a breakout above the 100 level would be quite bullish. An alternative scenario is a push lower to around 92, and a break below it. Should this breakdown occur, it could mean a pull of the $USD back to the 2014 breakout levels around 85.
LONG-TERM CHART OF $USD
CHART OF $USD
Long-term there could be a cup and handle on the chart of $USD, and a breakout above the 100 level would be quite bullish. An alternative scenario is a push lower to around 92, and a break below it. Should this breakdown occur, it could mean a pull of the $USD back to the 2014 breakout levels around 85.
LONG-TERM CHART OF $USD
Weaker dollar is certainly helping various commodities, gold especially.
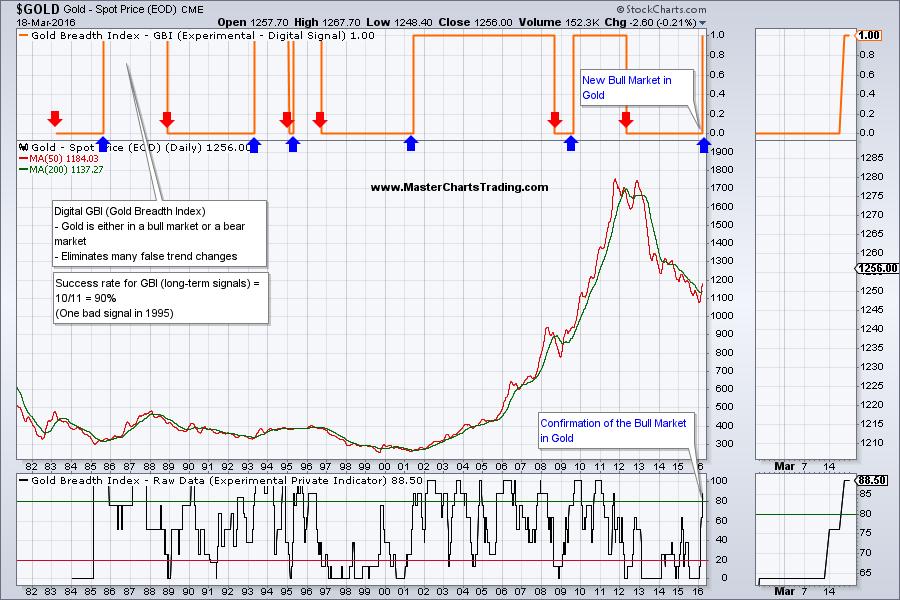
My long-term gold model (GBI) has flipped into a bullish mode.
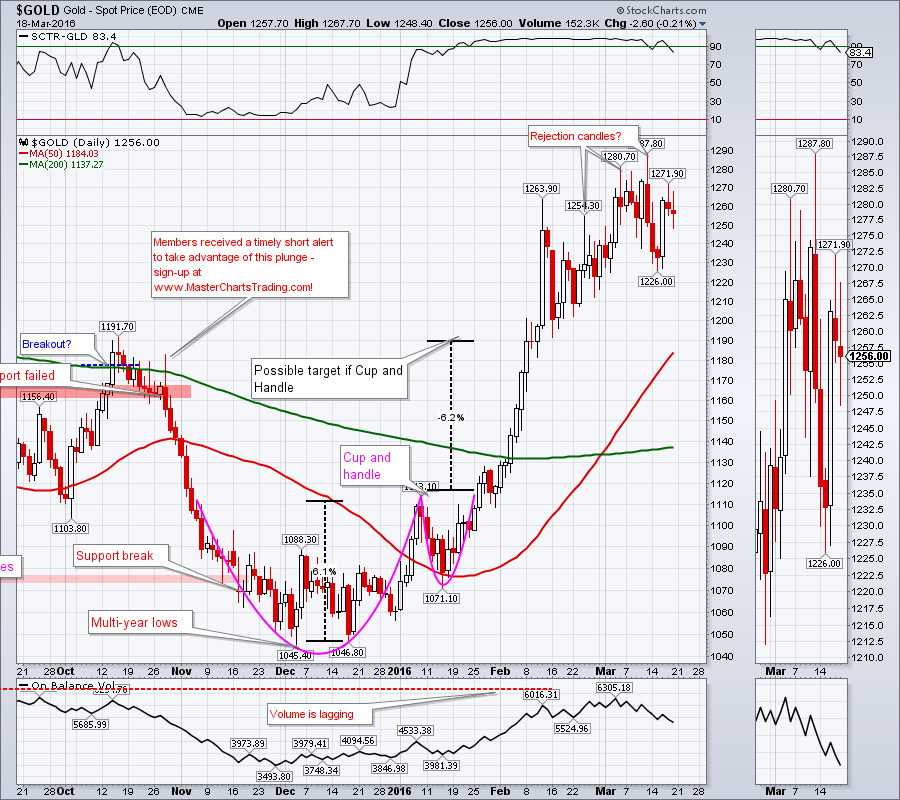
I am now around 90% confident that a new bull market in gold has started. What does it mean in the near future? Currently gold is very overextended to the upside, but it can get even more overextended by pushing above the recent highs. I am not going to be chasing this “once in a blue moon" trend change, but will patiently wait for a pullback and look for bullish setups. Gold may take a few days, a few weeks or a few months to get there, but it will eventually get there. This is synonymous to waiting for the market to come to you and avoiding chasing the market.
GOLD CHART
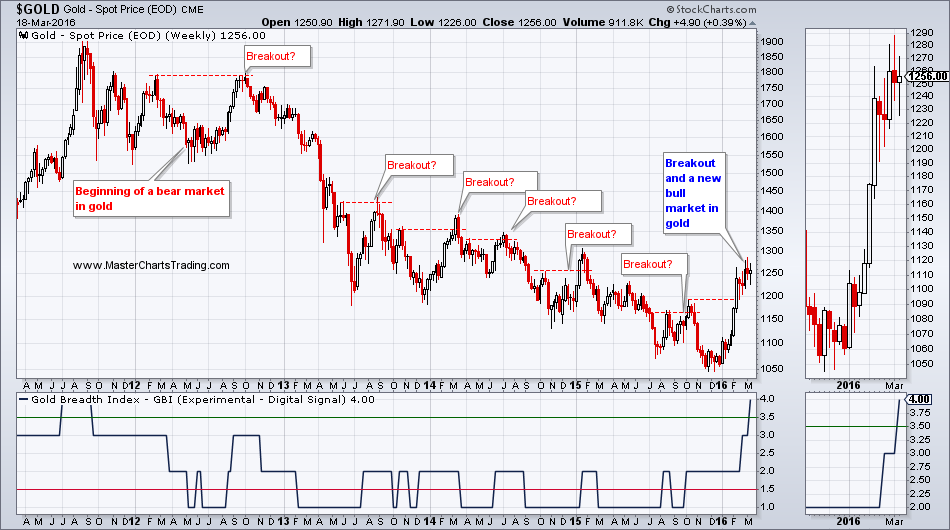
Even if gold did become bullish in the long-term, a retracement to the Fibonacci levels as pictured in the chart below is very likely. However now this could mean a buying opportunity, rather then a downside target.
1-YEAR WEEKLY CHART OF GOLD
My long-term gold model (GBI) has flipped into a bullish mode.
I am now around 90% confident that a new bull market in gold has started. What does it mean in the near future? Currently gold is very overextended to the upside, but it can get even more overextended by pushing above the recent highs. I am not going to be chasing this “once in a blue moon" trend change, but will patiently wait for a pullback and look for bullish setups. Gold may take a few days, a few weeks or a few months to get there, but it will eventually get there. This is synonymous to waiting for the market to come to you and avoiding chasing the market.
GOLD CHART
Even if gold did become bullish in the long-term, a retracement to the Fibonacci levels as pictured in the chart below is very likely. However now this could mean a buying opportunity, rather then a downside target.
1-YEAR WEEKLY CHART OF GOLD
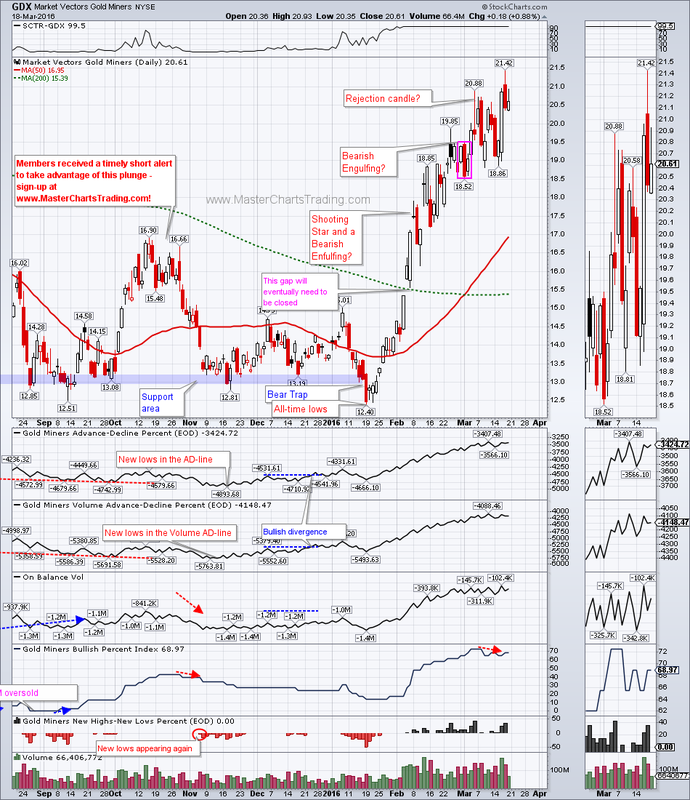
Our friend GDX is of course following what gold is doing, but in its usual volatile fashion. GDX is up over 73% from its all-time low in January and is approaching 52-week high – all this in just two month! As with gold, I am now treating GDX as a bullish security and will be looking for buying opportunities.
CHART OF GDX
CHART OF GDX
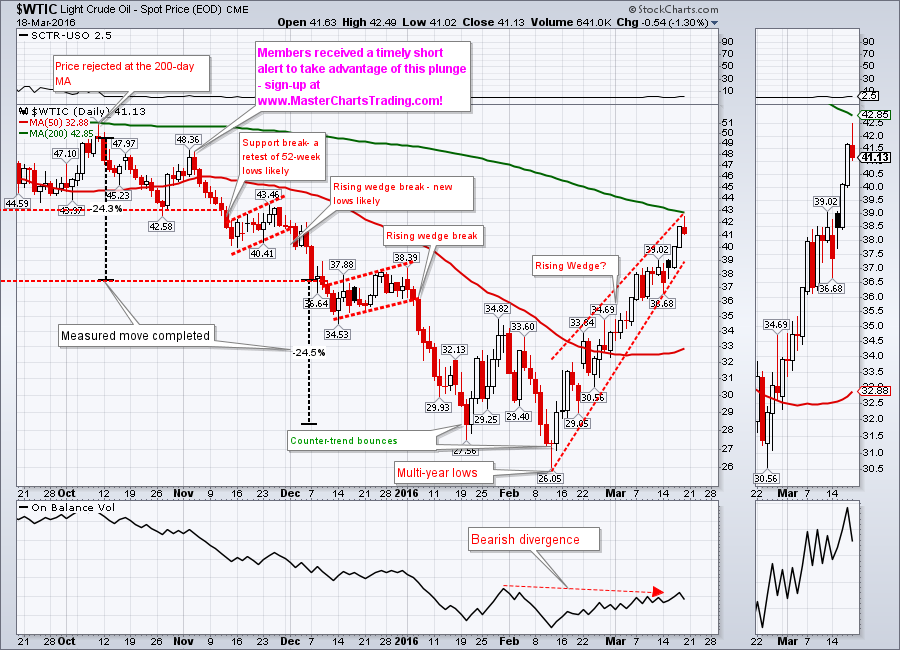
Oil failed to break down this week and continued up within its rising wedge/channel. On Friday it basically touched the 200-day moving average and pulled back. Will this level act as resistance again, or will oil push higher on the heels of the weaker dollar?
CHART OF $WTIC
CHART OF $WTIC
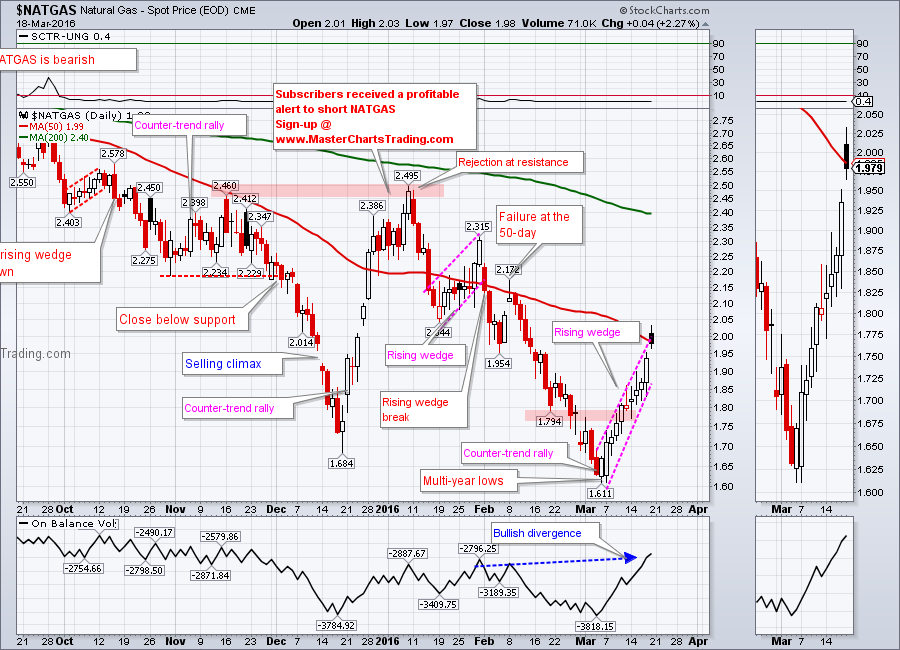
NATGAS had another counter-trend rally off the multi-year lows. It ended the week just below the 50-day moving average. The chart also shows a slight bullish divergence between the spot price of NATGAS and the On Balance volume indicator. Multi-year lows in my book imply a strongly bearish case, so we will be looking to short again once this rally peters out.
CHART OF NATGAS
CHART OF NATGAS
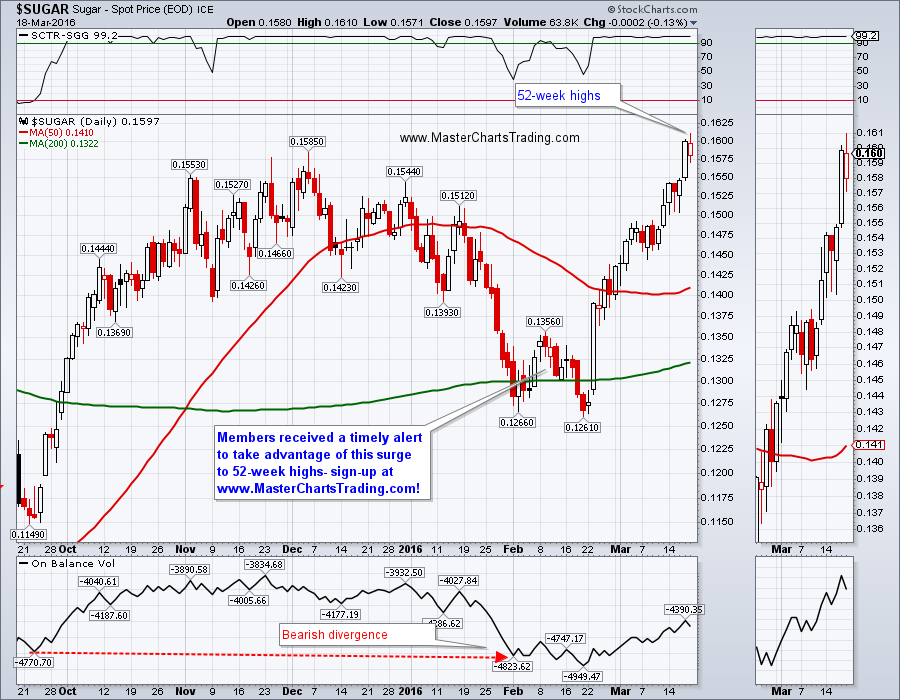
Various agricultural commodities may also be showing signs of life. This is possibly due to the weaker dollar as well. Sugar is one such commodity and my subscribers are up over 20% being long SGG. Sugar just hit a 52-week high, and the chart looks quite bullish.
CHART OF SUGAR
CHART OF SUGAR
Trade Alerts Service is now live – please sign-up here!
That’s it for this week’s market recap,
Best Regards and have another great trading week!
Alexander Berger (www.MasterChartsTrading.com)


 RSS Feed