|
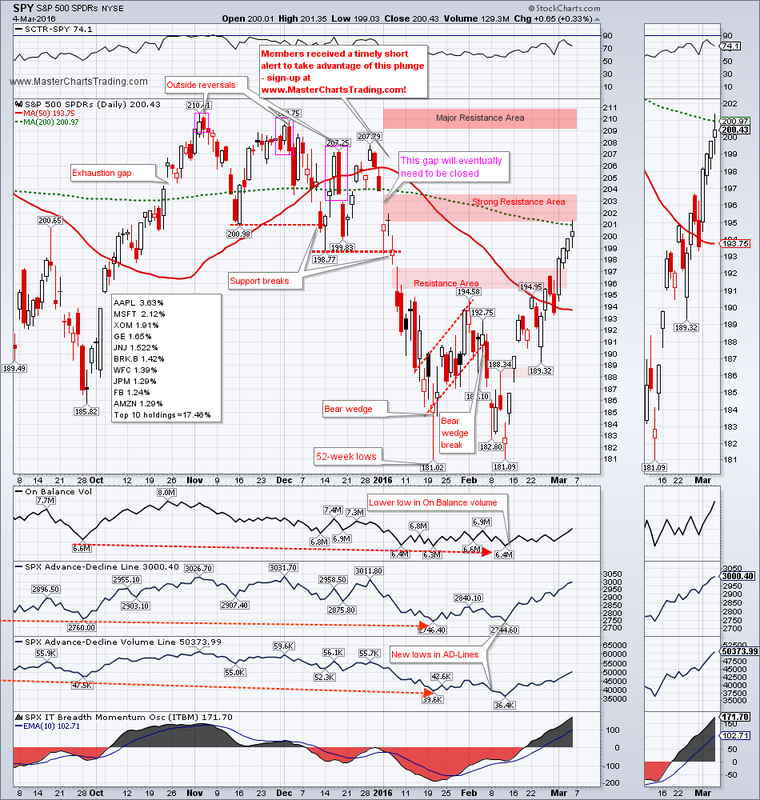
Stocks ended the week touching the 200-day moving average and pulling back from it. Just above, in the $202-$204 area lies a big gap down from the first trading day of this year. This are should now act as resistance. SPY moved over 11% off the 52-week lows set in February, so it’s a no-brainer that it is now overbought. An overbought condition within a bigger downtrend is a recipe for a push lower.
CHART OF SPY |
|
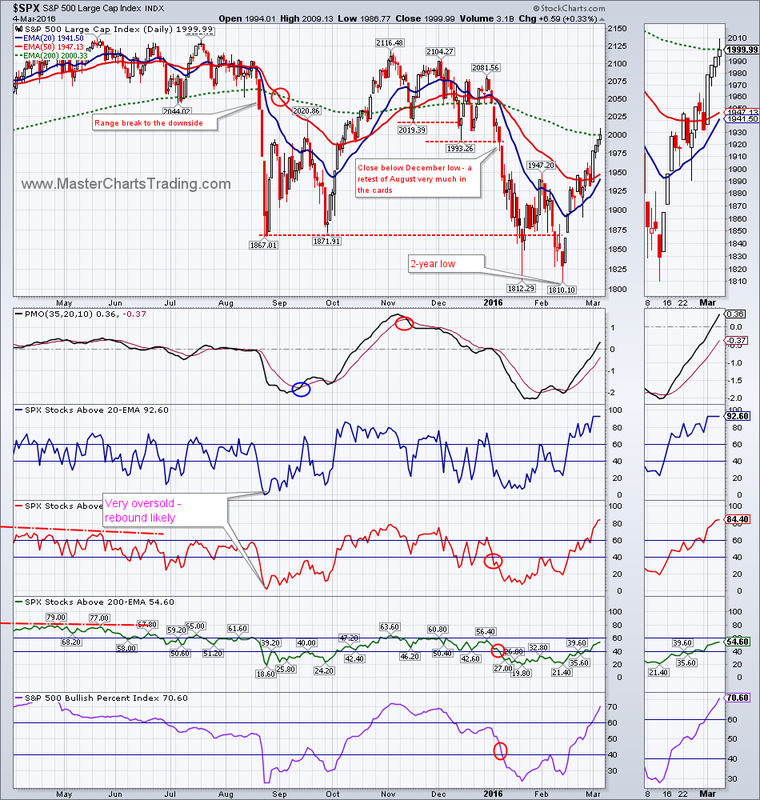
Looking at the market breadth measures, they have indeed improved. However, if we assume that $SPX is in a bear market these same breadth indicators are now also overbought. Again, this is a recipe for a drop lower.
CHART OF $SPX
CHART OF $SPX
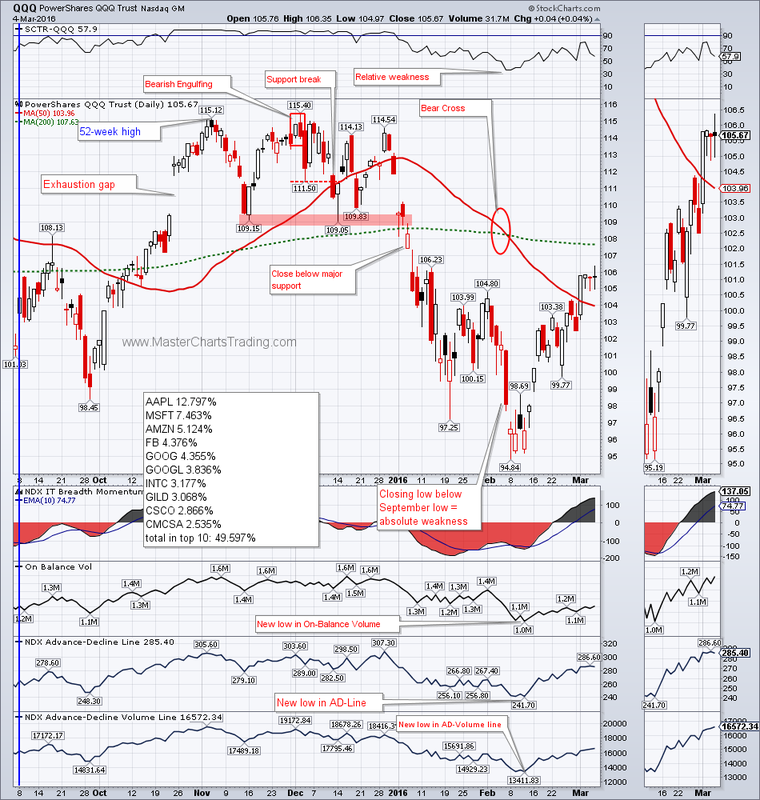
Interestingly, the NASDAQ 100 ETF, QQQ seriously underperformed the general market. Where SPY pushed higher almost entire week, QQQ traded sideways after the big gains on Tuesday.
CHART OF QQQ
CHART OF QQQ
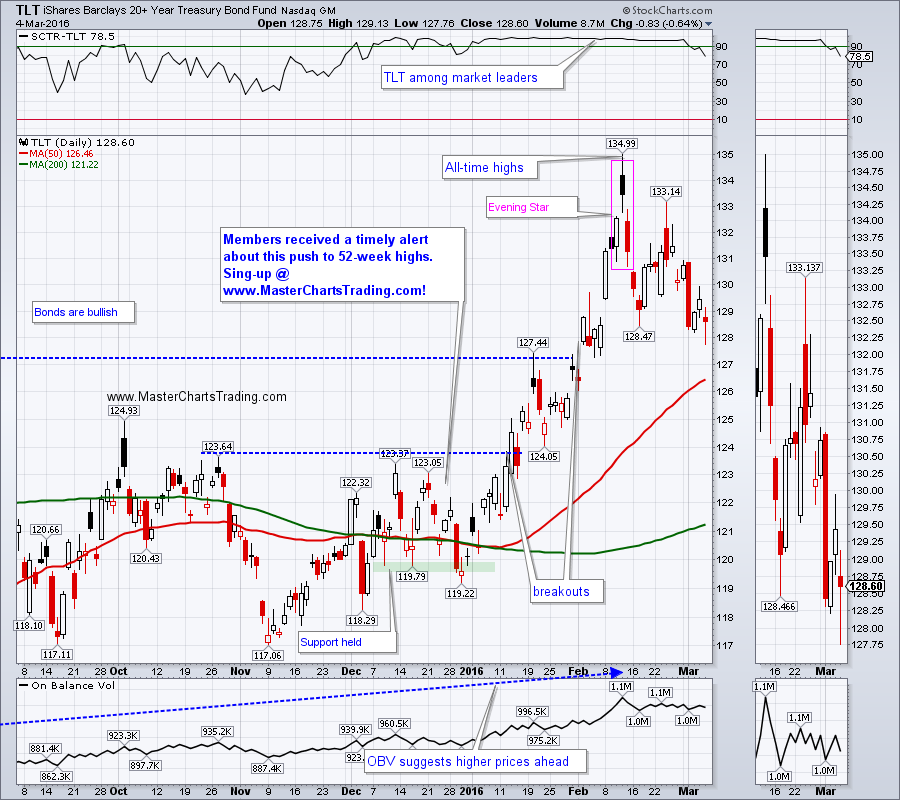
Long-dated Treasuries hit an all-time high just a few weeks ago and are still in the process of correcting and consolidating. TLT retested its breakout above the prior highs two weeks ago and possibly this Friday. Should this Friday’s levels hold and TLT bounces back up, we could consider the breakout successful. Bonds are bullish, so this pullback could be considered a buying opportunity once the uptrend resumes.
CHART OF TLT
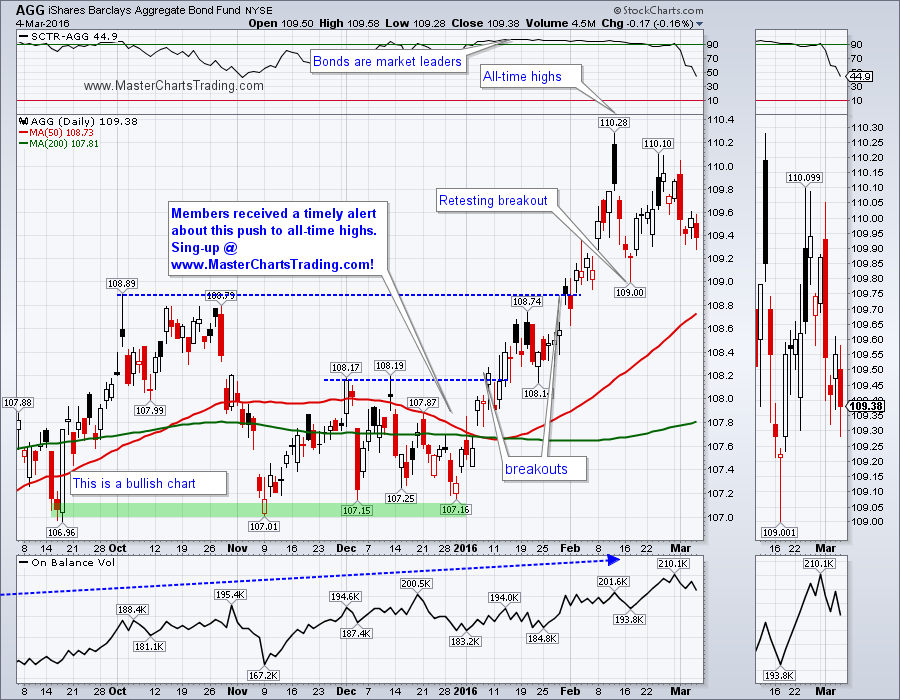
AGG is showing a similar bullish pattern, but looks stronger then TLT. This week, unlike TLT, it did not even come down to the breakout level.
CHART OF AGG
CHART OF TLT
AGG is showing a similar bullish pattern, but looks stronger then TLT. This week, unlike TLT, it did not even come down to the breakout level.
CHART OF AGG
The municipal bonds took the brunt of selling and pulled back from all-time highs also. The correction in MUB is much deeper then the rest of the bond market. MUB is nearing an important level of $110.50-$110.25. This is where the previous unfilled gap-up remains and also the Fibonacci retracement of 38% is coming in there.
CHART OF MUB
CHART OF MUB
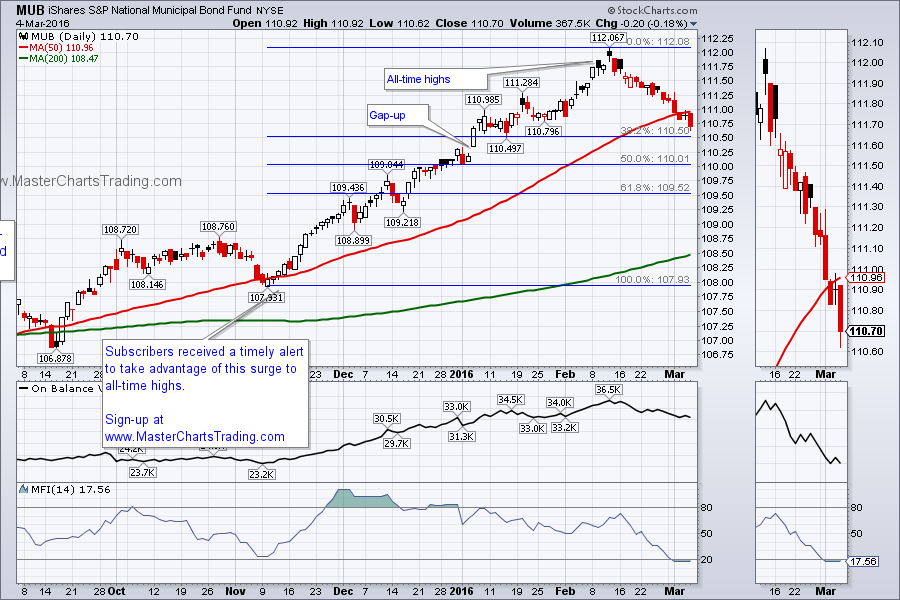
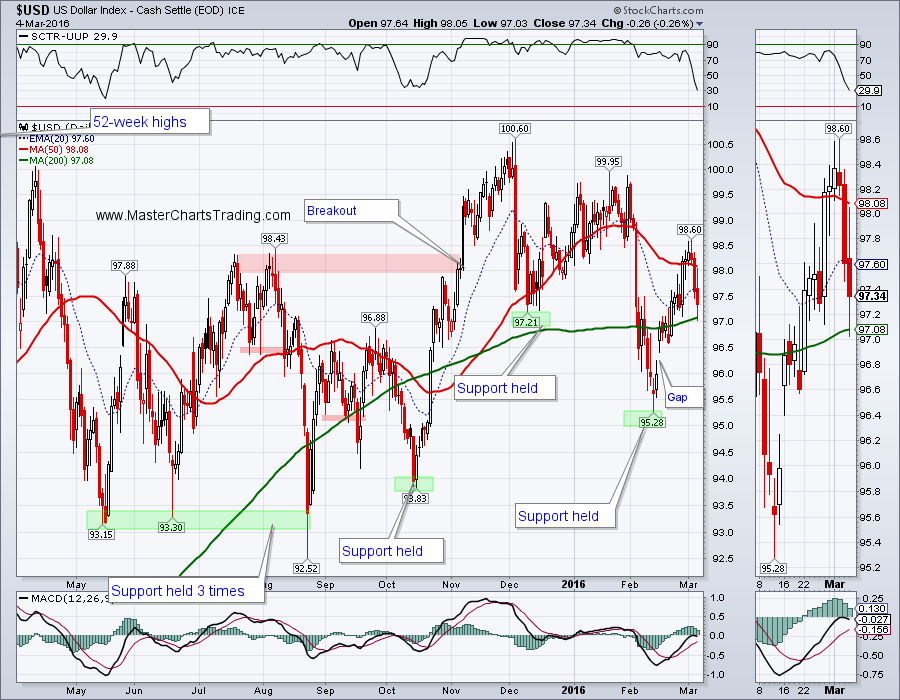
Chart of the $USD is a bit of a mess right now. Long-term I think $USD is bullish, but short-term there was a lot of chopping around and not a lot of progress by either bulls or bears. Down below in the $96.30 area is an unfilled gap, yet up above just above $100 are the 52-week highs. So will the Dollar rollover or push to new highs?
CHART OF $USD
LONG-TERM CHART OF $USD
CHART OF $USD
LONG-TERM CHART OF $USD
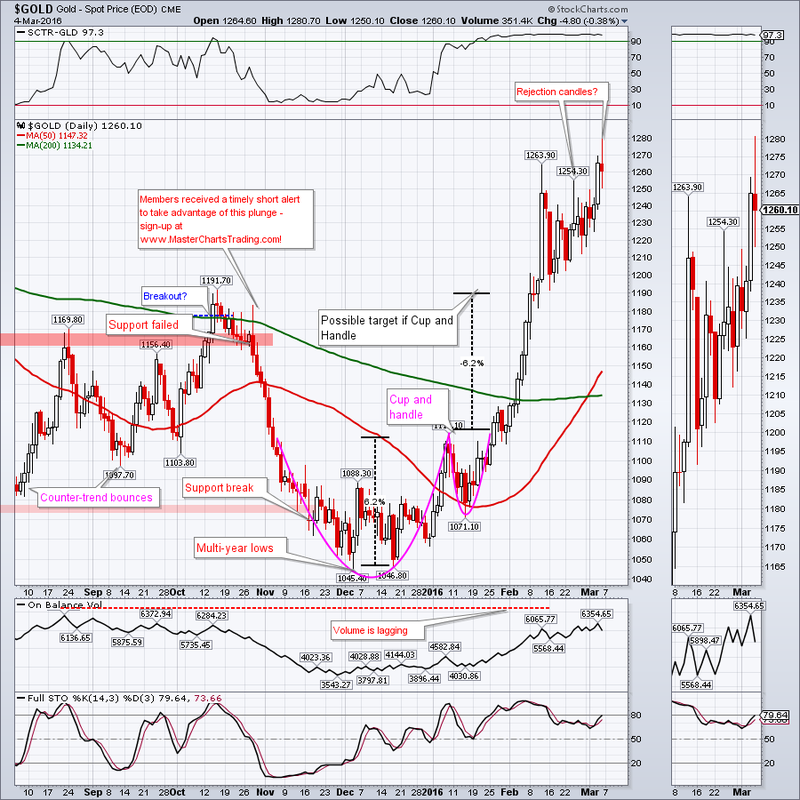
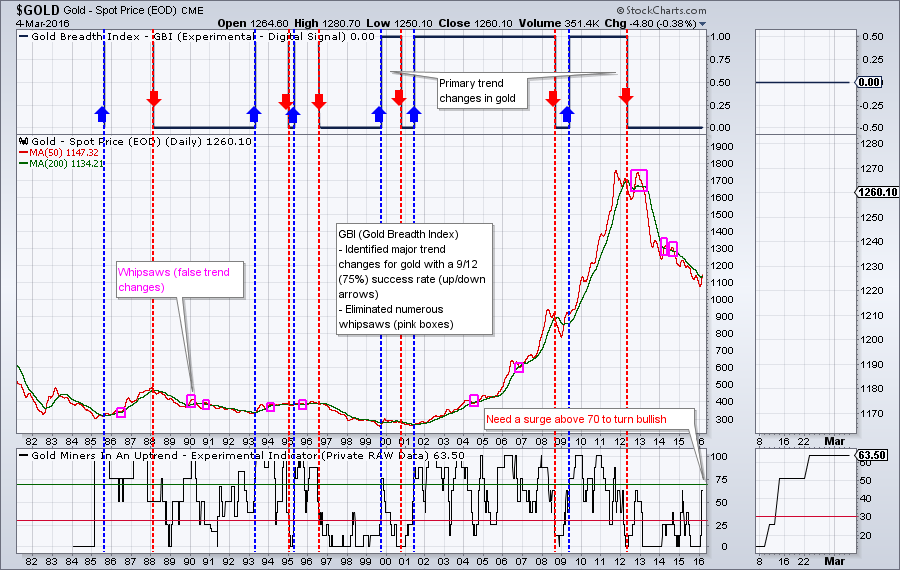
Gold closed the week at $1260.10 with another possible rejection candle. GBI (Gold Breadth Index – proprietary) has not yet flipped into the bullish camp. In the back testing GBI was able to predict major trend changes with a 75% accuracy and eliminated a lot of false trend change signals. The indicator can flip at any time in the not so distant future. Should it do so, I will start looking for bullish setups within a bigger uptrend. For now I am still doing the opposite.
GOLD CHART
GOLD CHART
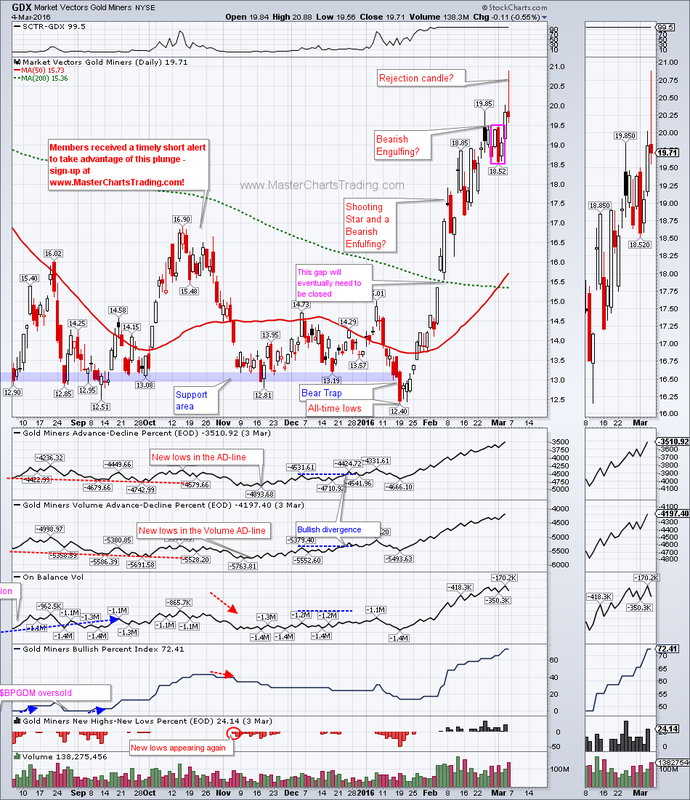
GDX may have also printed a rejection candle on Friday. Over the last few weeks GDX printed a bunch of topping looking candles, but all of them were eventually negated, so its difficult to say whether or not this one would be different. Should gold roll over - GDX will follow.
One of the more reliable indicators for GDX is a Gold Miners Bullish Percent Index ($BPGDM). $BPGDM has been rising steadily, and now stands at 72.41%. This is an impressive achievement that this indicator hasn’t done since almost the beginning of the bear market in gold back in 2012. We will see if GDX tops out now, or if it continues higher.
CHART OF GDX
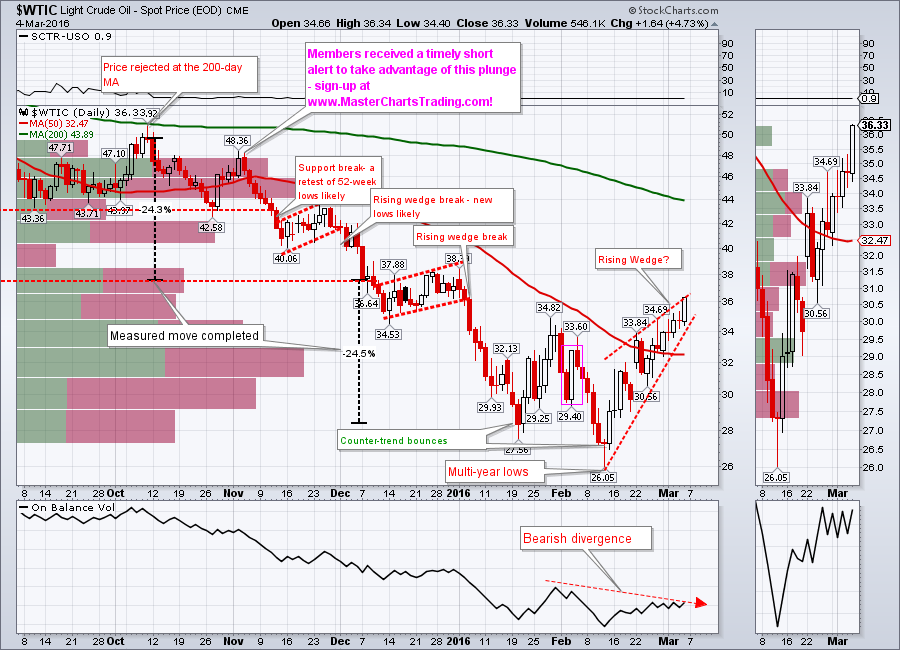
Oil ($WTIC) is showing an interesting pattern on its spot price daily chart. $WTIC hit multi-year lows just in mid-February and then rebounded to above the 50-day moving. Now oil seems to have formed a rising wedge and is bumping above the previous area of broken support. There is also a bearish divergence between the price of oil and the On Balance volume indicator. On Balance volume is making lower high, while $WTIC was able to push above the recent high of $34.82. Oil is a bearish security, so unless it punches higher next week, we could see it roll over and test the multi-year lows again.
CHART OF $WTIC
CHART OF $WTIC
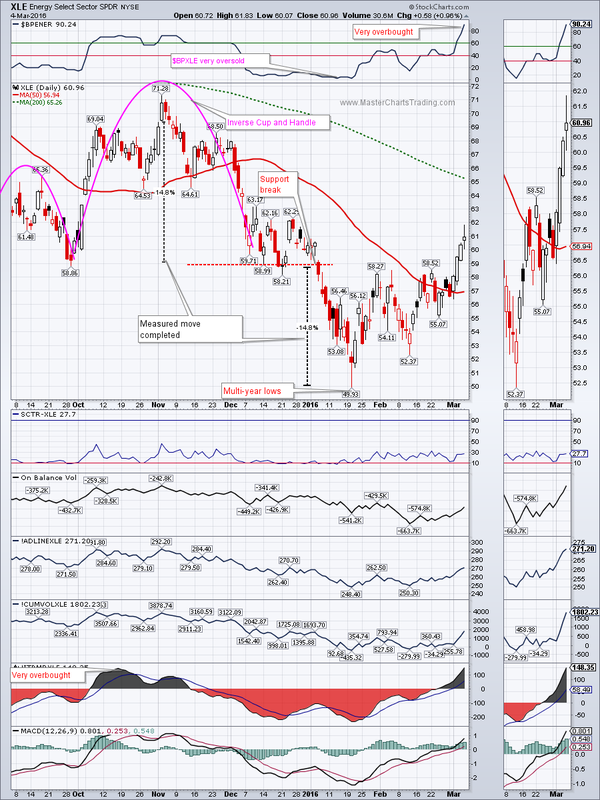
Staying on the topic of oil lets move on to XLE, the energy ETF. XLE has been rising together with the general market and oil off the multi-year lows set in January. Given the situation in oil it is not surprising that XLE is one of the worst performing sectors (read very bearish). Again one of the more reliable indicators for this fund of late was the Bullish Percent Index ($BPENER). Just in January it was near zero, while now it reads an impressively overbought 90.24! Should XLE fail here new lows are very likely.
CHART OF XLE
CHART OF XLE
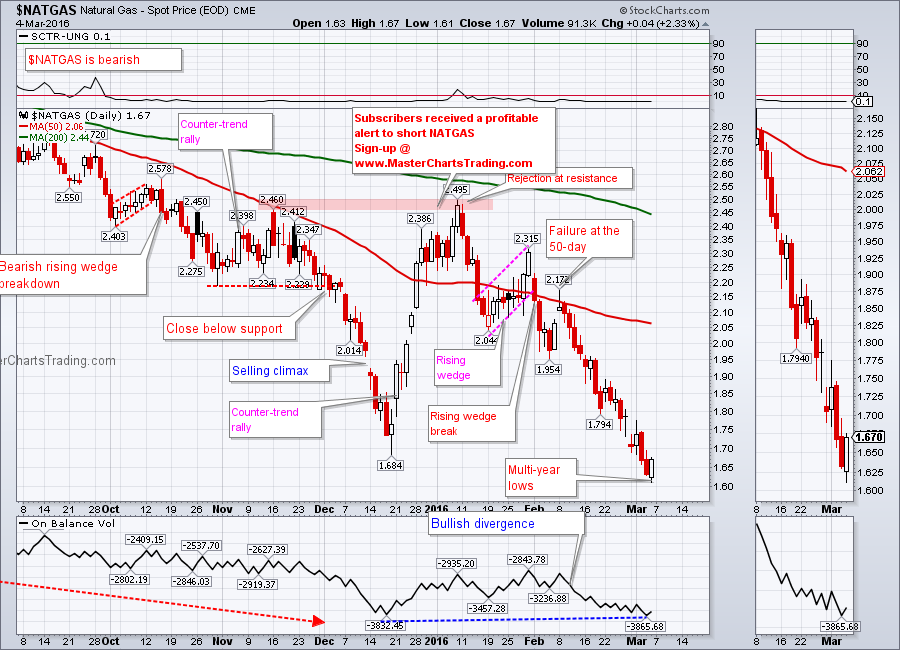
Natural gas again holds a dubious distinction of hitting fresh multi-year lows on Friday. If you read some of my previous posts you probably have noticed that I maintained my bearish posture on NATGAS for the past year or so. The recent bear-market rally in December was sharp and impressive, but it was still a short-covering rally, nothing more. Subscribers that opened position in DGAZ back in January are now sitting on over 100% profits.
There is a slight bullish divergence between the price itself and the On Balance volume indicator. So a bounce now cannot be ruled out as swing traders open long positions. Overall NATGAS is very bearish and I will only be looking at short positions.
CHART OF NATGAS
There is a slight bullish divergence between the price itself and the On Balance volume indicator. So a bounce now cannot be ruled out as swing traders open long positions. Overall NATGAS is very bearish and I will only be looking at short positions.
CHART OF NATGAS
Trade Alerts Service is now live – please sign-up here!
That’s it for this week’s market recap,
Best Regards and have another great trading week!
Alexander Berger (www.MasterChartsTrading.com)
That’s it for this week’s market recap,
Best Regards and have another great trading week!
Alexander Berger (www.MasterChartsTrading.com)


 RSS Feed