|
Special thanks for those of you who have signed-up for my Trade Alerts Service! As you may know this project has been in development for over a year now. It really means a lot to me that there is now a surprisingly large interest in my expertise. I will do my very best to not disappoint with my calls!
Many other services provide recommendations of what to buy or sell, but they avoid putting their money on the line together with their clients’ money. My Trade Alerts are the actual trades that I execute – so my money is on the line together with yours! Moving on to market action. |
|
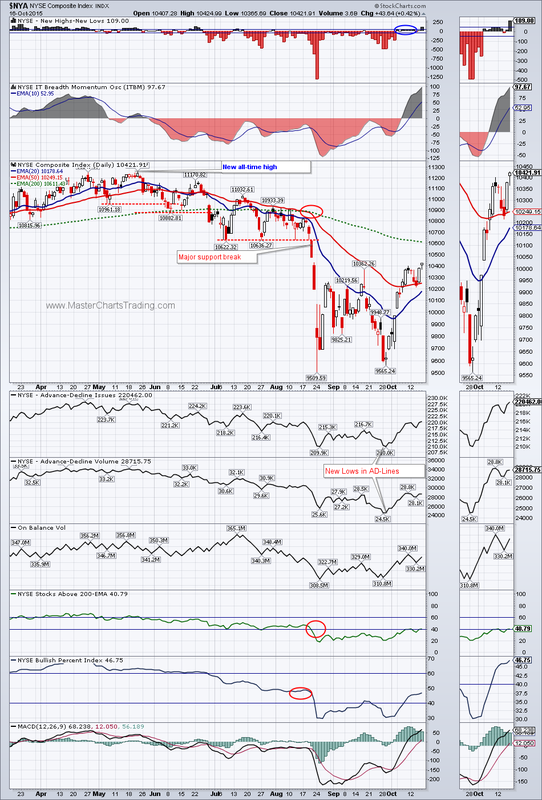
I was looking over some historical charts of New York Stock Exchange composite index ($NYA) and found some amazing similarity to today’s picture. Back in January-February of 2008, $NYA traced out a very similar pattern to what we have right now. First in January 2008 there was a major support break, followed by a strong rebound. The trend and market breadth indicators have turned negative, but then gradually improved into late February 2008. Note specifically ITBM – Intermediate Term Breadth Momentum Oscillator. It turned positive and was above its 10-day exponential moving average (EMA). Then in late February, it crossed its 10-day EMA and continued down. The price of course followed lower.
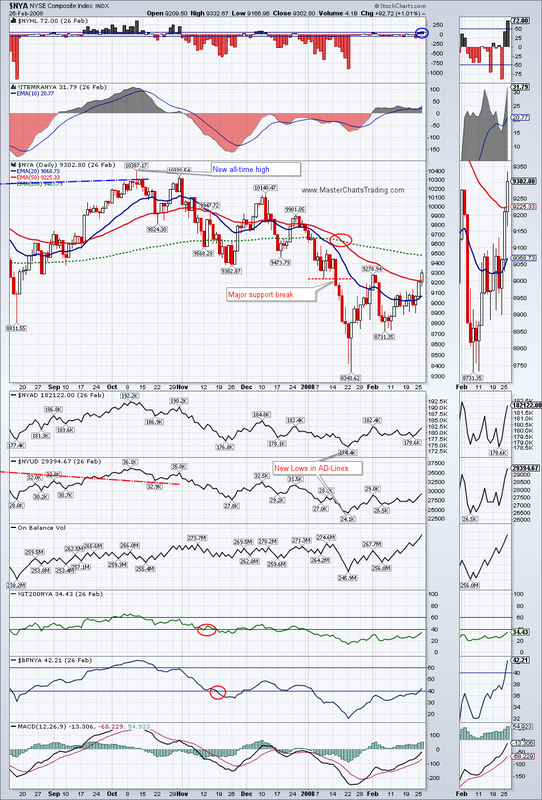
We have a remarkably similar picture in many of the indices right now. The ITBM is in the positive territory and above its 10-day EMA. However notice that this is the first time ITBM is positive following the support break in August. If ITBM rolls over here, we could easily get a re-test of September lows again.
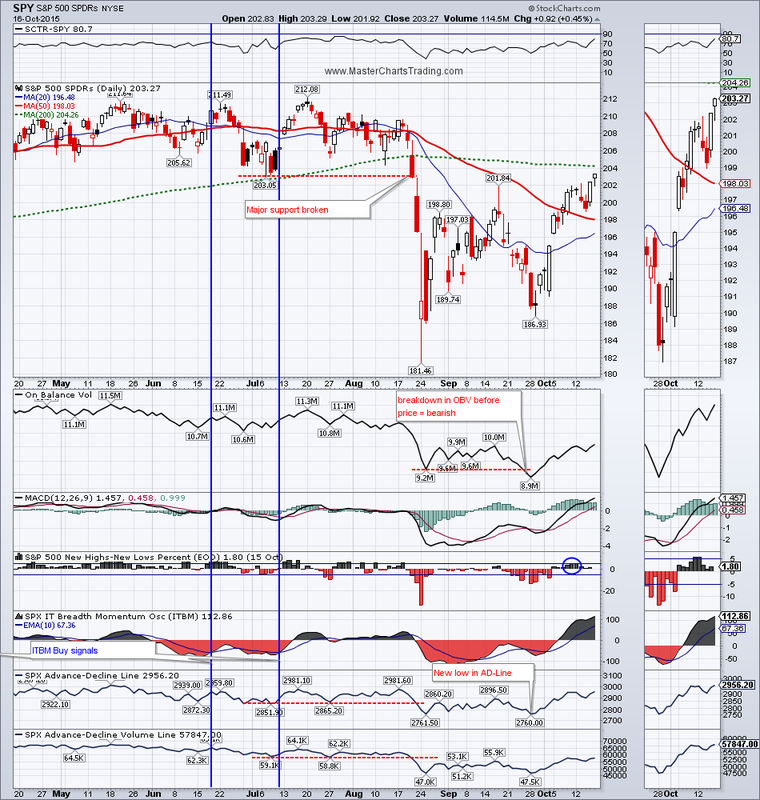
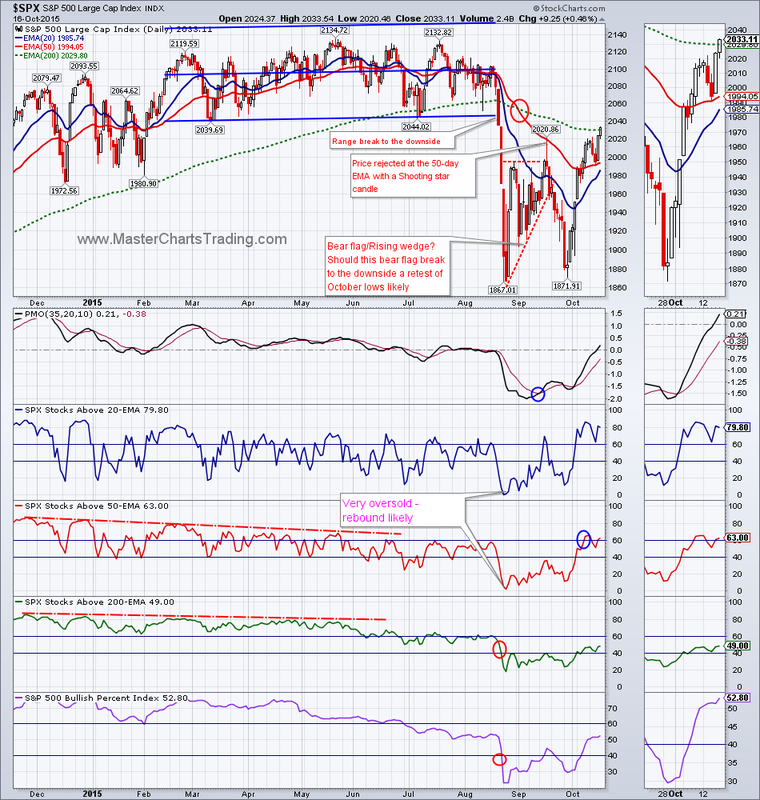
S&P 500 is showing a similar pattern as $NYA. Market breadth has improved further from last week, but it is still falling short of the bull market thresholds. Percent of stocks above 200-day EMA is still below 60, and so are the Bullish percent indices for all the major markets.
Charts of SPY and $SPX
Charts of SPY and $SPX
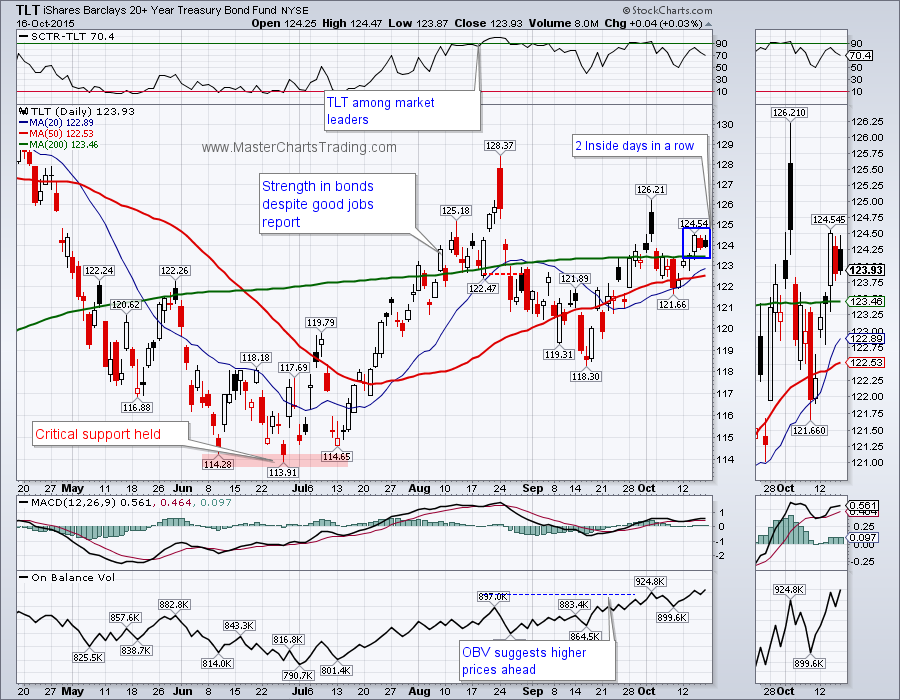
Bonds still outperformed stocks on relative basis. TLT gained 1.35% for the week, while SPY added just under a percent. Why would there be strength in bonds, if stocks seem to be breaking out? Fear is very much alive and well in the markets and bonds, especially US Treasuries are still considered to be the safest place to park your cash. I am bullish on bonds until proven otherwise.
Chart of TLT_
Chart of TLT_
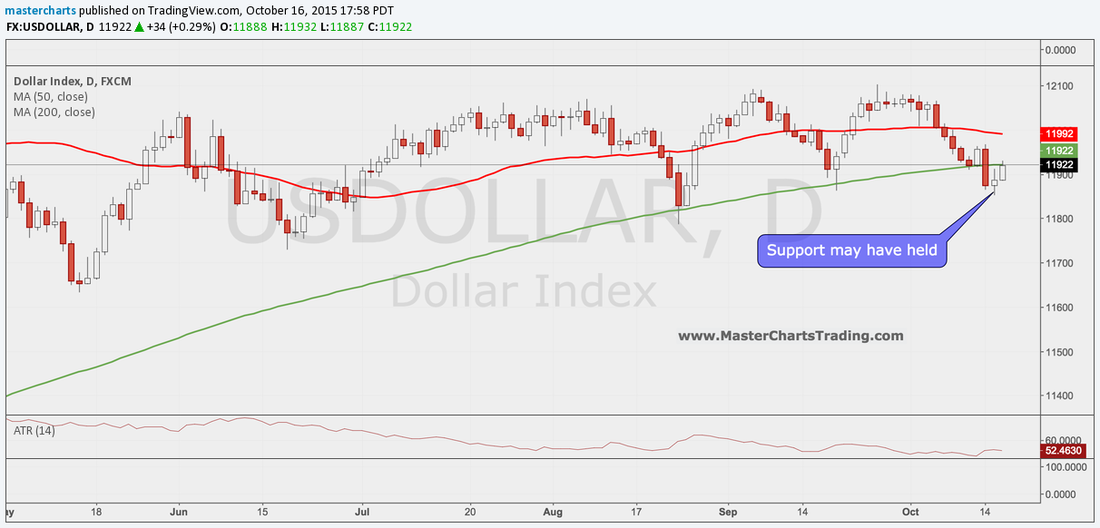
US Dollar index (as traded on Forex) may have held support this week. If it is indeed so, dollar could gain in the days and weeks ahead and put pressure on various commodities such as gold, oil and naturals gas – so lets look at them next.
Fans of the yellow metal were happy this week as gold gained almost 2% and was able to close above the 200-day moving average for the first time since May. Could this short covering rally that started in July turn into an honest-to goodness bottom in gold prices? I will keep an open mind to that possibility. In the meantime I do not see much evidence to counter my hypothesis that the bear market in gold that started in 2012-2013 is over. Trend in motion stays in motion and long-term charts of gold are very much still bearish.
CHART OF GOLD
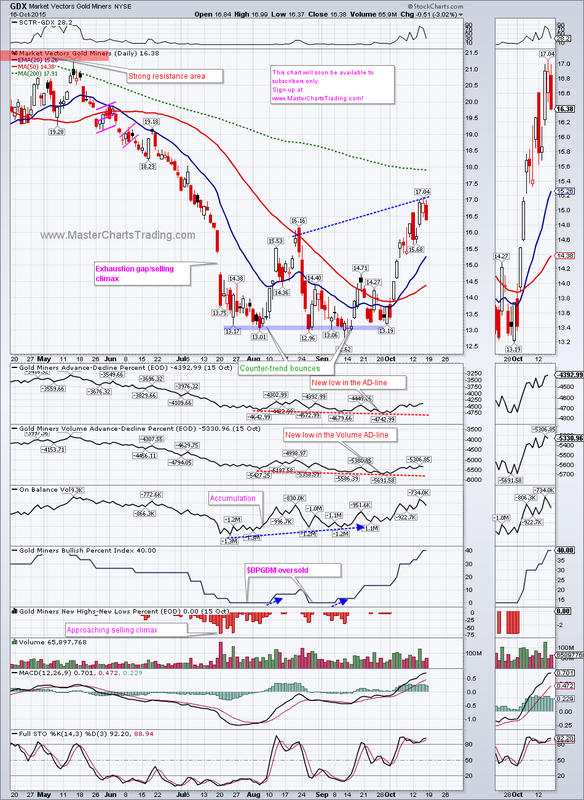
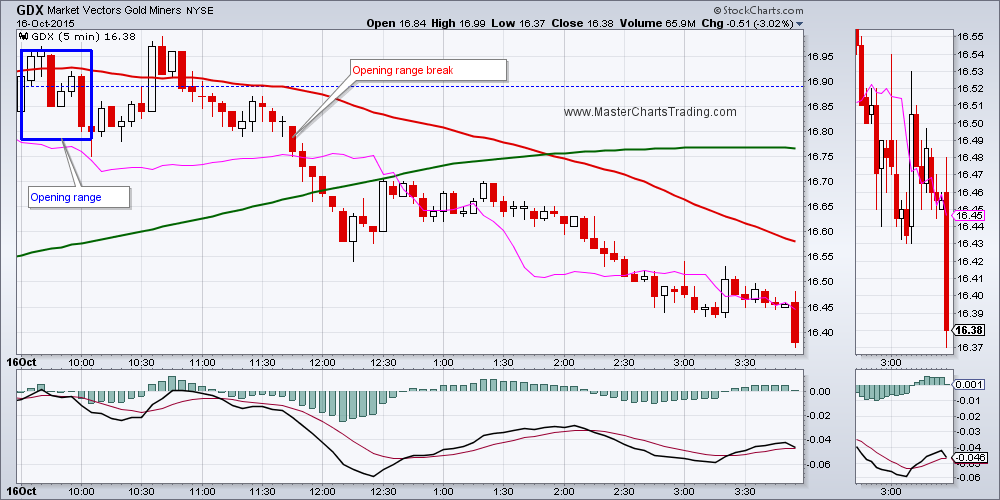
Gold’s extremely volatile brother – GDX fared surprisingly worse then gold itself. It tacked on only about ¾ of a percent. After the Wednesday’s 6.5% gain (yes GDX moves that much), the rally petered out and GDX ended Friday on a decidedly sour note. Sellers dominated Friday’s action into the close and I would not be surprised to see continued selling on Monday.
As I mentioned last week, the market breadth for GDX still has a lot of work cut out for it. The AD-Lines for GDX haven’t been able to exceed even the August highs – a bearish sign. Bottom line – GDX is overbought and in a downtrend. If you read my previous blog entries you know what I am going to say next: it’s a shorting opportunity.
CHART OF GDX
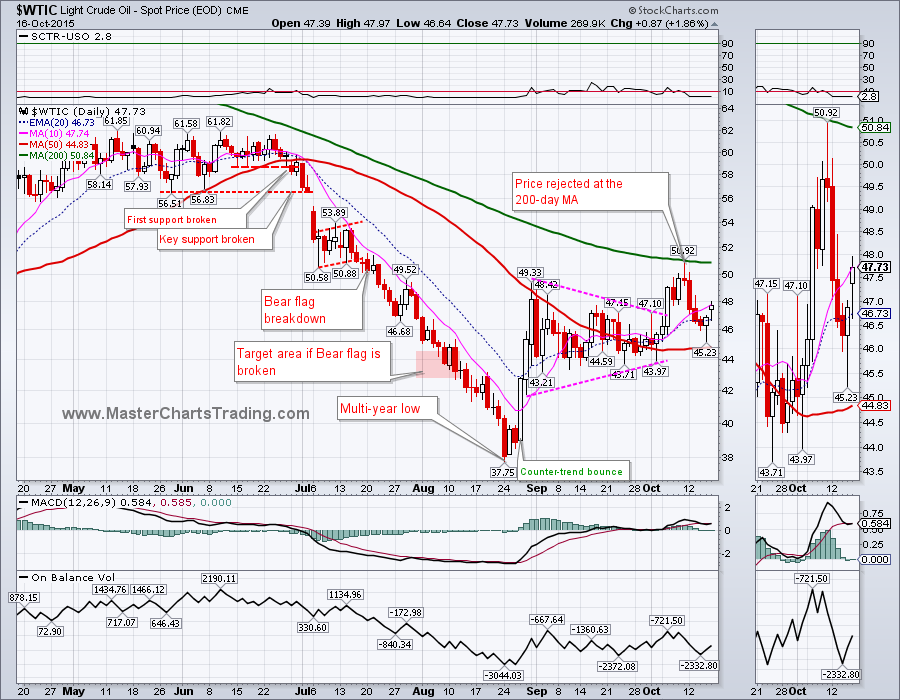
Last week on Friday, oil ($WTIC) traced out what appeared to be a shooting star candlestick as higher prices were rejected at the 200-day moving average. Shooting star candle was confirmed this week with a follow-through lower. But then again, oil seems to have found support around $45 - close to the 50-day moving average. So for now, the prices seem to be stuck between these two lines. Long-term oil is bearish, so bearish outcome of this trading range seems more likely.
CHART OF OIL
CHART OF OIL
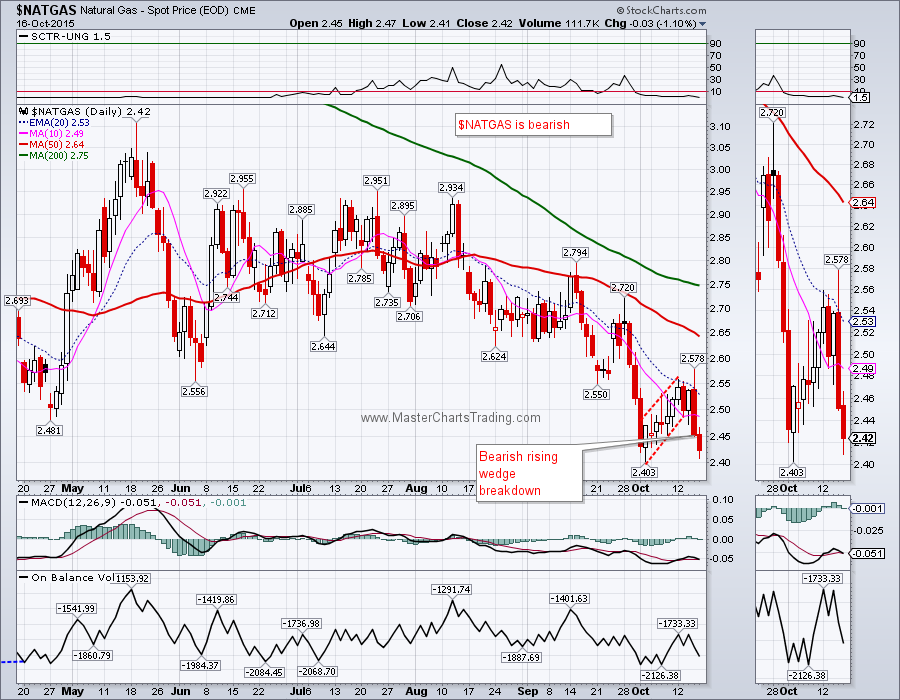
Finally natural gas ($NATGAS) hit a 52-week low at the beginning of October and rebounded with a classic pattern of a rising wedge. A rising wedge pattern in a bearish security is a bearish continuation pattern. Thursday saw a decisive break of this bear wedge and Friday we had more follow-through to the downside. More 52-week lows are now very likely.
CHART OF $NATGAS
CHART OF $NATGAS
That’s it for this week’s market recap,
Best Regards and have another great trading week!
Alexander Berger (www.MasterChartsTrading.com)
Best Regards and have another great trading week!
Alexander Berger (www.MasterChartsTrading.com)


 RSS Feed