|
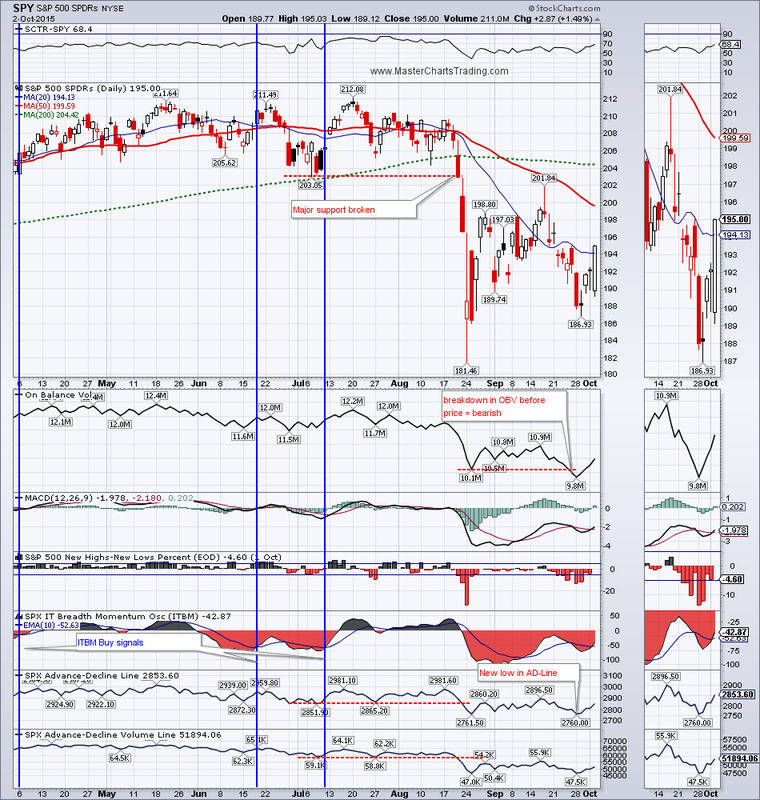
It appears that the support from the lows set on August 25, have held. SPY, the S&P 500 tracking ETF, tested it on Tuesday, but lower prices were rejected. For now. Short-term rally is on. I still think that, at the very least, we are either in the middle of a correction, or possibly the beginning of a bear market, time will tell. For now both the regular indicators and the market breadth indicators are pointing to more corrective action, rather then a V-Shaped recovery.
Chart of SPY |
|
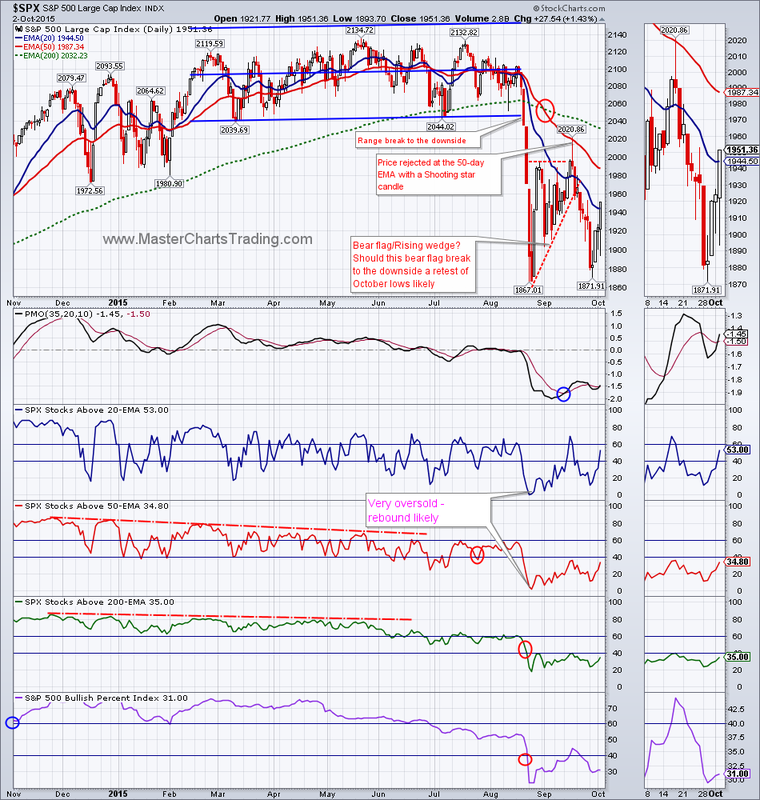
If we now assume that the market has turned, then the % of stocks above the 50-day and the 200-day exponential moving averages (EMAs) are confirming it. Furthermore, the % of stocks above the 20-day EMA is already above 50 and approaching the overbought zone (for the bear market). An important test of the current rally in stocks is coming up. It will be interesting to see if we once again fail when the % of stocks above the 20-day EMA reaches around 70%.
Chart of SPX with market breadth
Chart of SPX with market breadth
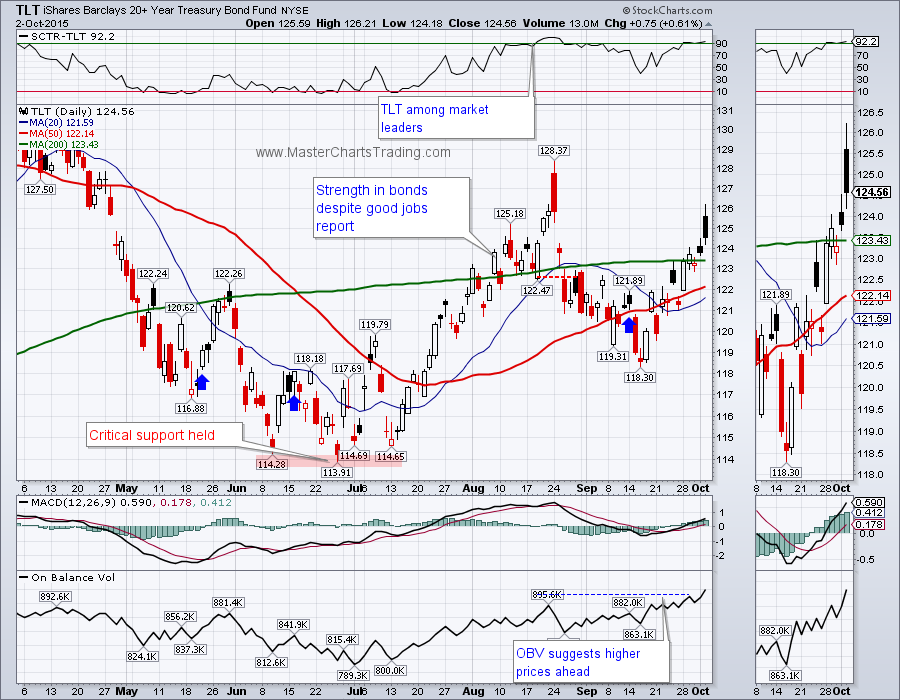
High quality bonds of all sorts are outperforming stocks. TLT managed to break out and close above the 200-day moving average. The close on Friday was not terribly impressive: TLT gapped up at the open, only to sell-off by day’s end. Nevertheless, TLT is up 2.7% for the week, while $SPX is up about 1%.
Chart of TLT
Chart of TLT
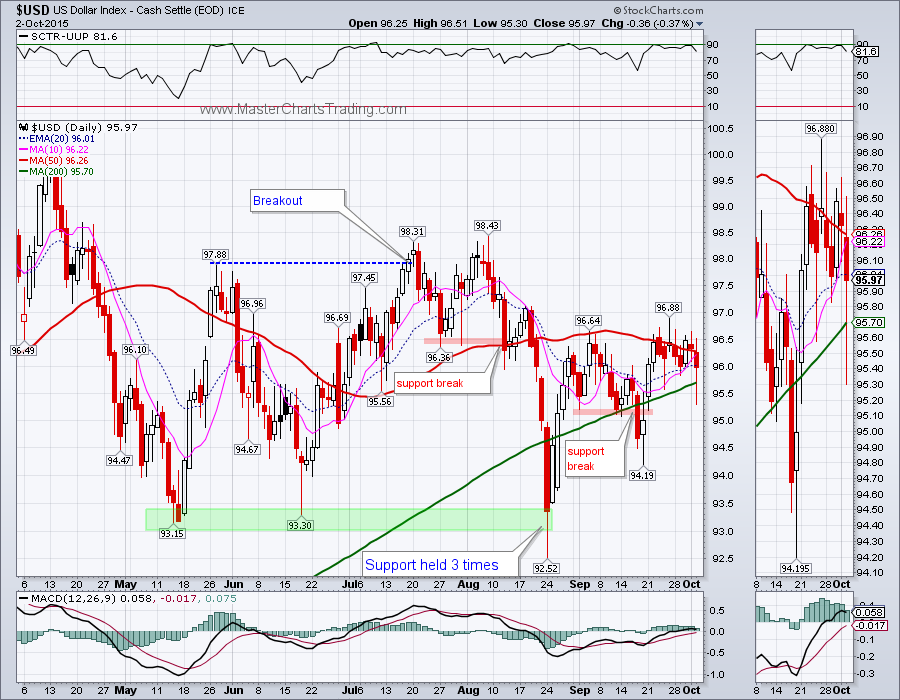
The Dollar index is still struggling with resistance – it seems to be unable to break above the highs set in early September. The best that can be said about the Dollar right now is it is in the middle of sideways consolidation. Long-term dollar is still bullish, so it is more likely to head higher then lower from here.
Chart of dollar index
Chart of dollar index
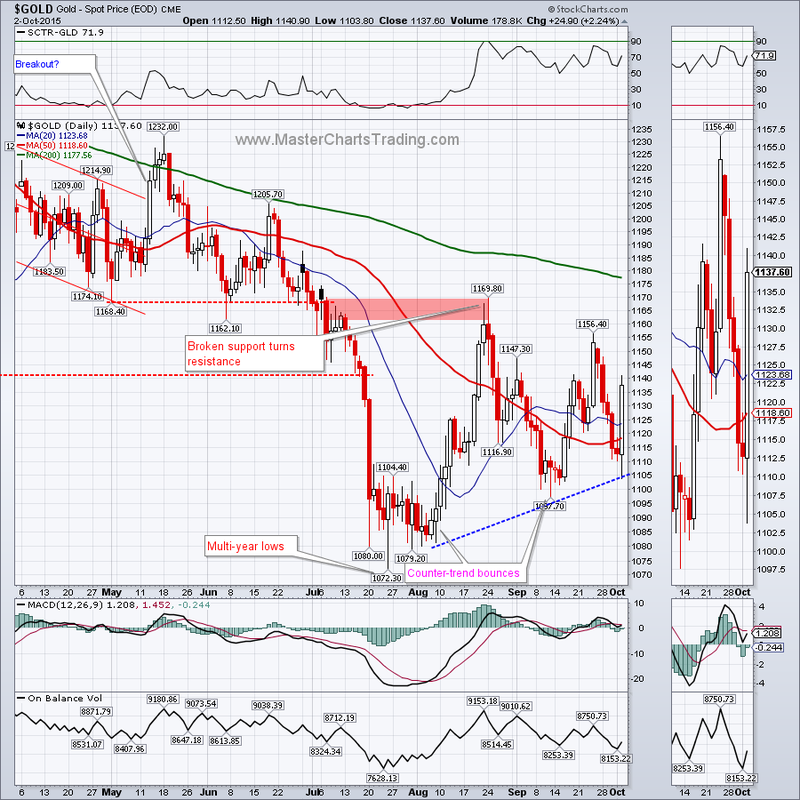
Less strength in the dollar is relieving pressure on the commodities. Gold spent the entire week testing bull’s nerves before finally finding support around $1105 (previous support area). For the previous few weeks I have been bullish on gold short-term. Long-term gold is still in a bear market. Whether the current price action in gold is indeed the true bottom remains to be seen. For now, next strong resistance area is in the $1160-$1170 area where two recent failures occurred.
Chart of gold
Chart of gold
GDX (gold miners) was the clear winner of this weeks’ - gaining over 8%. Most of the gains occurred on Friday. GDX almost always follows gold; it is now following gold higher on improving market participation as breadth indicators improved. Unless GDX fails here, next resistance area is in the $15-16 area where the previous rally from August petered out.
Chart of GDX
Chart of GDX
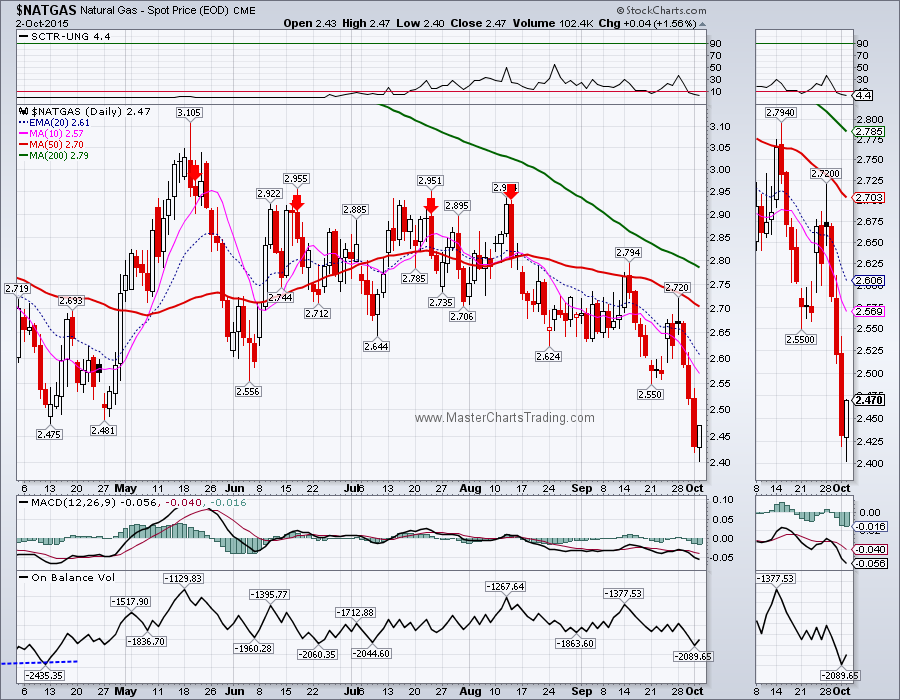
Another commodity I regularly follow and occasionally trade is natural gas. In early August I mentioned that natural gas ($NATGAS) went on my short signal. $NATGAS is bearish long-term, so I was only interested in short setups, in other words I was looking for overbought conditions at resistance. Such presented itself on August 13th and since then $NATGAS is down over 14%. I already locked-in two of my profit targets, so the rest of the position remains to ride any possible gains from further weakness in $NATGAS.
Chart of $NATGAS
Chart of $NATGAS
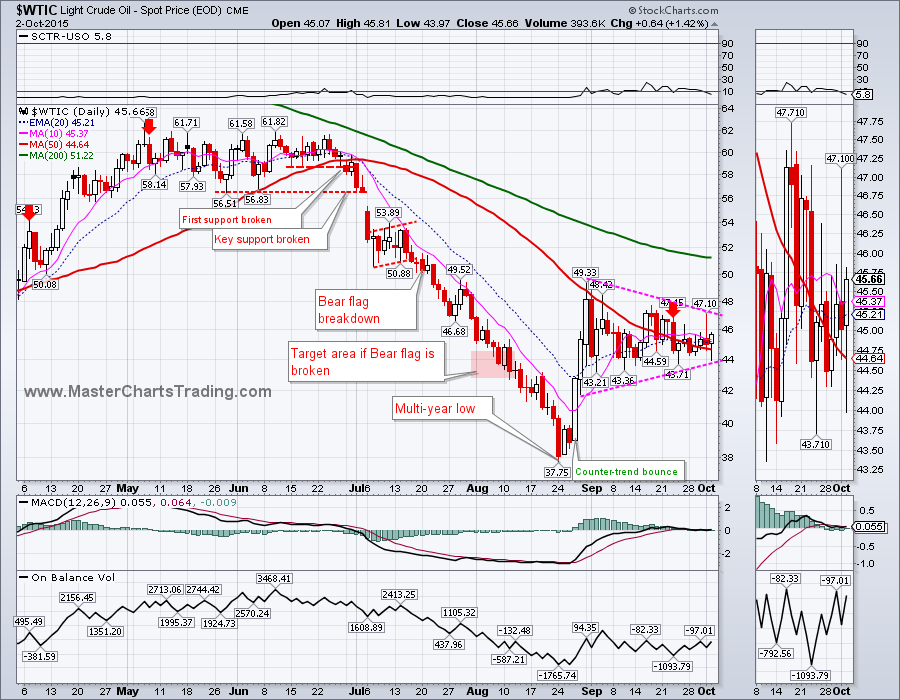
I had a request from one of the listeners to cover oil ($WTIC) this week. So here it goes. $WTIC is in a long-term downtrend, so I am only interested in short setups. In late August, oil bottomed out at a multi-year low of $37.75 and rebounded to the $49 area. Since then, $WTIC has been consolidating with a triangle/pennant type of chart formation. My short signal was triggered on September 23rd, but for now no conclusive breakdown followed. It is possible that $WTIC will break out to the upside and retest resistance in the $51 area where the 200-day moving average currently resides. Alternatively, a close below $43 would surely cause a retest of multi-year lows. My money is on the latter.
Chart of $WTIC.
Chart of $WTIC.
That’s it for this week’s market recap,
Best Regards and have another great trading week!
** Special Announcement**
We are close (hopefully October 10th) to launching a stocks alert service. Please sign-up for our mailing list to be the first to take advantage of the discoun
ted membership once it becomes available!
Alexander Berger (www.MasterChartsTrading.com)


 RSS Feed