|
** Special Announcement** Trade Alerts Service is now live! Please sign-up for it here. A tough week for those playing the downside in the stock market. S&P 500 ($SPX, SPY) was up over 3% for the week on improving breath. Currently stocks are overbought and I still think $SPX is now in a long-term downtrend. If this is indeed the case, then we have a short setup in stocks right now. Chart of SPY |
|
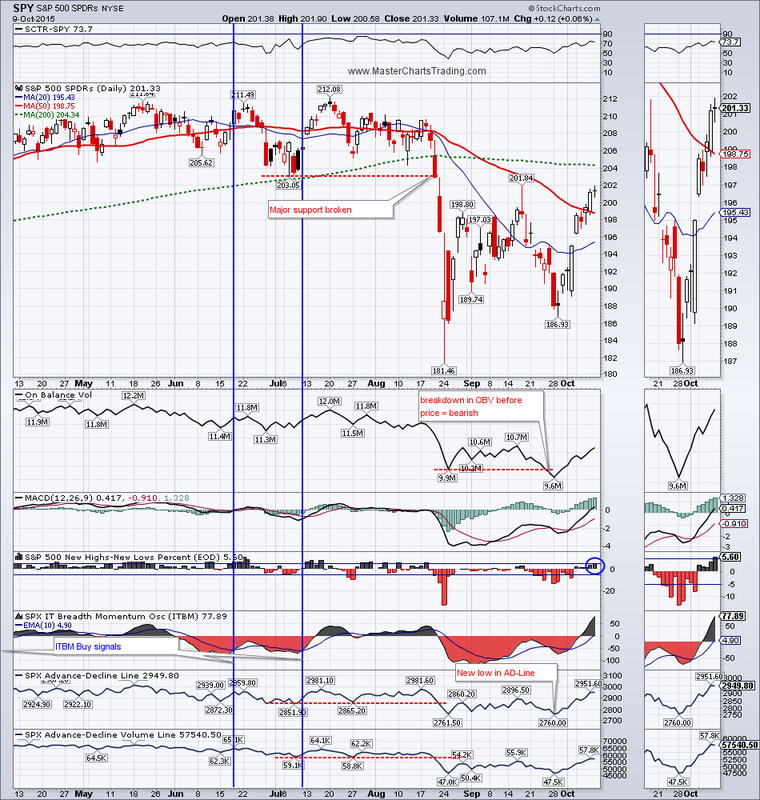
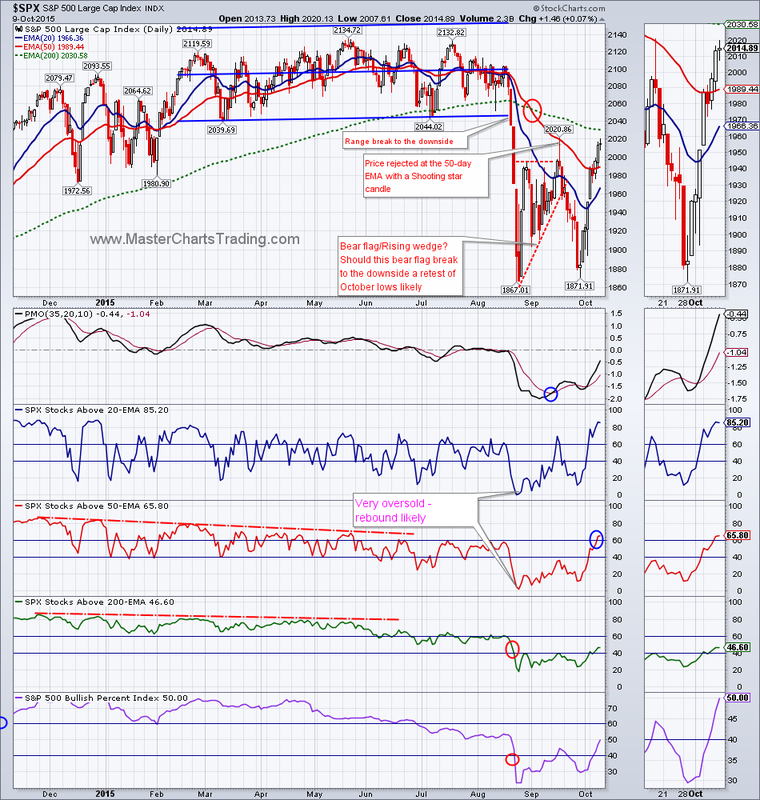
We are seeing incremental improvement in the market breadth. The AD-line and AD-volume lines for $SPX are now confirming higher highs relative to the mid-September highs. Also, we are seeing a decent number of new highs being set. Additionally, the percentage of stocks above the 50-day exponential moving average has climbed above the 60% mark. All of these are positive signs, but the longer-term trend and support breaks from August still dominate the chart patterns, so I am inclined to look for a short entry at this point of the game.
Chart of $SPX
Chart of $SPX
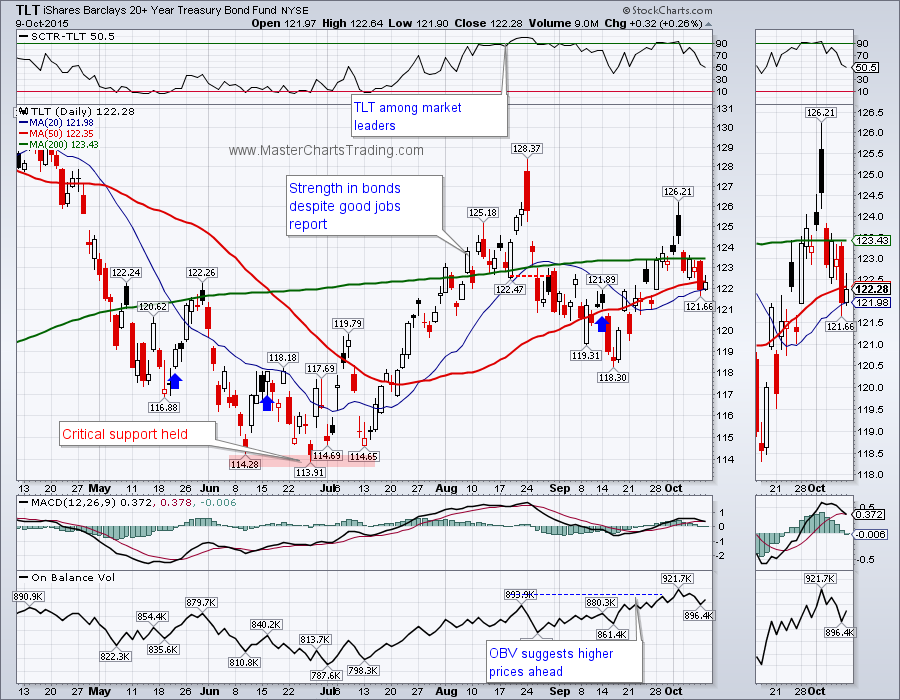
Not surprisingly, bonds (TLT) sold-off this week after coming close to challenging its mid-August highs. Bonds are still in a bull-market, so this pullback is a normal part of market action. Should stocks come under pressure, bonds are very likely to benefit. The On-Balance Volume (OBV) indicator for TLT broke out above its August highs, while the price has not yet done so. This is suggesting that the market participants are accumulating bonds.
Chart of TLT
Chart of TLT
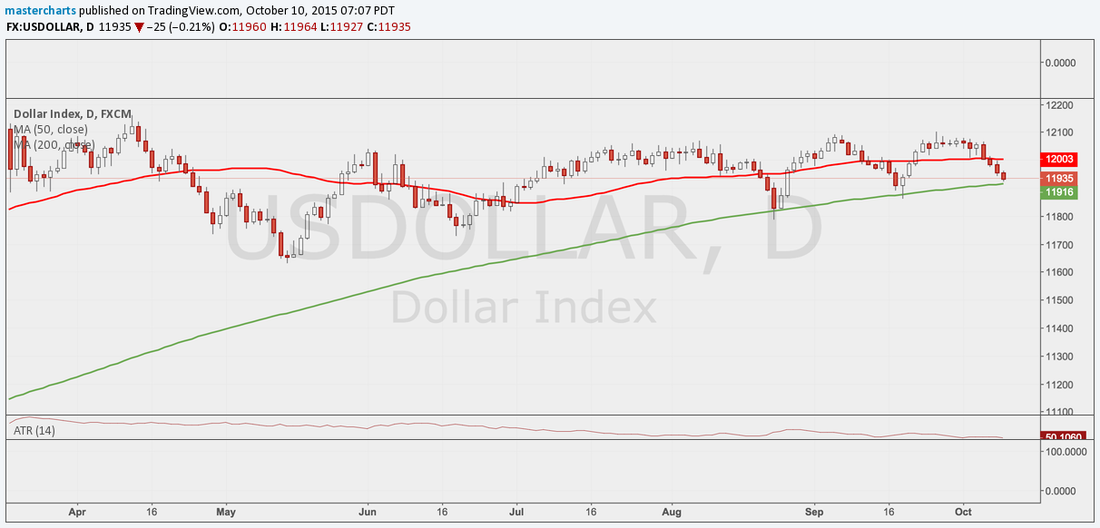
Selling in the dollar is contributing to a rebound in various commodities. It should be noted, however, that the dollar remains in an uptrend and is not that far off from its 52-week highs. We could easily see a resumption of an uptrend in the dollar in which case commodities will come under pressure again.
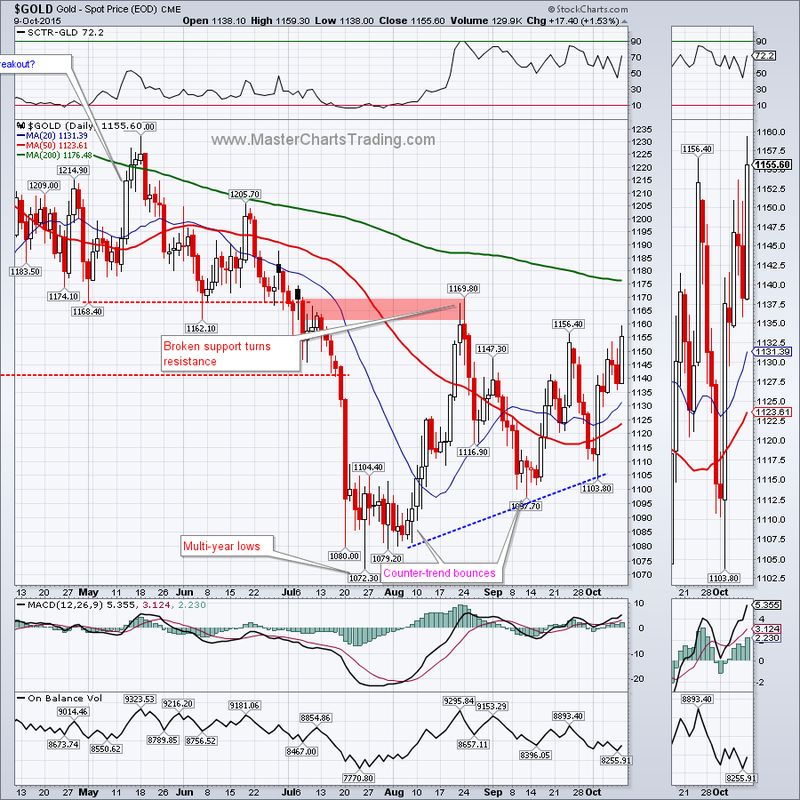
Gold is benefiting from the weaker dollar and has gained 1.58% this week. It is again at resistance, but is now overbought (along with gold miners). It is still possible that gold could rally to the $1175 area where the 200-day moving average currently is. But there are lots and lots of resistance there. Long-term gold is bearish, so I think we now have a short setup.
Chart of gold
Chart of gold
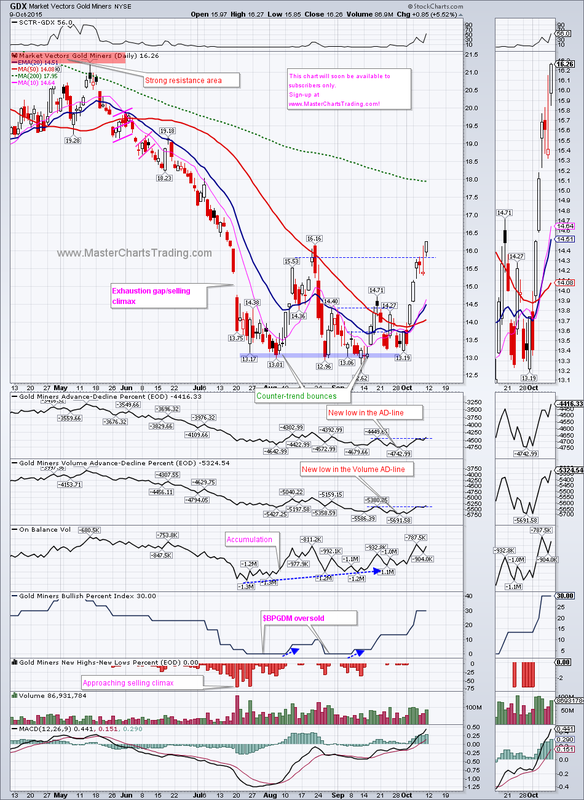
Gold miners (GDX) are clearly overbought after about a 23% move. Did I mention bear-market rallies could be powerful? Could we run further up? Gold bulls will mention that:
Chart of GDX
- GDX broke out above mid-August highs
- On-Balance volume is showing a bullish divergence going all the way back to July
- The Bullish percent index ($BPGDM) is currently at 30% after it bottomed out at zero a few weeks ago. Back in the beginning of the year $BPGDM topped out at 50%, so we have some room to run to the upside
- GDX is long-term bearish, so overbought readings (like right now should be shorted
- Advance-Decline (AD) and AD-Volume lines did not brake out above mid-August highs while price did – this is a bearish divergence
Chart of GDX
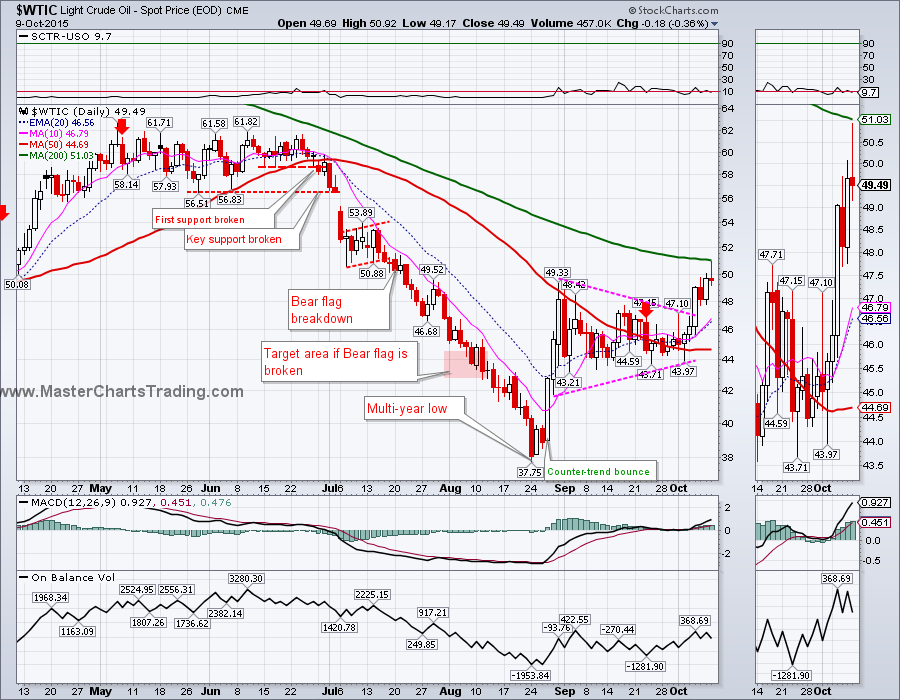
Oil was the clear winner this week as it gained over 8%. Is this a true breakout? On Friday oil almost touched the downward sloping 200-day moving average and pulled back sharply. This formed a shooting star candlestick – a sign of reversal. I opened a half-sized position in SCO to play oil on the downside a few weeks back. For now my stop has not yet been hit, so I am keeping it open. Should we get any more upside, it will likely get closed out. Alternative scenario is for the dollar to strengthen again and for commodities of all sorts to come under pressure again.
Chart of $WTIC Oil
Chart of $WTIC Oil
That’s it for this week’s market recap,
Best Regards and have another great trading week!
Alexander Berger (www.MasterChartsTrading.com)
Best Regards and have another great trading week!
Alexander Berger (www.MasterChartsTrading.com)


 RSS Feed