|
Watch this week's video here https://youtu.be/jgoa2WxhScI
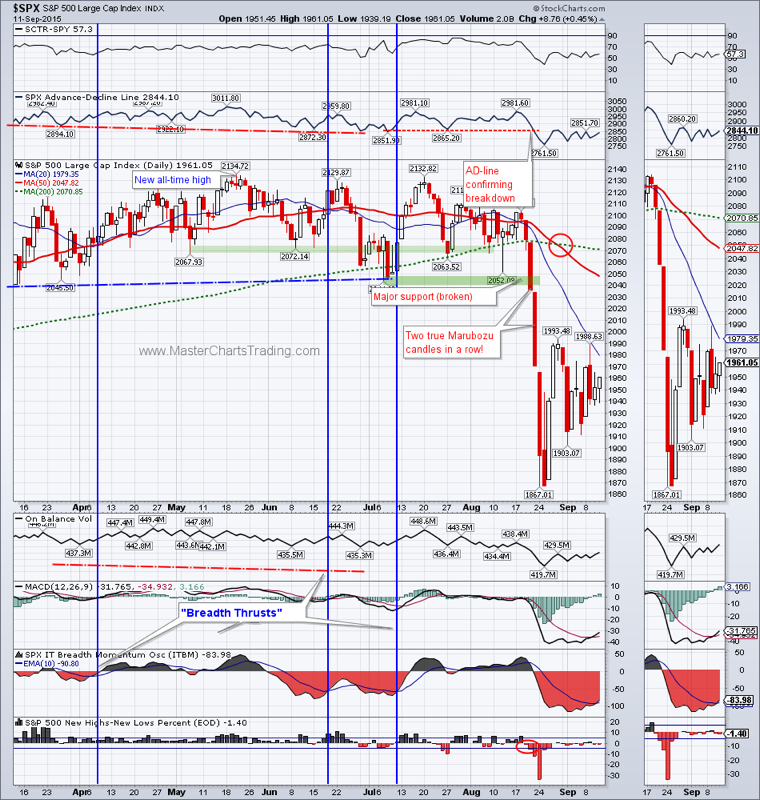
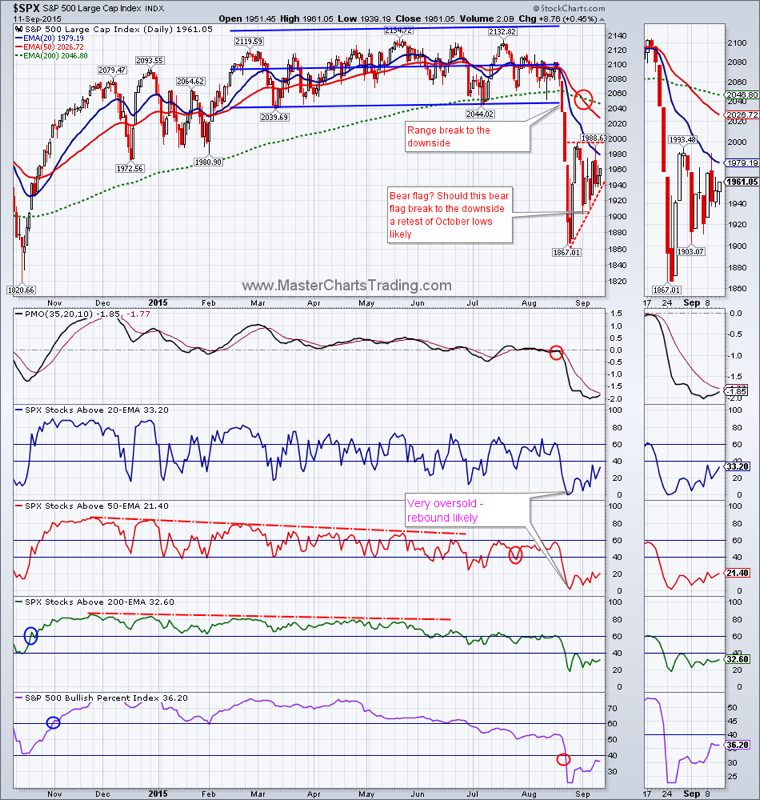
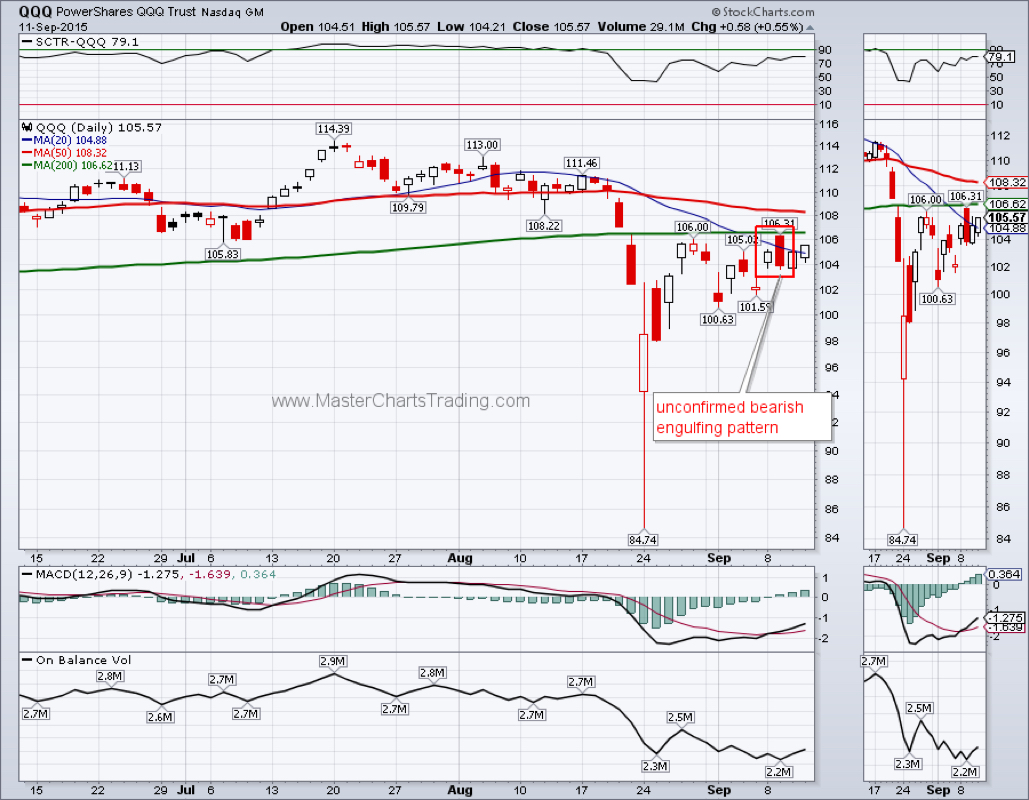
Not much has changed in the markets from the newsletter and video published 2 weeks ago. $SPX attempted to rally on Wednesday, but was turned back decisively by the bears at the 20-day moving average (MA). If we look on the chart of $SPX, one could argue that a Bear Flag of sorts is being traced out. Should this Bear Flag break down, a re-test of October lows is almost certainly possible. Bearish evidence continues to mount: the 50-day MA is now below the 200-day MA on the charts of $SPX, $COMPQ and $NYA. Pretty much every single market breadth indicator I follow is in the bearish territory. Of the major stock indices, QQQ is one of the few holdouts, since its 50-day is still above the 200-day. Charts of major indices here |
|
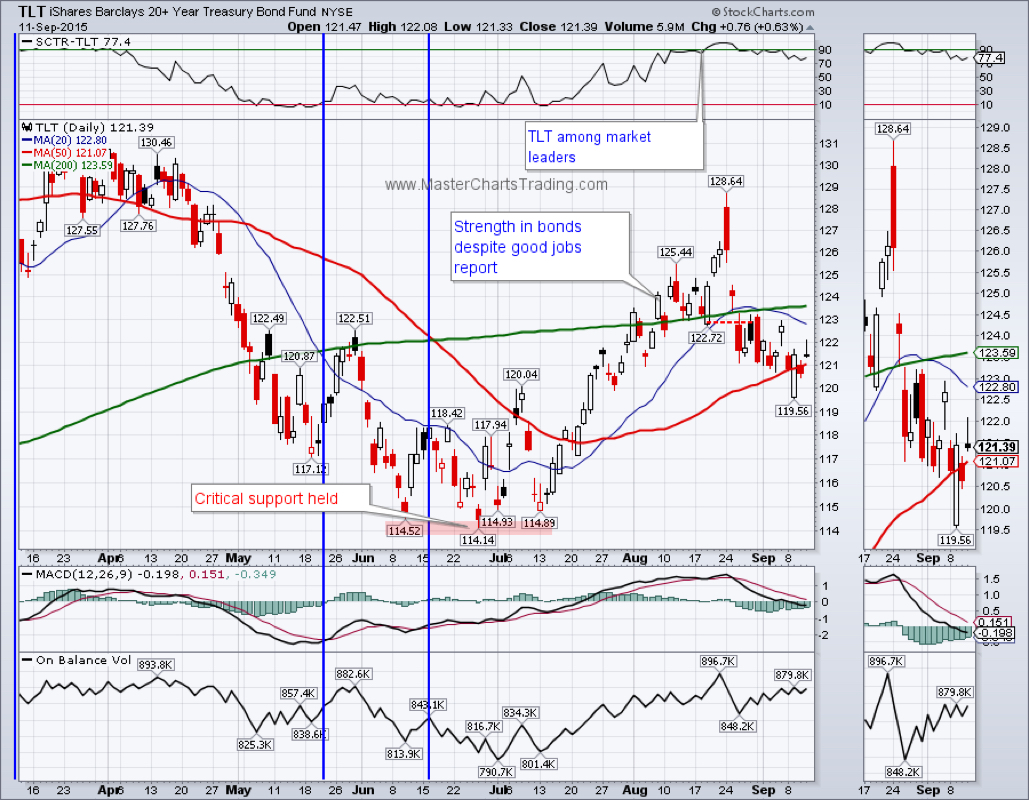
Bonds (TLT) corrected rather sharply from their recent peak at 128.64. I continue to think that TLT is in a long-term uptrend, so this pullback may be viewed as a buying opportunity. Right now TLT is sufficiently oversold for my tastes to go long again.
TLT chart here
TLT chart here
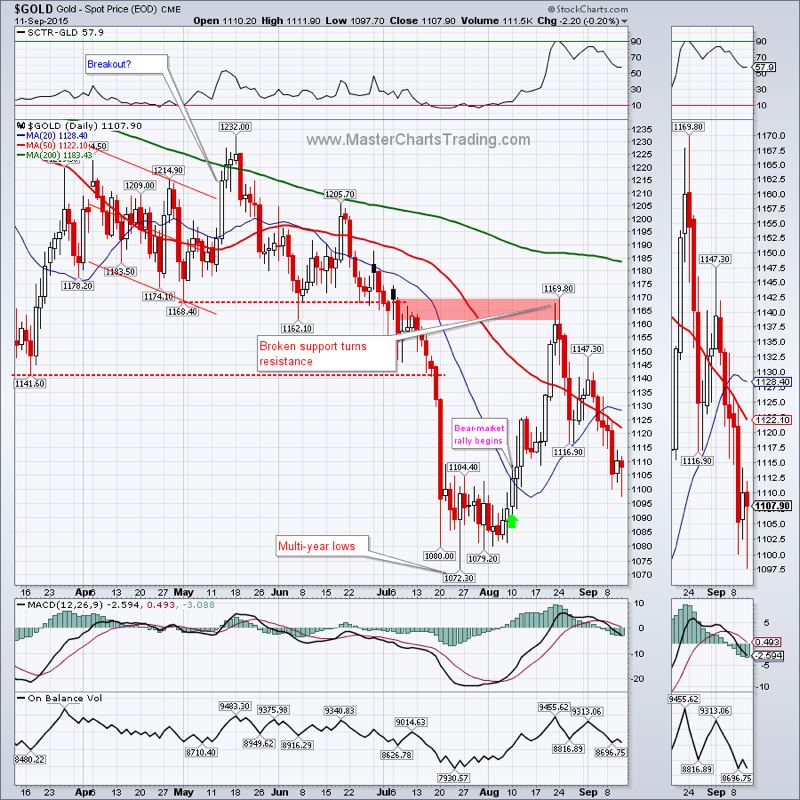
Gold came under selling pressure again this week. A bear-market rally that started in mid-August ran into resistance around $1165. This week there was a minor support break in the $1115 area. At this point of the game I am not yet comfortable shorting again, but if gold manages to rally back to the $1165 area, I will reconsider.
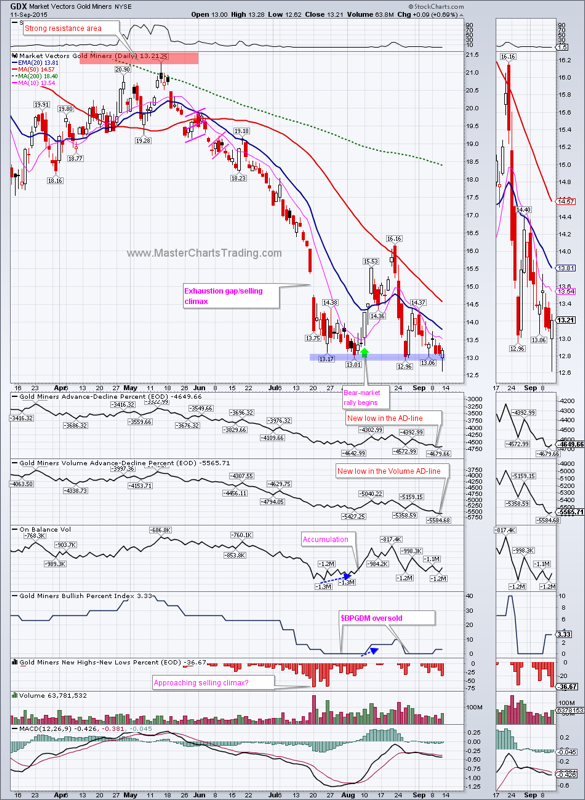
GDX fared much worse then gold itself. In late August GDX failed to close above the 50-day moving average and collapsed back down to support at around $13. Back in late August I mentioned that, as with gold, I was not yet ready to short and wanted to see more upside. This may not happen, especially if Monday GDX falls through the support at $13. For now, I am keeping an open mind about a possibility of a rally in GDX. Market breadth for GDX hit new lows on Thursday as AD-Lines broke through prior support levels.
Gold charts here
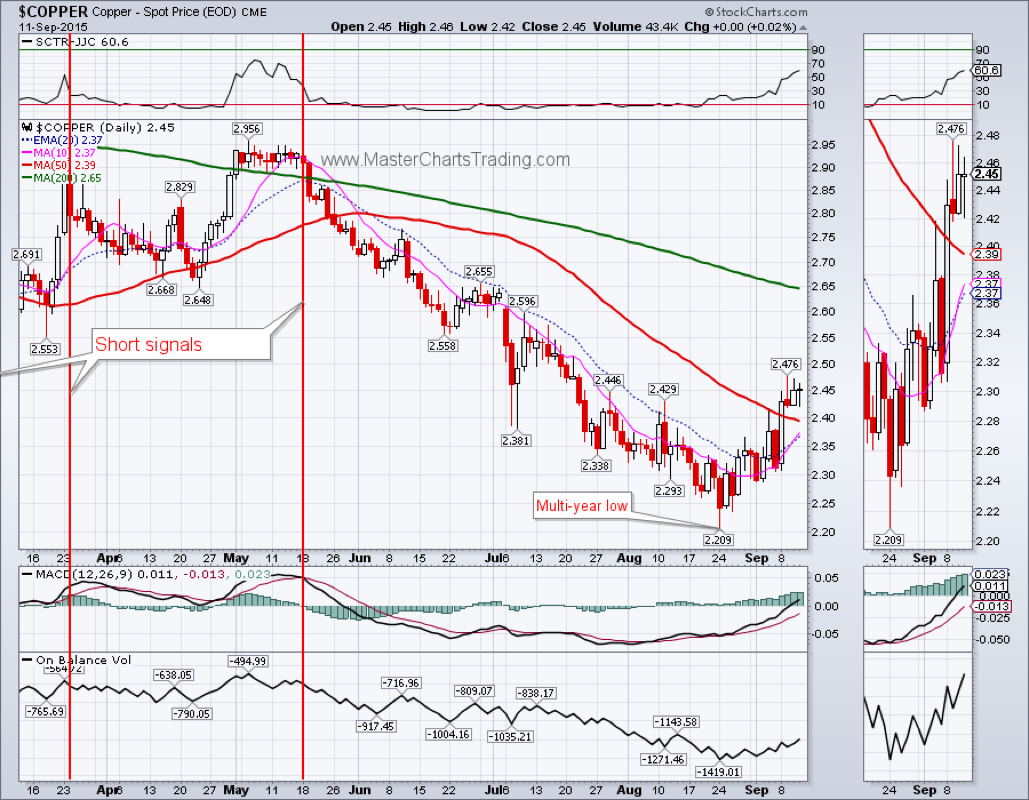
One other commodity that caught my attention was copper. $COPPER hit a multi-year low in late August and bounce. It is now trading above its 50-day moving average for the 4thday in a row. Its MACD has turned positive – a sure sign of it being overbought and might not be a bad place to short again. You can short copper by shorting the copper ETF called JJC (unfortunately no inverse ETFs for copper are available).
Chart of copper
Chart of copper
That’s it for this week’s market recap,
Best Regards and have another great trading week!
** Special Announcement**
We are close (hopefully October 1st) to launching a stocks alert service. Please sign-up for our mailing list to be the first to take advantage of the discounted membership once it becomes available!
Alexander Berger (www.MasterChartsTrading.com)


 RSS Feed