|
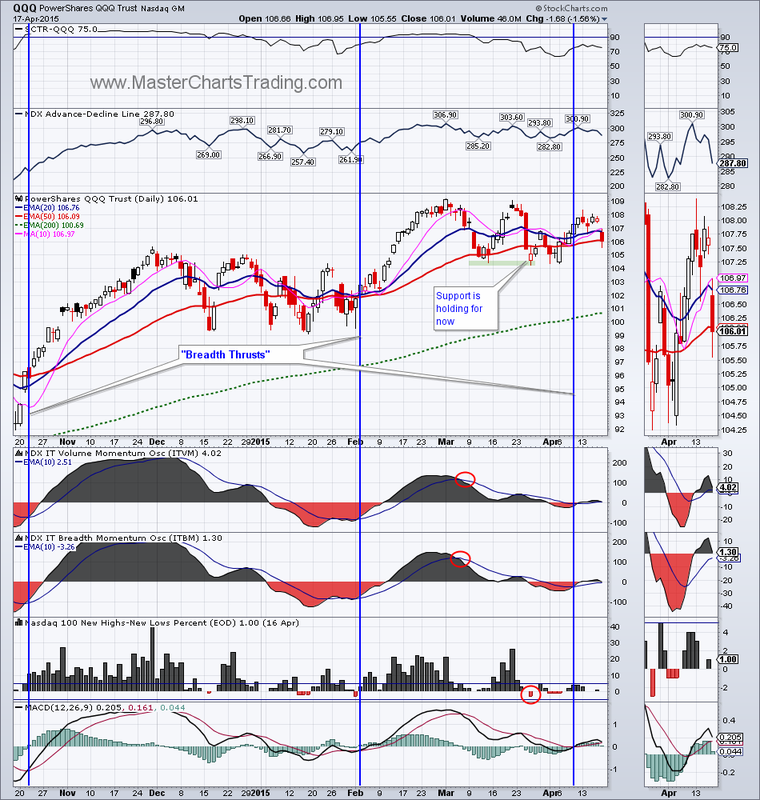
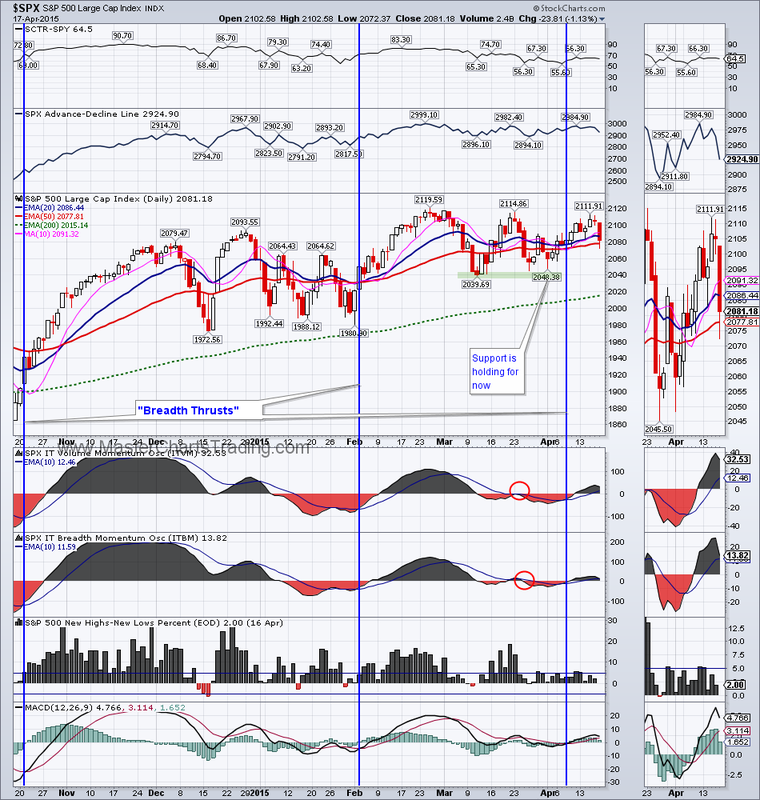
It was a rather uneventful week until Friday. Stocks meandered Monday through Thursday then sank on Friday. All major indices and most sectors were down for the week. In the bigger context of the uptrends in stocks, this week probably won’t matter that much. Just more chopping around without a clear breakout or a breakdown. QQQ and the Technology ETF – XLK were the leaders to the downside this week. XLK actually generated a sell signal less then a week after generating a buy signal. Charts of $SPX and QQQ here
|
|

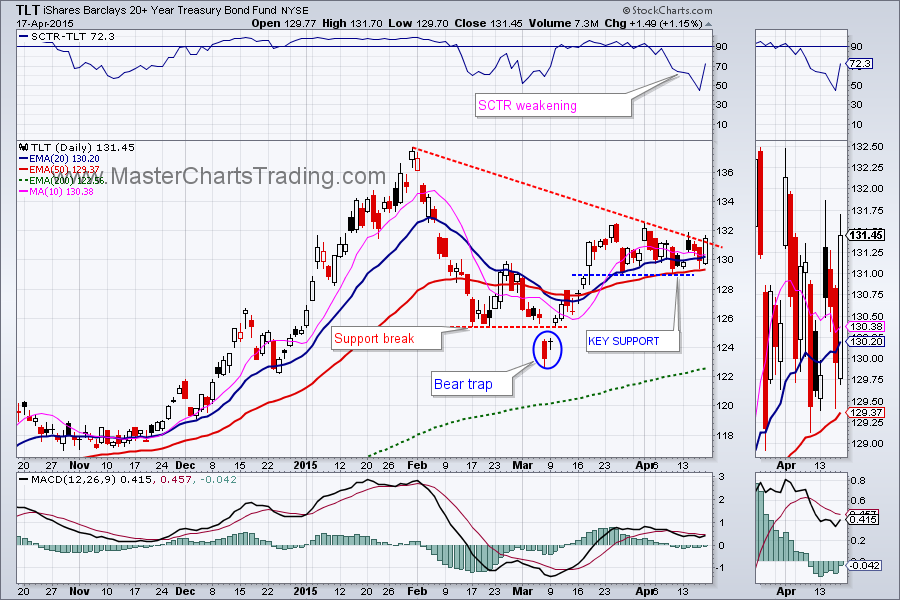
Bonds were the recipients of some scared money inflows. TLT gained 1.4% this week and held support in the $129 area. We still have a part of our position in TLT open.
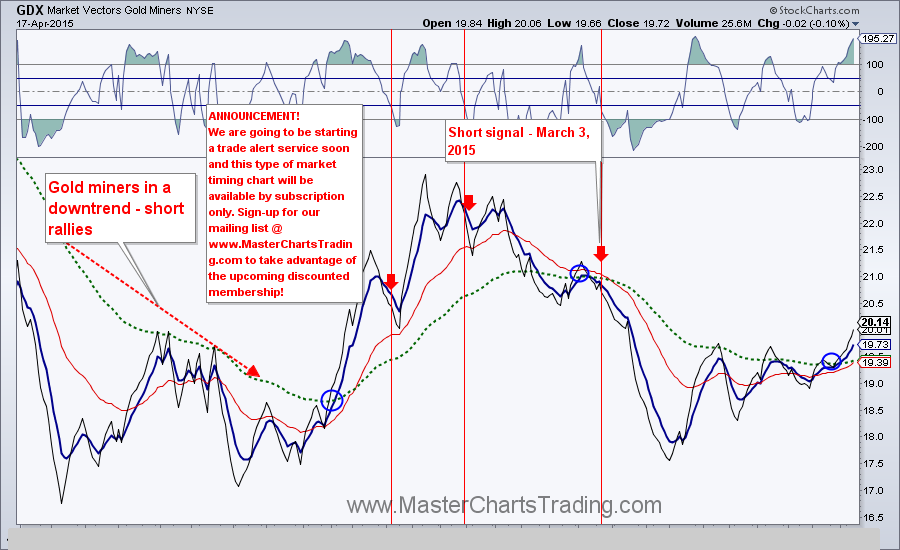
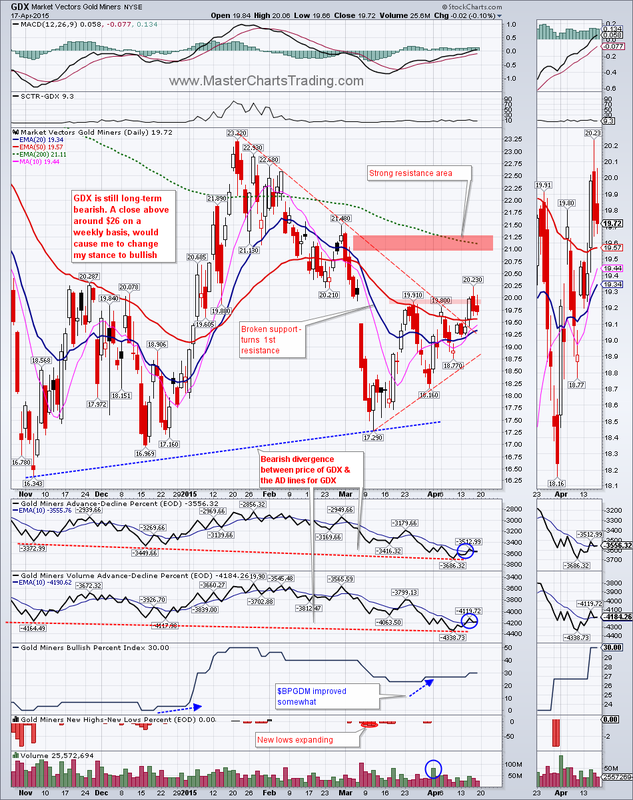
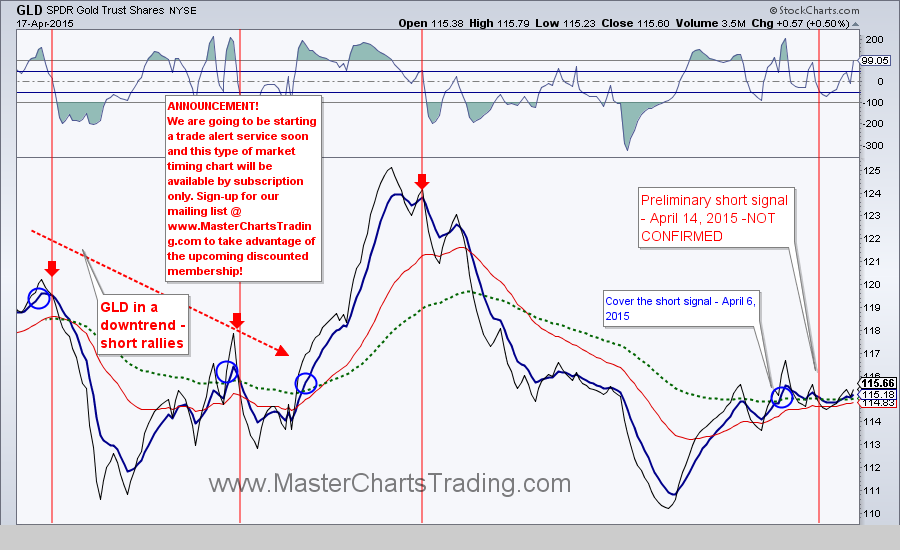
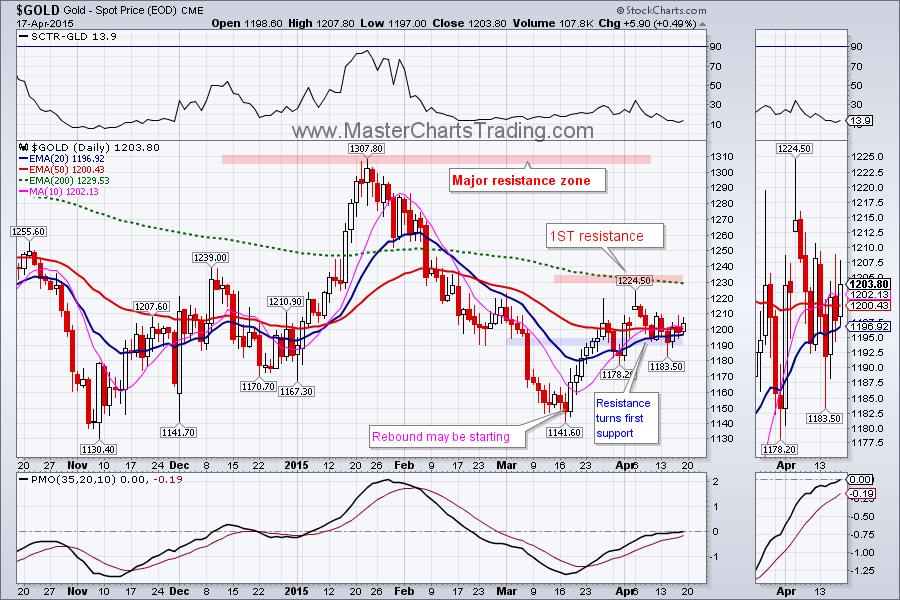
Gold wanted to break down on Tuesday and a short signal was generated for GLD, but not confirmed by the gold miners. I like to have a confirmation on both the commodity and the stocks that deal with this commodity. Gold is still bearish long-term, so for now I am waiting for a good set-up to go short again. Both GDX and GLD are now sufficiently overbought for me to be comfortable going short.
GDX did manage to close above the 50-day exponential moving average (EMA) and held support at around 19.55. If you are a gold bull then the next step is to hope for GDX to push above the gap-down resistance from early March in the $20 area.
Gold and gold miners charts located here
GDX did manage to close above the 50-day exponential moving average (EMA) and held support at around 19.55. If you are a gold bull then the next step is to hope for GDX to push above the gap-down resistance from early March in the $20 area.
Gold and gold miners charts located here
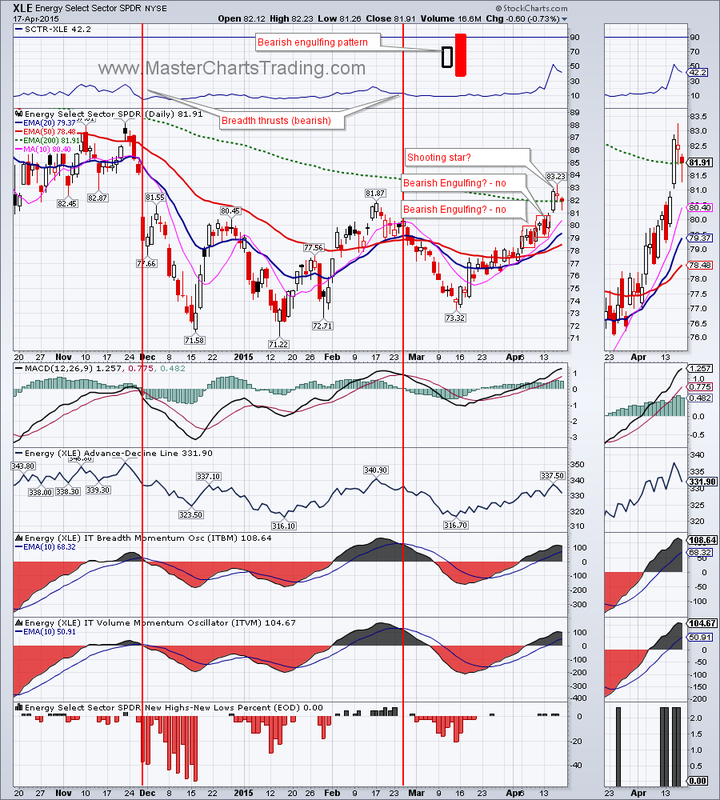
Energy related sectors and oil itself were the best performers this week. If you like me - bearish on energy and looking for a good setup in the Energy SPDR (XLE), then you must be careful not to read too much into individual daily candlesticks. Over the last 2 weeks XLE had no less then two Bearish Engulfing patterns that were never confirmed – it just kept negating them with a push higher next day. Finally on Wednesday XLE closed above the 200-day EMA – a good sign for the bulls. XLE now must hold above the 200-day to make a longer-term turnaround.
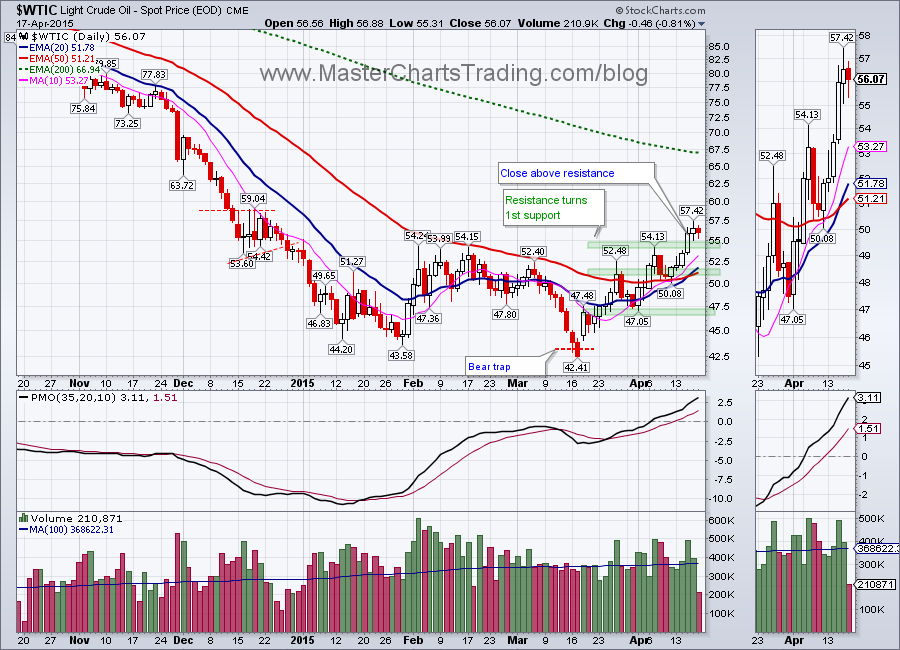
No doubt XLE’s stellar run was due to a strong rebound in oil. West Texas Intermediate ($WTIC) gained over 30% since its low in mid-March. On Wednesday $WTIC closed above the resistance levels dating back to February. Again, oil is long-term bearish and already may be overbought at these levels. I am waiting for a good set-up to short both oil and XLE.
No doubt XLE’s stellar run was due to a strong rebound in oil. West Texas Intermediate ($WTIC) gained over 30% since its low in mid-March. On Wednesday $WTIC closed above the resistance levels dating back to February. Again, oil is long-term bearish and already may be overbought at these levels. I am waiting for a good set-up to short both oil and XLE.
That’s it for this week’s market recap,
Best Regards and have another great trading week!
** Special Announcement**
We are weeks away from launching a stocks alert service. Please sign-up for our mailing list to be the first to take advantage of the discounted membership!
Alexander Berger (www.MasterChartsTrading.com)
Disclaimer, we have:
Open positions: SPY, LULU, TLT
New position:
Closed position:


 RSS Feed