|
Friday, April 24, 2015 Weekly Market Recap.
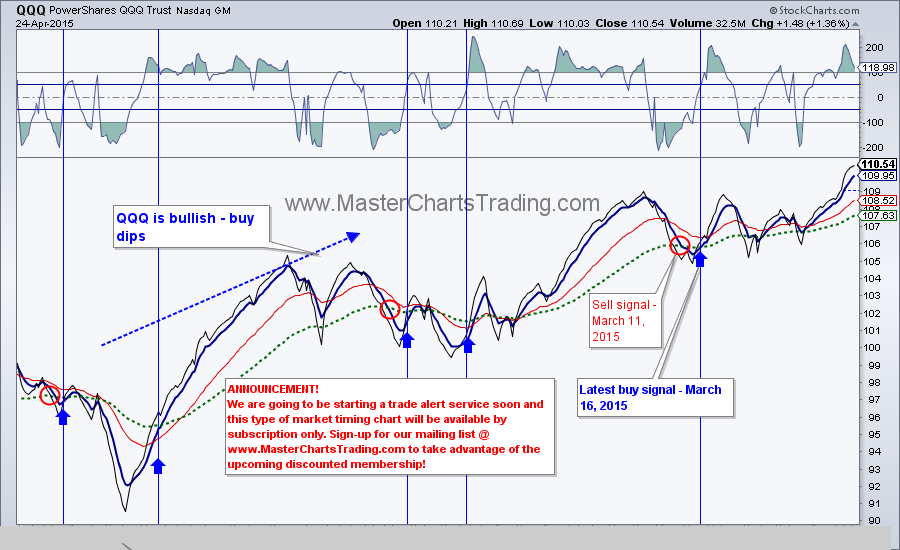
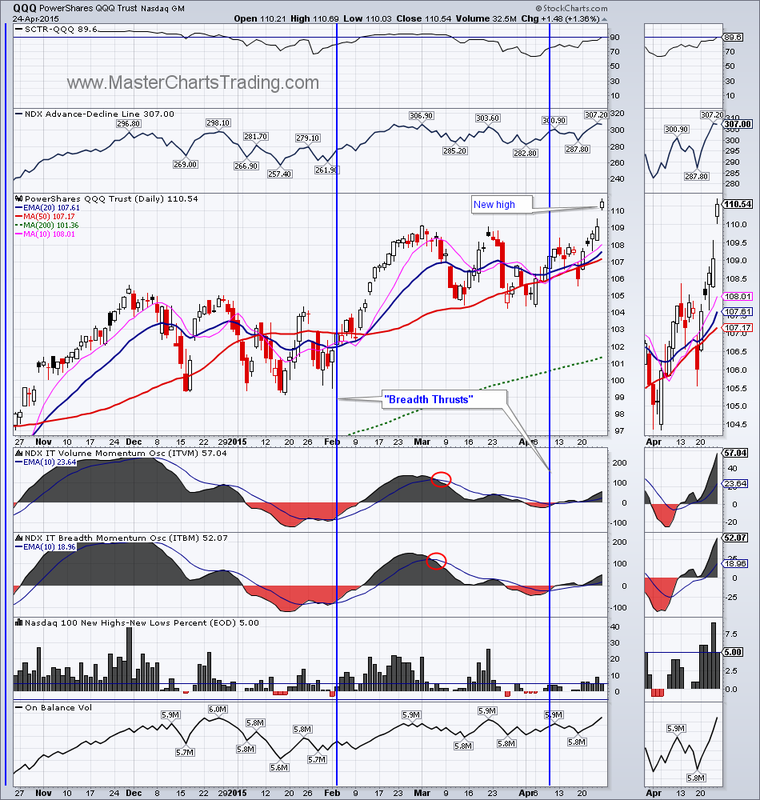
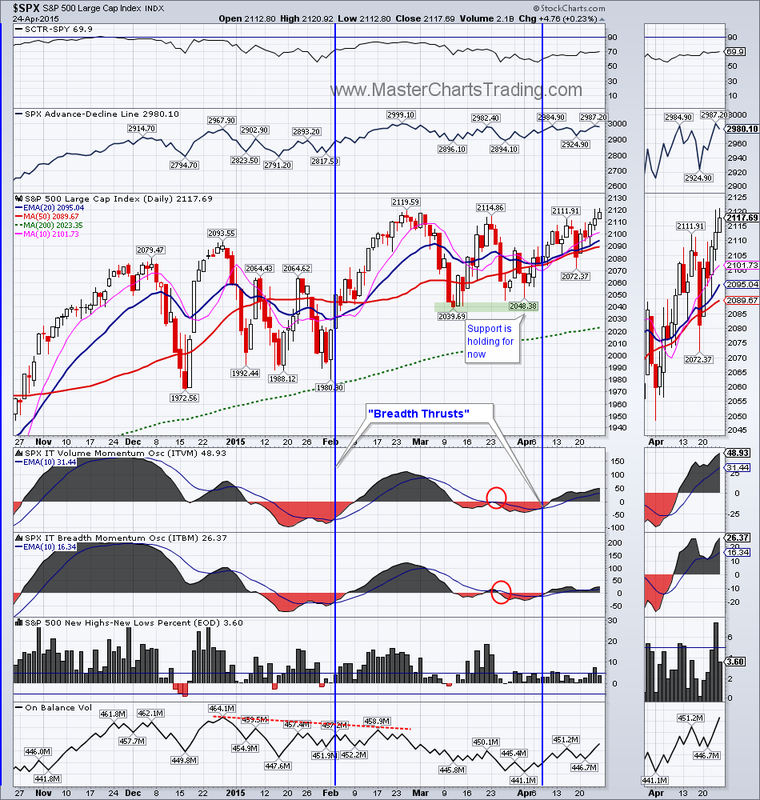
Major indices hit new 52-week highs this week on the heels of strong earnings, especially in the tech sector. QQQ gapped up on Friday and continued higher – a sure sign of strength. There is broad strength within the stock markets. Breadth indicators such as the AD Lines, New-Highs New-Lows indices and Breadth Momentum Oscillators are confirming the new highs. Charts of SPX and QQQ here. |
|
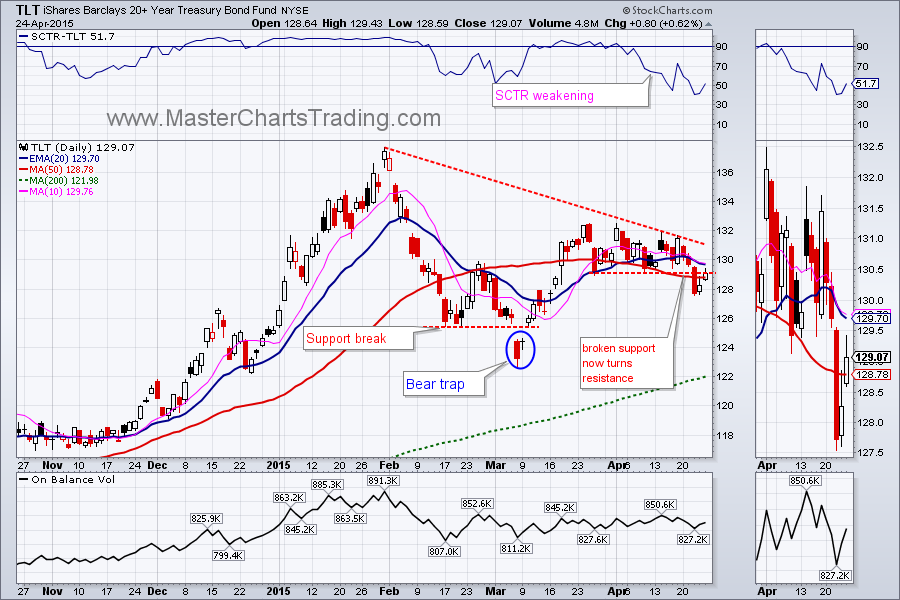
Bonds (TLT) broke support on Wednesday with a close below the 50-day moving average. TLT rebounded since, but there is now resistance in the $129 area. Should this resistance hold, we may see TLT correct further, possibly all the way down to around $123. Bonds are still bullish long-term, but are now relatively weak and there are better places to put your money to work.
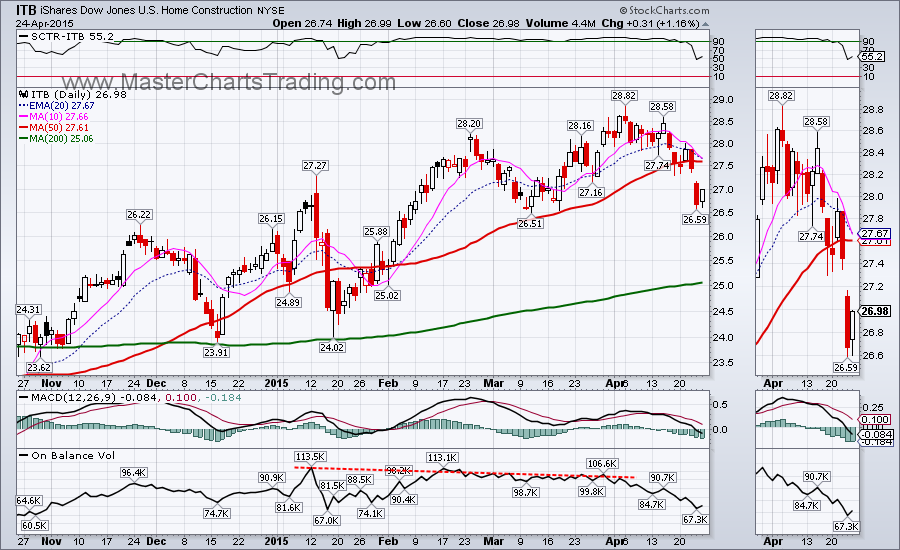
Interest rate-sensitive Home Construction ETF - ITB corrected steeply following the drop in bond prices. ITB has been one of the market leaders, but is now relatively underperforming along with bonds.
Interest rate-sensitive Home Construction ETF - ITB corrected steeply following the drop in bond prices. ITB has been one of the market leaders, but is now relatively underperforming along with bonds.
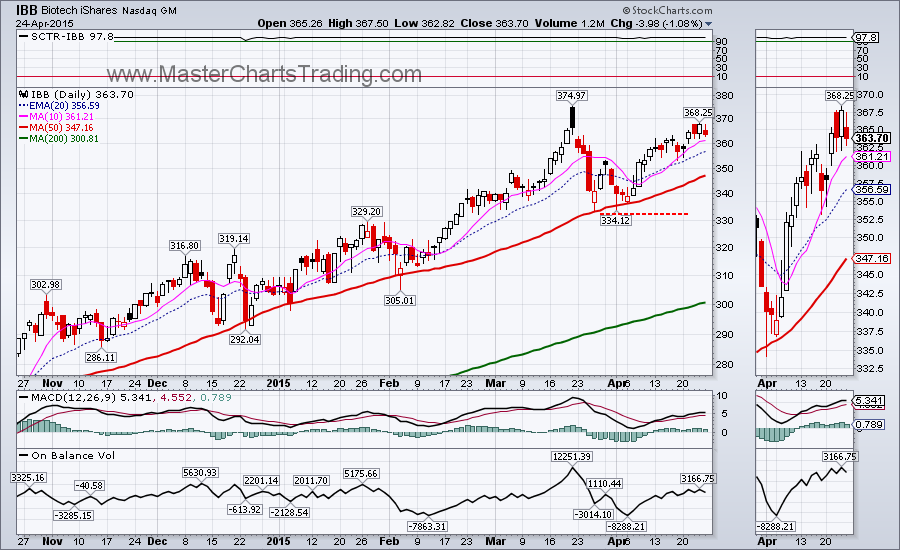
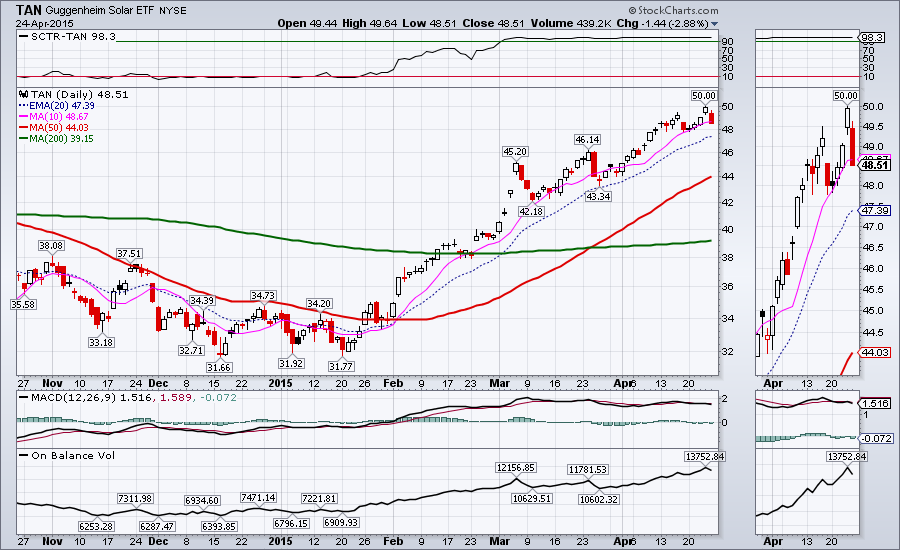
Some examples of better places then bonds to invest are: Chinese stocks (ASHR), solar stocks (TAN) and biotech (IBB). All these funds remain in steep uptrends and any meaningful pullback would likely be bought. ASHR, TAN and IBB are overbought and I would be waiting for a pullback to initiate any new longs in them.
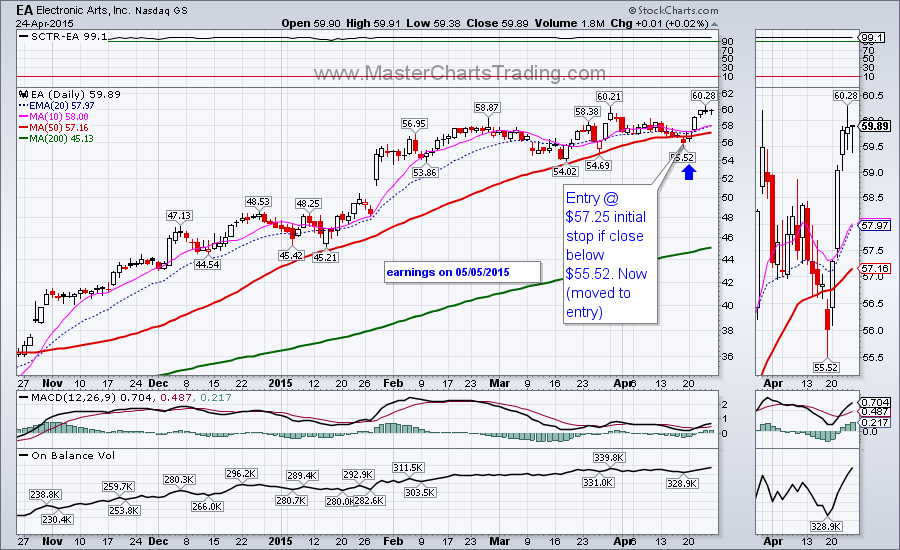
We opened a speculative position in one of the momentum names –Electronic Arts (EA) several days ago. So far the trade is working in our favor and EA hit a new high yesterday. EA reports on May 5th and we plan on at least booking profits by then – no need to risk a disappointing report.
We opened a speculative position in one of the momentum names –Electronic Arts (EA) several days ago. So far the trade is working in our favor and EA hit a new high yesterday. EA reports on May 5th and we plan on at least booking profits by then – no need to risk a disappointing report.

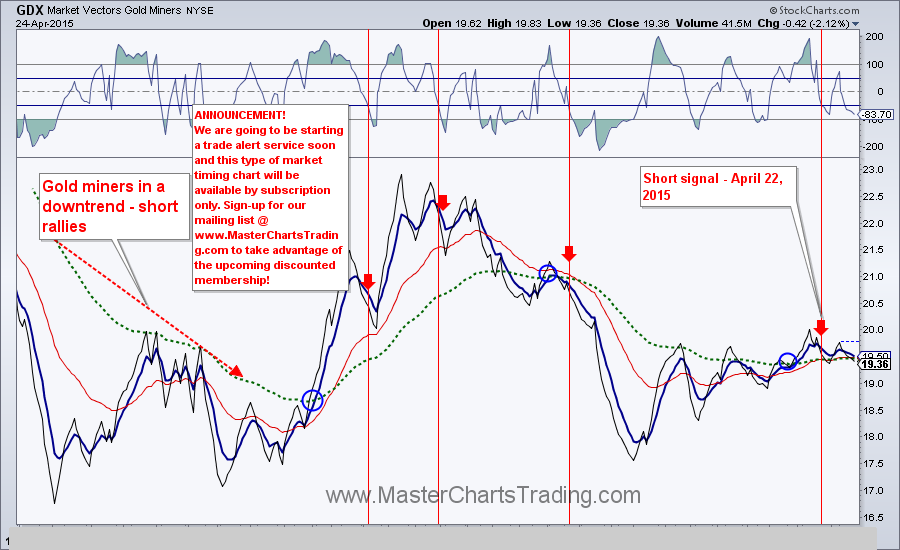
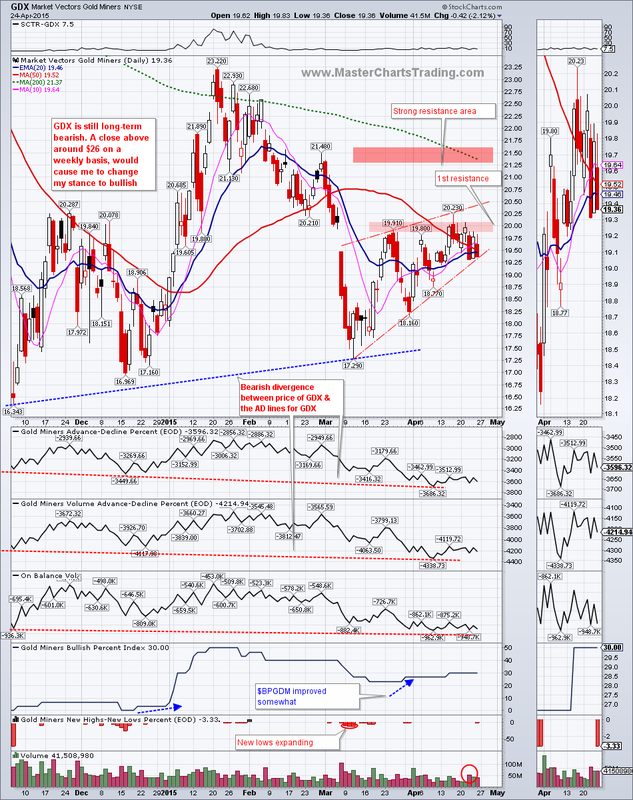
Our trading system generated a short signal on gold and gold miners on April 22. Then on Friday gold broke support and closed below April 14th low at $1179.90. Gold is in a bigger downtrend, so its no surprise to me that this bigger downtrend has pulled precedence over the counter-trend bounce that started in mid-March.
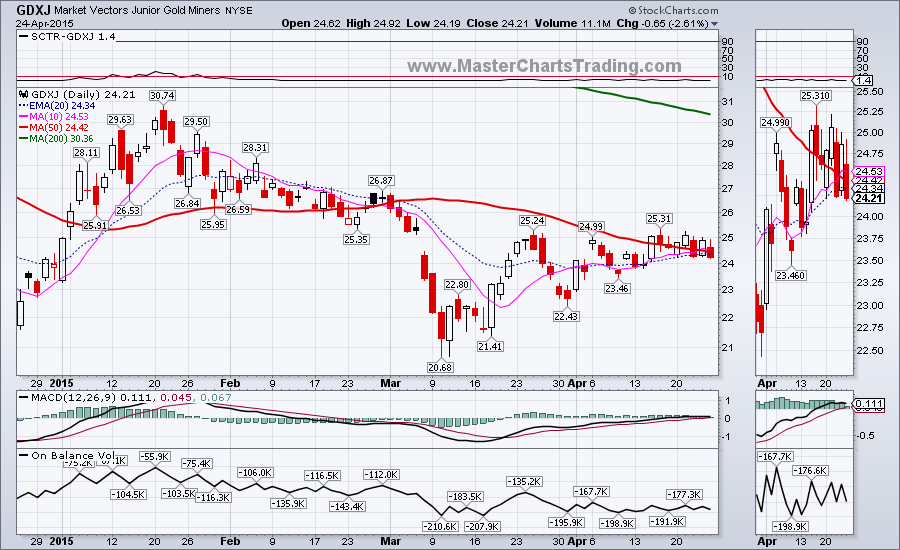
Gold miners (GDX) and especially the Junior Gold miners (GDXJ) followed gold lower. There is now a rising wedge chart pattern on the GDX chart. If this pattern is broken it could take GDX down to December lows (or lower). We opened a position in JDST (inverse 3x ETF of Junior Gold miners) to play this swing down in gold and gold miners.
Gold and miners charts are here


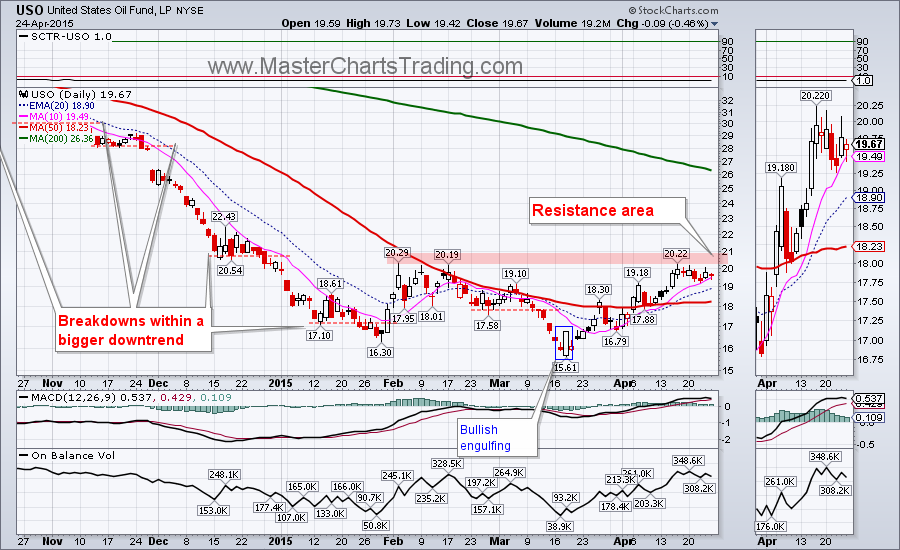
Oil (USO) ran into resistance in the $20 area and has been consolidating in a tight trading range for the past 2 weeks. USO is overbought after a 30% move from mid-March. A failure here would continue the bigger downtrend in oil and project a move to at least the $18 area, where the 50-day moving average currently resides. So far we did not get a short signal per our trading system yet, so we are staying out of the oil market.
In my one of my previous recent posts ( http://www.masterchartstrading.com/blog/short-signal-on-energy-xle1 ) I highlighted a short signal on the Energy fund – XLE. The bearish divergences within XLE continue and we may be getting a bearish breadth thrust shortly. Could the move in XLE precede the move in oil itself?
In my one of my previous recent posts ( http://www.masterchartstrading.com/blog/short-signal-on-energy-xle1 ) I highlighted a short signal on the Energy fund – XLE. The bearish divergences within XLE continue and we may be getting a bearish breadth thrust shortly. Could the move in XLE precede the move in oil itself?

That’s it for this week’s market recap,
Best Regards and have another great trading week!
** Special Announcement**
We are weeks away from launching a stocks alert service. Please sign-up for our mailing list to be the first to take advantage of the discounted membership!
Alexander Berger (www.MasterChartsTrading.com)
Disclaimer, we have:
Open positions: SPY, LULU
New position: EA, JDST
Closed position: TLT


 RSS Feed