|
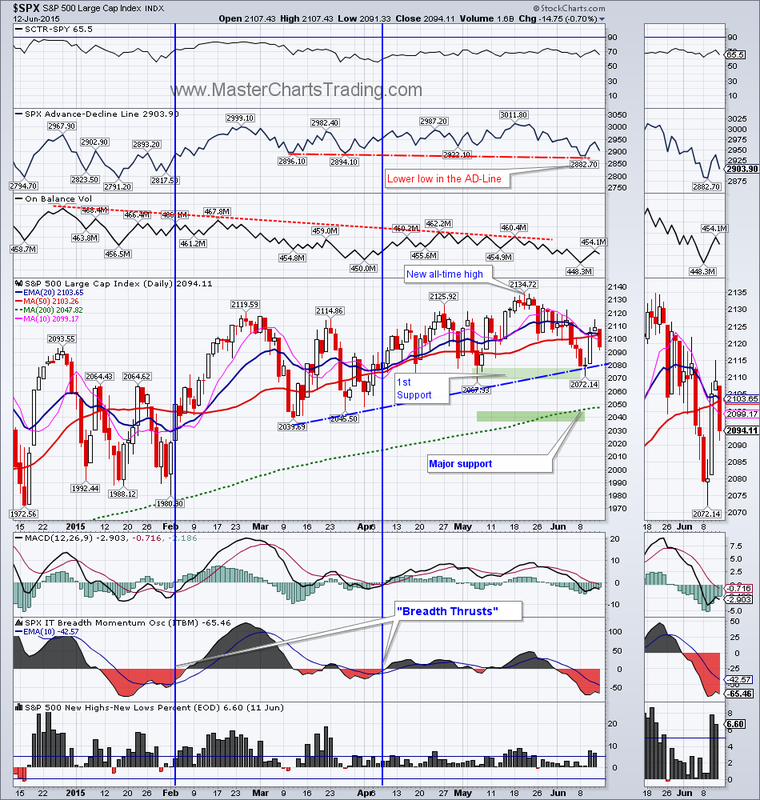
This week the S&P 500 and other major indices tested and held their first supports. $SPX is up a fraction of a percent. $SPX dropped below our stop-loss on Tuesday, but buying was already evident on Wednesday. By end of day on Wednesday $SPX printed a hammer-like candlestick. Next day a powerful rally confirmed that the support held for now. Charts of SPX, QQQ and IWM here
|
|
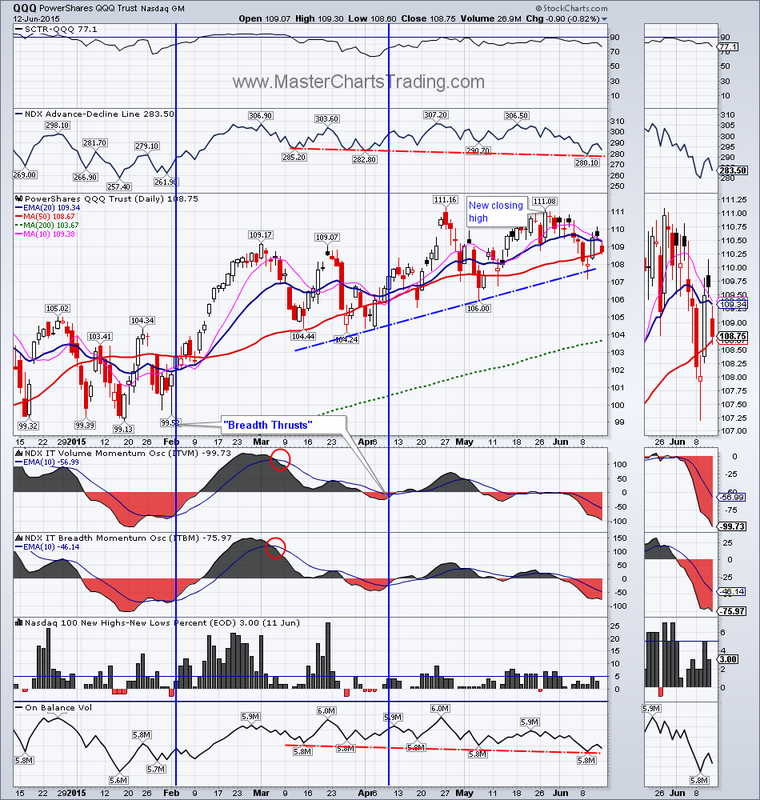
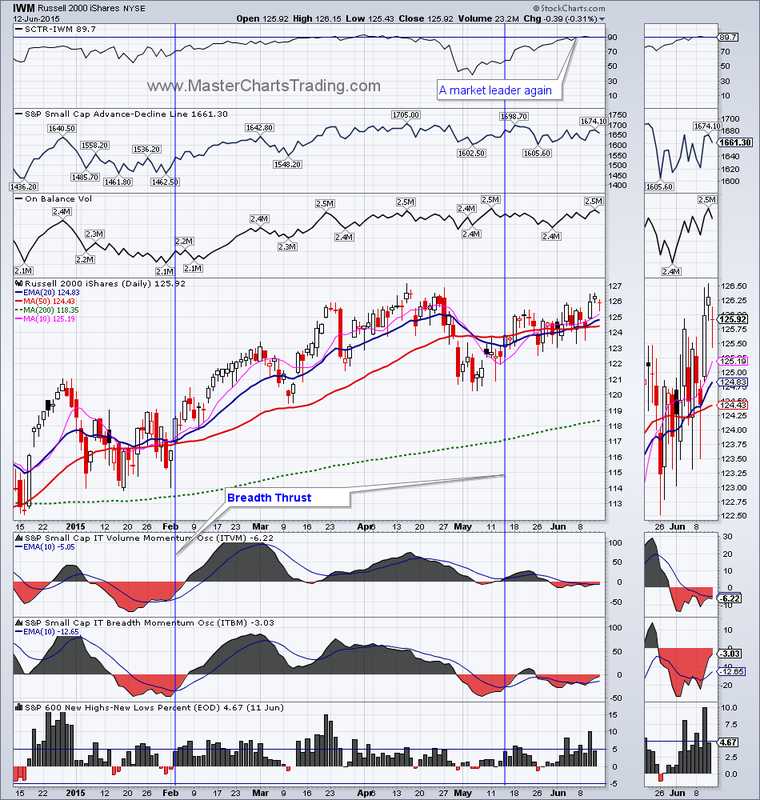
On the high-beta end, the QQQ truly never made it to our stop-loss on the closing basis. And IWM is well above its 50-day moving average - very close to new all-time highs.
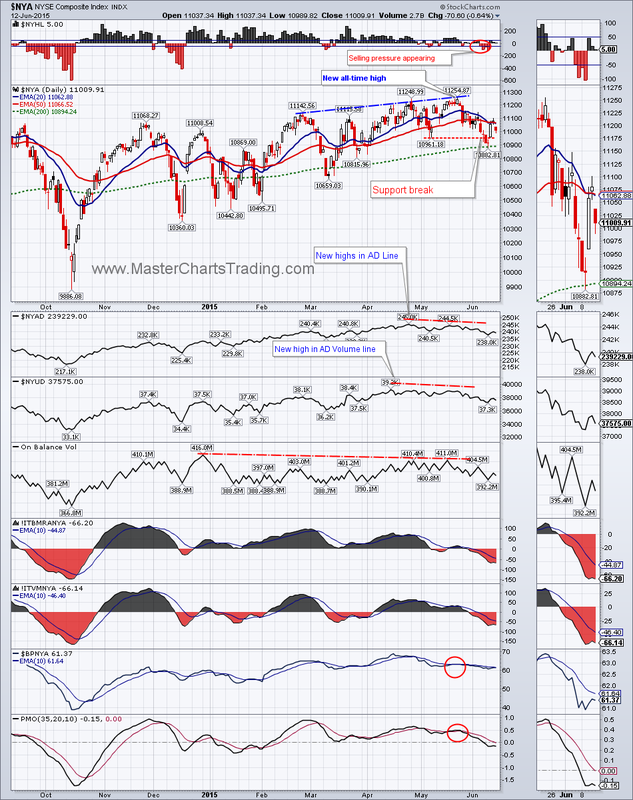
We may be seeing some weakness underneath the surface in the markets, however, especially in the large-cap universe. I highlighted the ongoing divergence in the On-Balance Volume for $SPX for past few weeks. Now we can add a divergence in the AD-Line for $SPX to the list of (mild) concerns. The AD-Line broke below the low from March 11 this Tuesday while the index itself made a higher low. Bearish divergences at all-time highs are generally not a good sign.
We may be seeing some weakness underneath the surface in the markets, however, especially in the large-cap universe. I highlighted the ongoing divergence in the On-Balance Volume for $SPX for past few weeks. Now we can add a divergence in the AD-Line for $SPX to the list of (mild) concerns. The AD-Line broke below the low from March 11 this Tuesday while the index itself made a higher low. Bearish divergences at all-time highs are generally not a good sign.
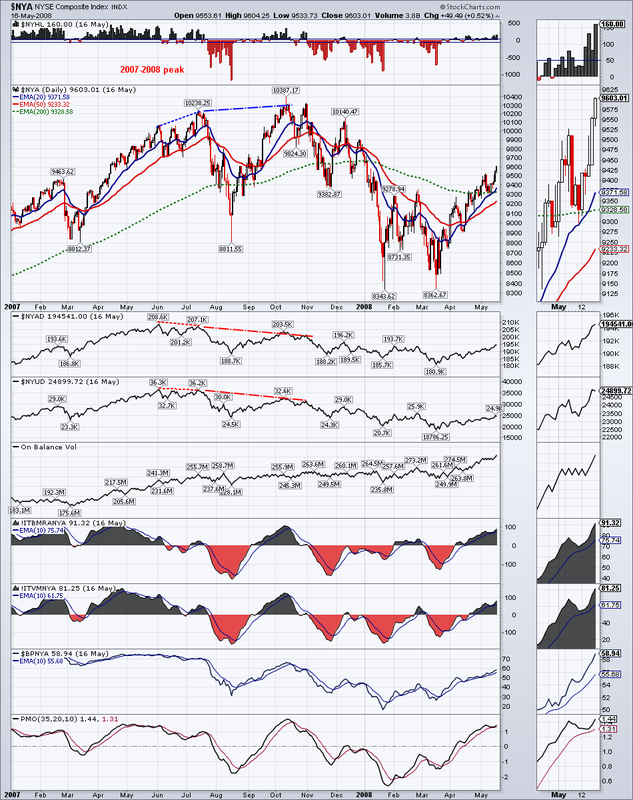
Similar divergences, albeit on a much larger scale, were present during the 2007-2008-market peak. Observe on the $NYA chart below that there was first a small divergence in the June-July of 2007 that lead to a deep market correction then followed by an equally impressive rebound to new highs. But at those new highs, the AD-Lines made an even lower peak then before. Then the market collapsed in January of 2008. Currently, the charts are showing nowhere near the same picture as in 2007/2008.
NYA chart here
NYA chart here
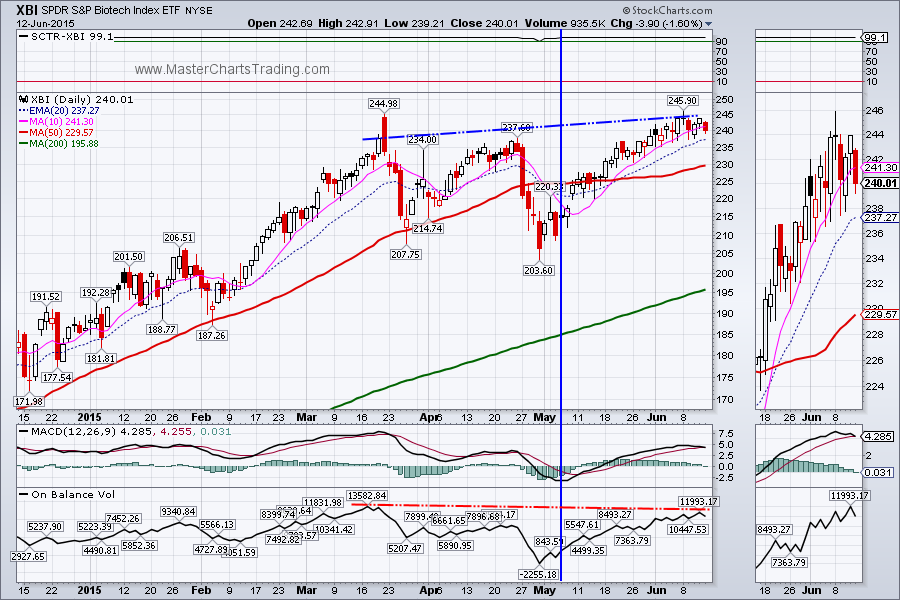
In the high-momentum universe, XBI – the biotech ETF hit an all-time high and pulled back slightly. The strength of this sector is undeniable, but the momentum is waning. MACD is getting ready to cross below its signal line and there is divergence in the On-Balance Volume. Our entry signal was back on May 6th with a 14% gain to peak. XBI chart
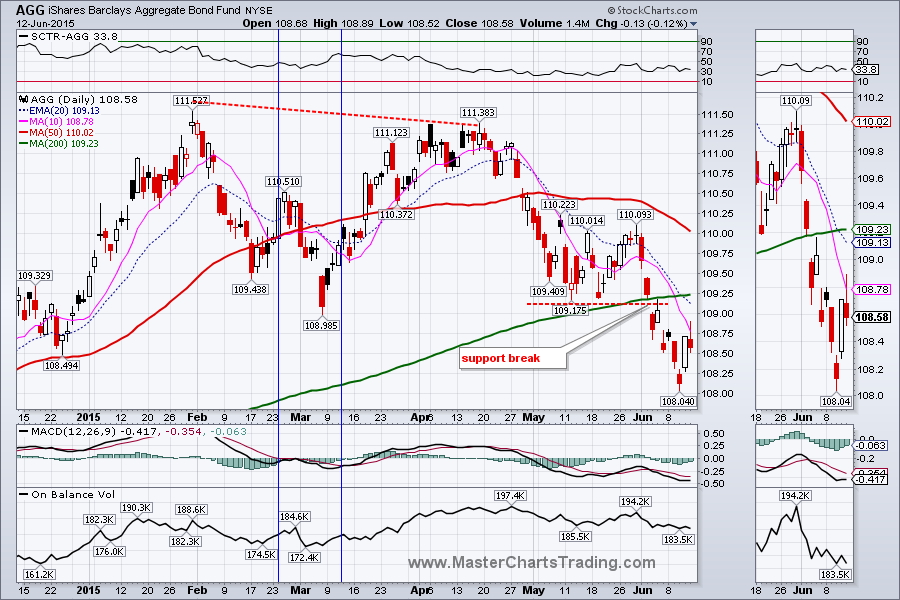
Bonds (AGG) had a strong rally on Thursday and I thought that if we get a good follow-through on Friday, this might be a decent time to prepare for potential summer volatility in stocks. But Friday ended on a decidedly sour note, as sellers came right back and pushed the price of AGG below its 10-day moving average. On the relative basis bonds are weaker then stocks, so I am staying out of the bond market for now.
AGG chart
AGG chart
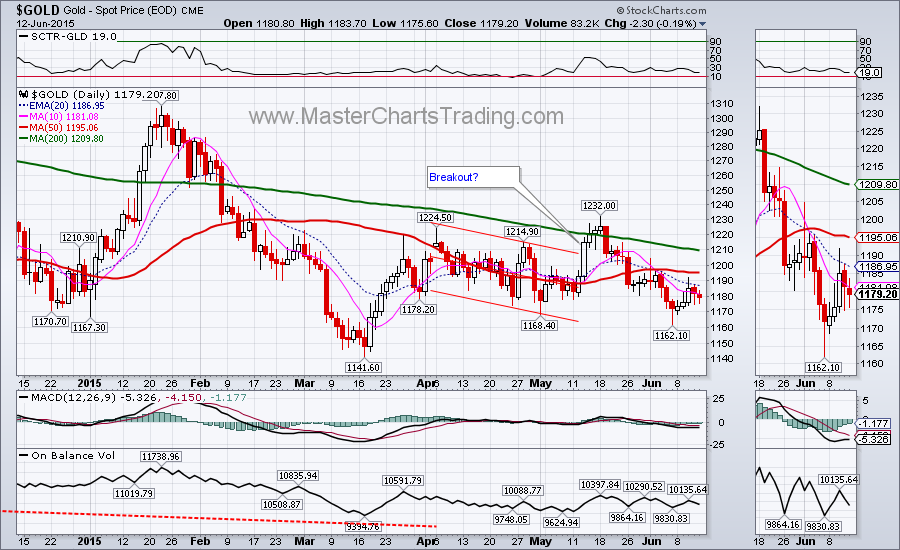
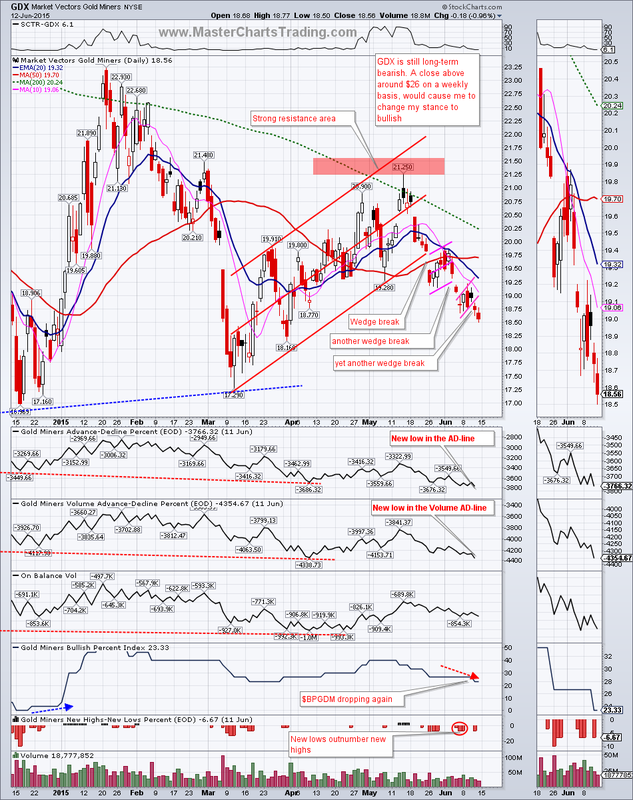
Gold is stuck in a trading range between the May and June lows at $1162 and its 50-day moving average currently at $1195. If gold could push to close above the 50-day moving average, a short-covering rally would likely ensue. My bias is negative for gold.
GDX, the gold miners ETF, is acting considerably weaker then gold. Could it be the leading indicator? GDX lost almost 1.5% for the week and broke yet another rising wedge formation on Thursday of this week. More telling, however is the fact that the Advance-Decline lines for GDX hit new lows on Friday, while GDX itself is still about 12% away from its 52-week lows set in November.
Gold charts here
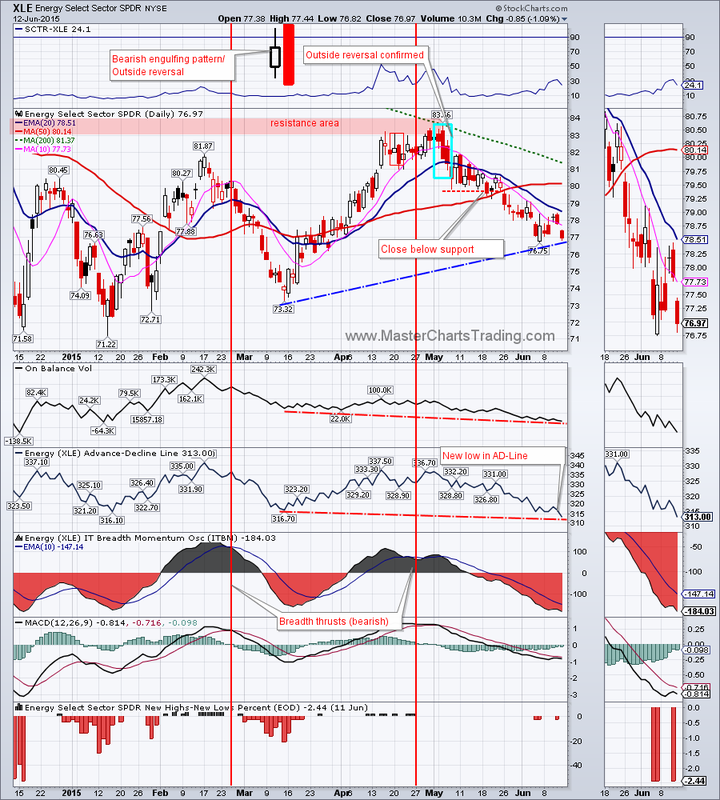
Oil may be finding it hard to get above the $61 mark and by extension the Energy ETF – XLE is finding it hard to find support. XLE is somewhat overextended to the downside after an over 8+ percent move from early May. Similarly to GDX, the Advance-Decline line for XLE hit a new low on Friday, yet the index itself is still well off its 52-week lows set in January. This is an encouraging sign … if you are short XLE.
XLE Chart here
XLE Chart here
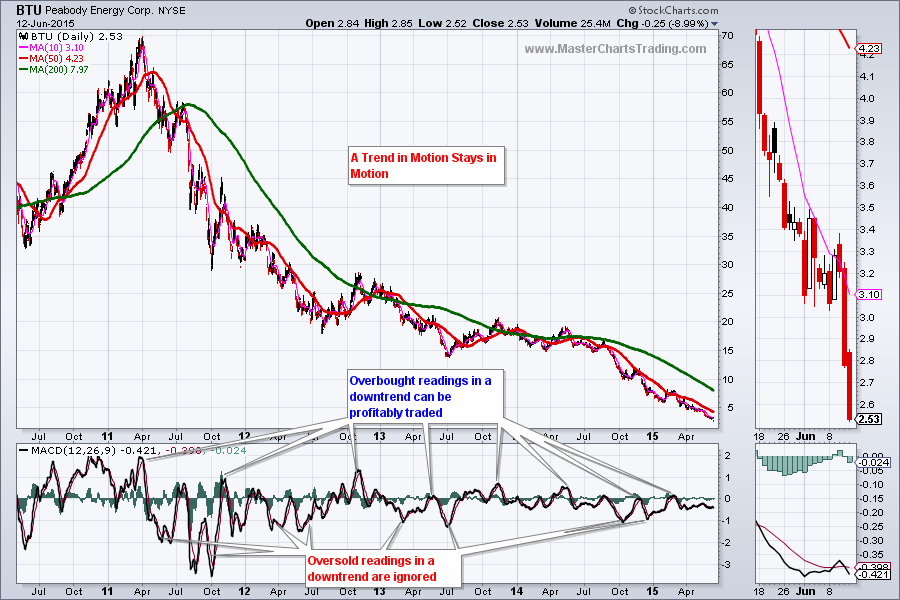
In closing, I wanted to touch upon trends and attempting to pick bottoms in stocks. Take a look at the chart of Peabody Energy (BTU). Notice how the price in April of 2011 was just over $70 and today it is $2.53. That is one long and unrelenting downtrend! If you tried to find the bottoms for this security using MACD, you could have potentially caught a few decent rebounds, but on average you would have lost money. The money was clearly easier made on the downside as short-sellers stepped in after pretty much any sizable rally in BTU. BTU chart
That is the reason I spend a lot of time and effort first determining what is a major, primary trend of a stock. If it is up, I will ignore all bearish setups and only trade on the long side. If the trend is down, I will ignore all bullish setups and trade only on the short side. Sure, you will miss some bear market rallies and an occasional breakout in stock. But going with a trend is like floating down the river instead of trying to fight the current – it is just easier.
That is the reason I spend a lot of time and effort first determining what is a major, primary trend of a stock. If it is up, I will ignore all bearish setups and only trade on the long side. If the trend is down, I will ignore all bullish setups and trade only on the short side. Sure, you will miss some bear market rallies and an occasional breakout in stock. But going with a trend is like floating down the river instead of trying to fight the current – it is just easier.
That’s it for this week’s market recap,
Best Regards and have another great trading week!
** Special Announcement**
We are close to launching a stocks alert service. Please sign-up for our mailing list to be the first to take advantage of the discounted membership once it becomes available!
Alexander Berger (www.MasterChartsTrading.com)
Best Regards and have another great trading week!
** Special Announcement**
We are close to launching a stocks alert service. Please sign-up for our mailing list to be the first to take advantage of the discounted membership once it becomes available!
Alexander Berger (www.MasterChartsTrading.com)


 RSS Feed