|
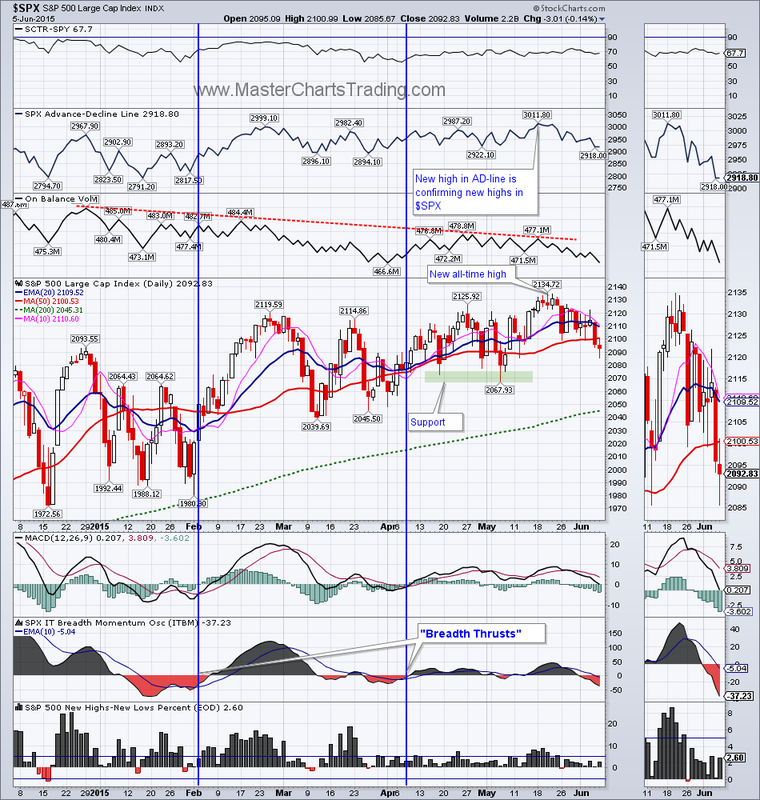
The S&P 500 ended the week on a rather weak note, closing below the 50-day moving average. MACD indicator for $SPX is also very close to a centerline crossover. The ITBM (breadth momentum oscillator) is also in the negative territory and still falling. Could more downside be in the cards for $SPX? It is certainly a possibility. Chart of S&P500
|
|
There is good support for $SPX in the 2067 area from the May lows. Key support is further down around 2039. Should there be a close below 2039, then bears would have a stronger case. For now we are only 2 weeks away from all-time highs, so a rest is certainly deserved.
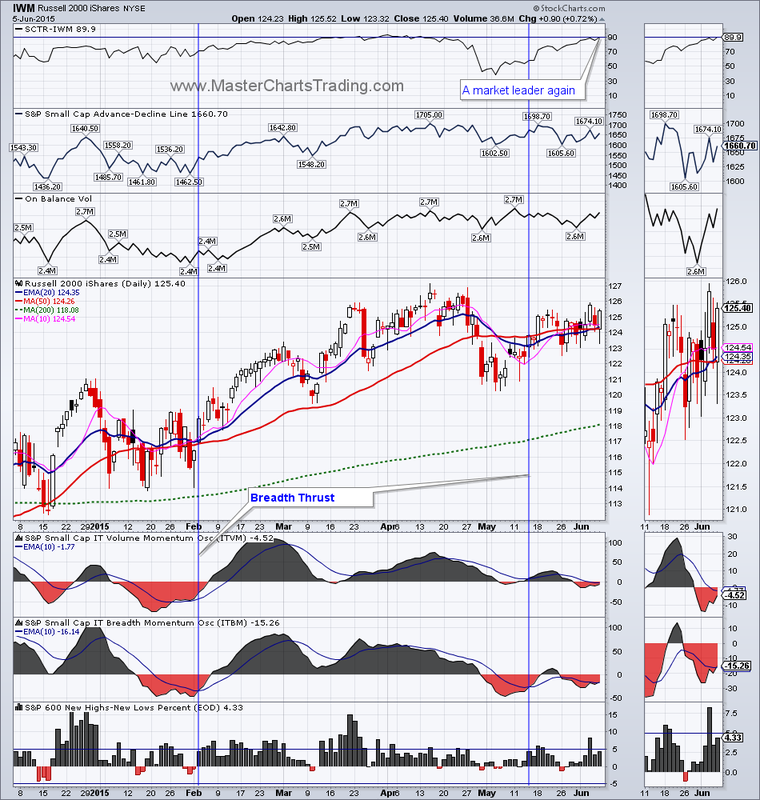
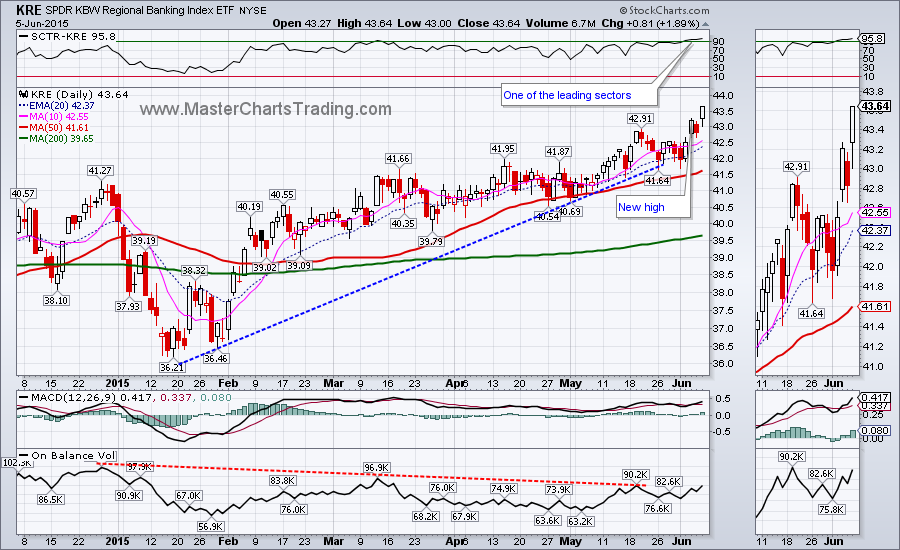
The Russell 2000 small caps ETF – IWM bucked the selling pressure and ended the week with a small gain. Small caps also resumed their leadership position among other ETFs.KRE – the regional banking ETF, hit a closing high on Friday. This is generally a good sign when financials, especially the small cap kind lead the market.
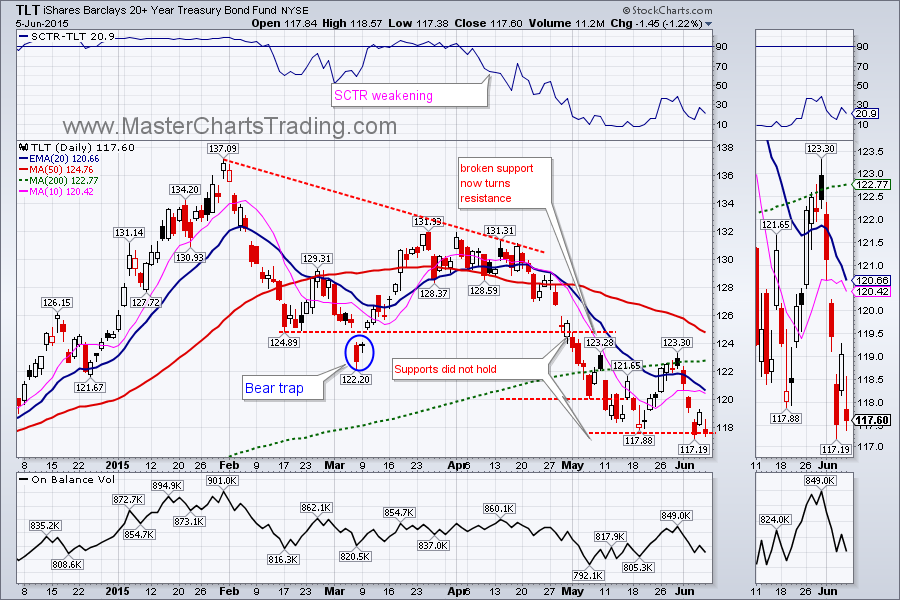
Undoubtedly the positive performance for financials was caused by a continuing weakness in the bond markets.TLT bounced off the 200-day moving average and closed below the mid-May lows on Wednesday. Bonds are very weak, but not yet outright bearish.
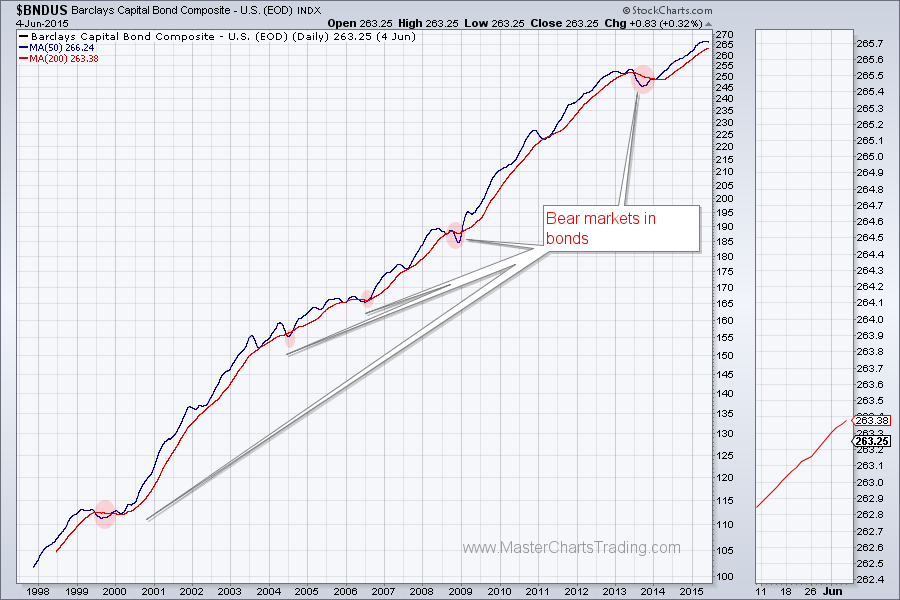
The very long-term chart for Barclays Capital Bond Composite Index ($BNDUS) shows bonds rising in price pretty much all the time going back 18 years. This chart has the price itself removed and only the 50-day and the 200-day moving averages present. A common way of checking whether or not a security is bullish is to see if the 50-day moving average is above the 200-day moving average. If it is – the security is bullish, if not it’s bearish.
There were 5 instances on this chart when the 50-day was below the 200-day. As one can see the bear markets were relatively brief and associated with only minor price drops. Currently, the 50-day moving average is still above the 200-day moving average on this chart. To me this indicates that bonds are still in a bull market.
There were 5 instances on this chart when the 50-day was below the 200-day. As one can see the bear markets were relatively brief and associated with only minor price drops. Currently, the 50-day moving average is still above the 200-day moving average on this chart. To me this indicates that bonds are still in a bull market.
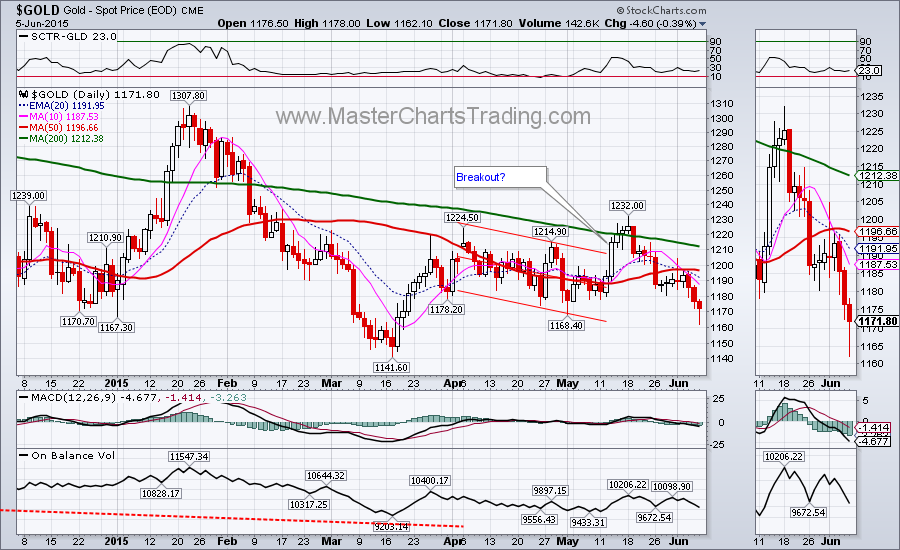
Strength in the US dollar is certainly not helping commodities, gold included. Gold lost 1.57% for the week as the breakdown that started 3 weeks ago continues. Gold did manage to hold (just barely) above the early may low and printed a hammer-like candlestick on Friday. This indicates potential support. A close below $1168 would surely cause a retest of March lows at around $1140.
Live Gold chart here
Live Gold chart here
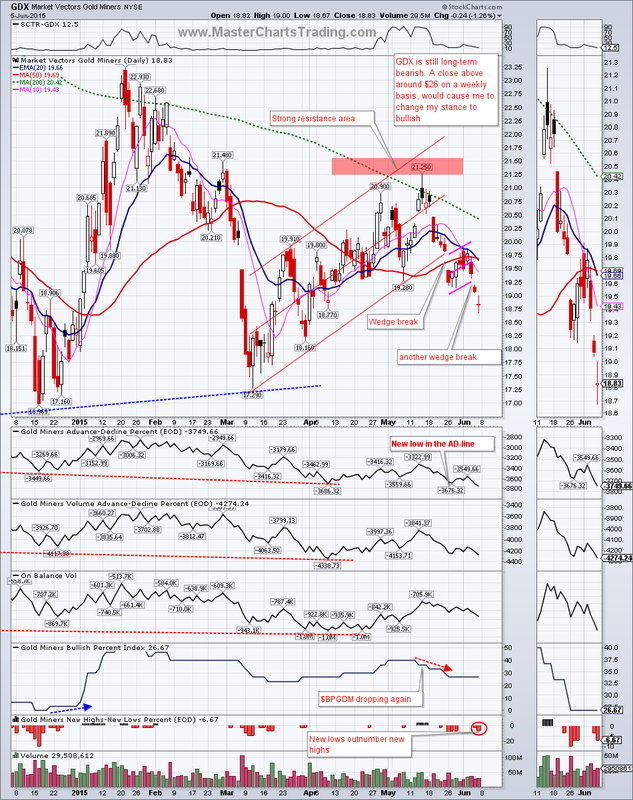
Gold miners (GDX) broke a wedge formation on chart with a close below the 50-day moving average last week. Then this Thursday GDX broke another mini-wedge with another gap down. GDX is now short-term oversold, so a rebound to around $19.50 is likely. Other then that, the stage is set for new lows especially with Advance-Decline Line for GDX hitting a new low last week.
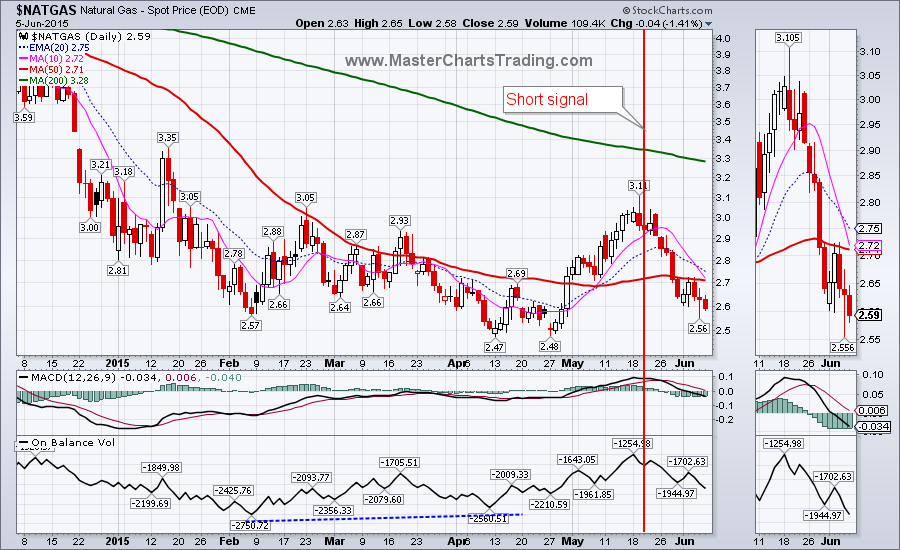
Natural gas ($NATGAS) fall back below the 50-day moving average. The big question is whether they will continue lower. There is certainly a possibility $NATGAS could fall through the April lows and retest the 2012 lows. For now $NATGAS is bearish and on our short signal dating back to May 20th.
That’s it for this week’s market recap,
Best Regards and have another great trading week!
** Special Announcement**
We are weeks away from launching a stocks alert service. Please sign-up for our mailing list to be the first to take advantage of the discounted membership!
Alexander Berger (www.MasterChartsTrading.com)


 RSS Feed