|
Friday, May 15th, 2015 Weekly Market Recap.
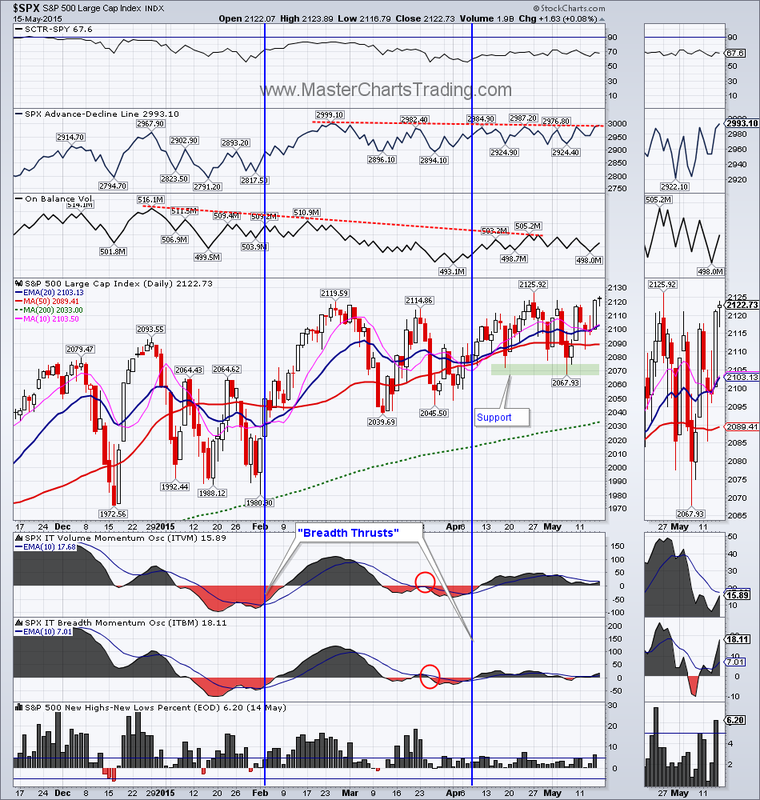
The S&P 500 hit an all-time closing high on Friday and is just a few points away from hitting an all-time high. This reaffirms our assumption that the stock market is bullish. Both QQQ and IWM hit all-time highs in late April, but since pulled back. Charts of S&P and other major indices |
|
Market breadth is lagging slightly for $SPX as the Advance-Decline line is yet to hit an all-time high. The same goes for the On Balance Volume (OBV) for $SPX – it is yet to hit an all-time high. So there is an observable divergences in the AD-Line and OBV and the price of $SPX. Does it make a difference, or is it simply a matter of time before these indicators catch-up? It’s hard to say. Neither QQQ nor IWM have similar divergences?
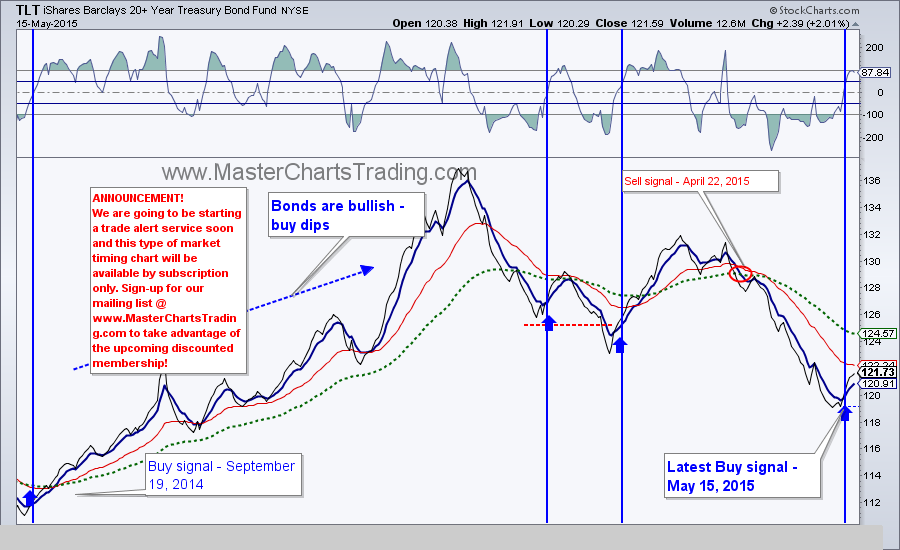
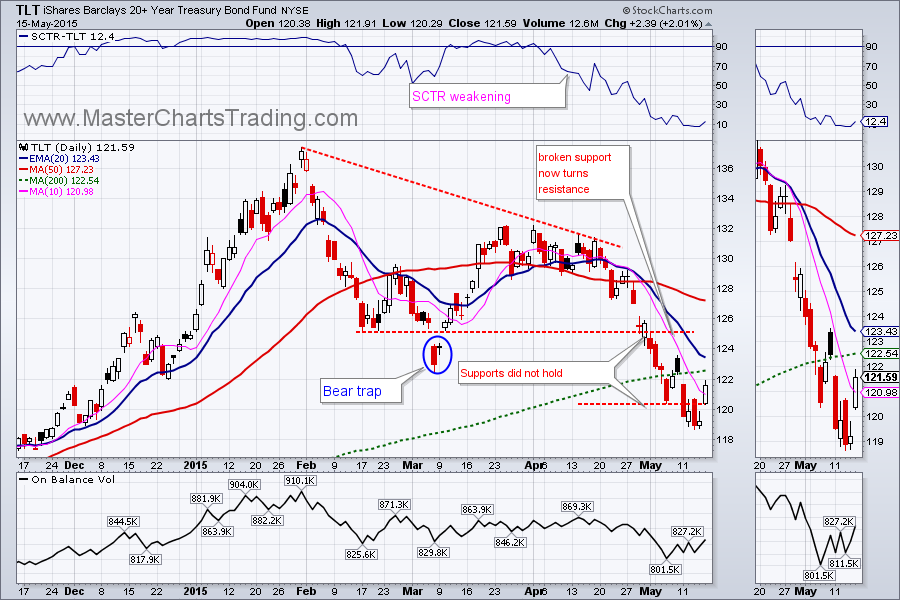
Bonds were under severe selling pressure since April as TLT lost a little over 10%. TLT finally caught a bid on Friday, as it gapped up at the open and continued, closing near the day’s highs. Bonds are still bullish long-term, so to us this indicates a buying opportunity within a bigger uptrend. We did take this opportunity and opened a position in TLT on Friday. TLT charts at bottom here
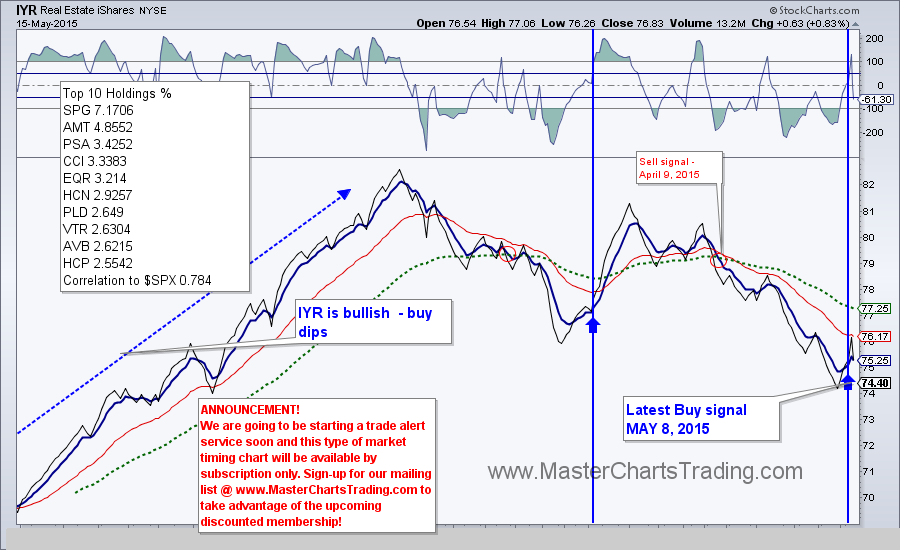
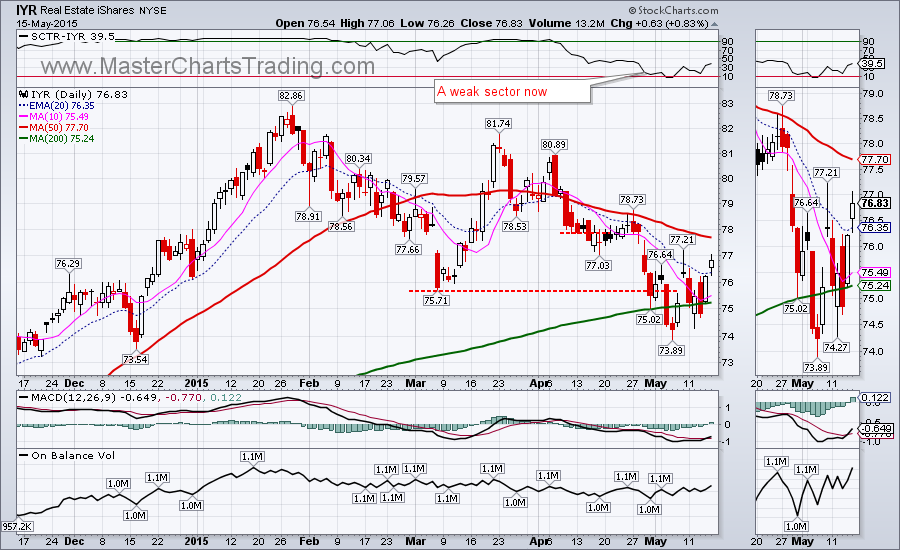
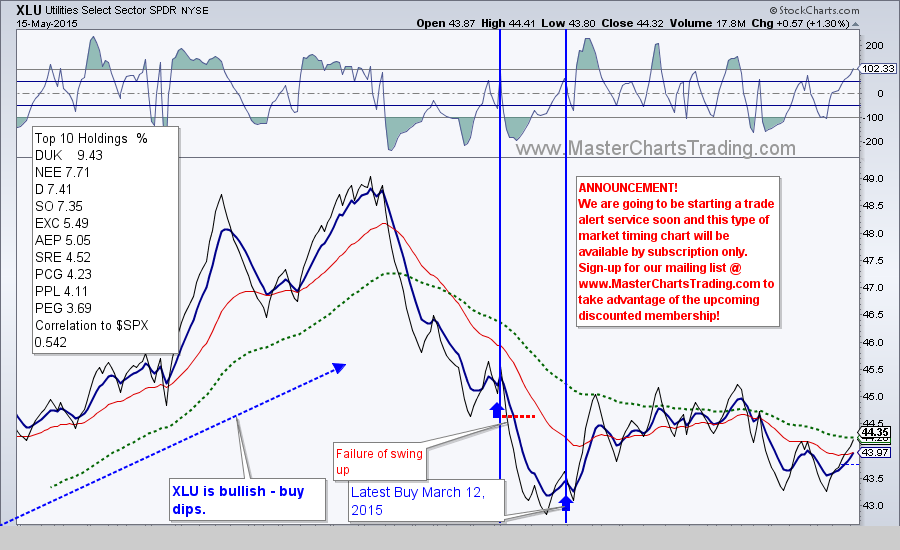
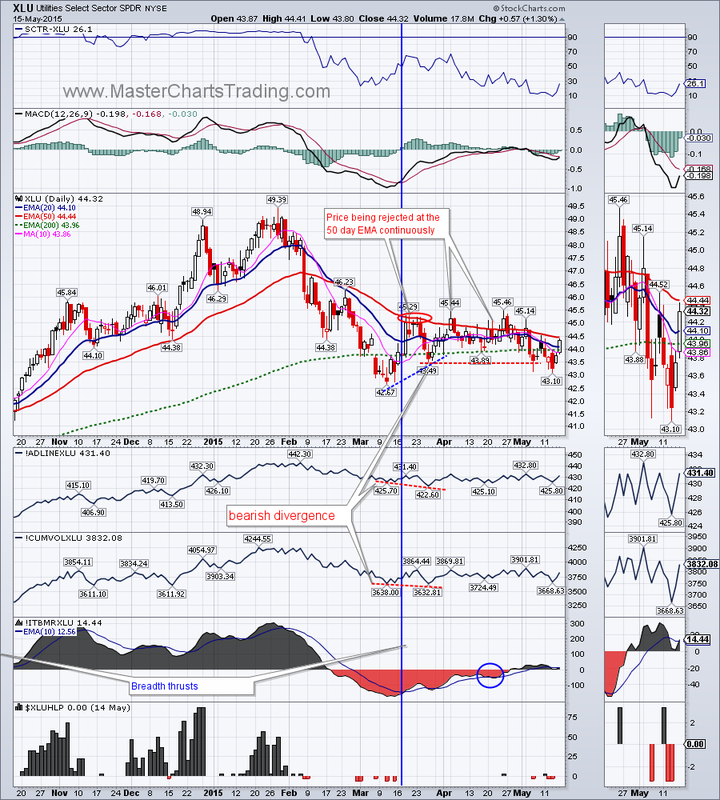
Interest rate-sensitive sectors (Utilities, REITs, dividend payers) were also under pressure together with bonds. REITs (IYR) especially may have given an early signal to the end of bonds sell-off as it gapped up last Friday (May 8th). Relatively speaking both the Utilities and REITs are weaker then other sectors, but they are still bullish overall. Should rebound in bonds continue to materialize, these sectors may benefit further. IYR and XLU charts with market timing on bottom of page here
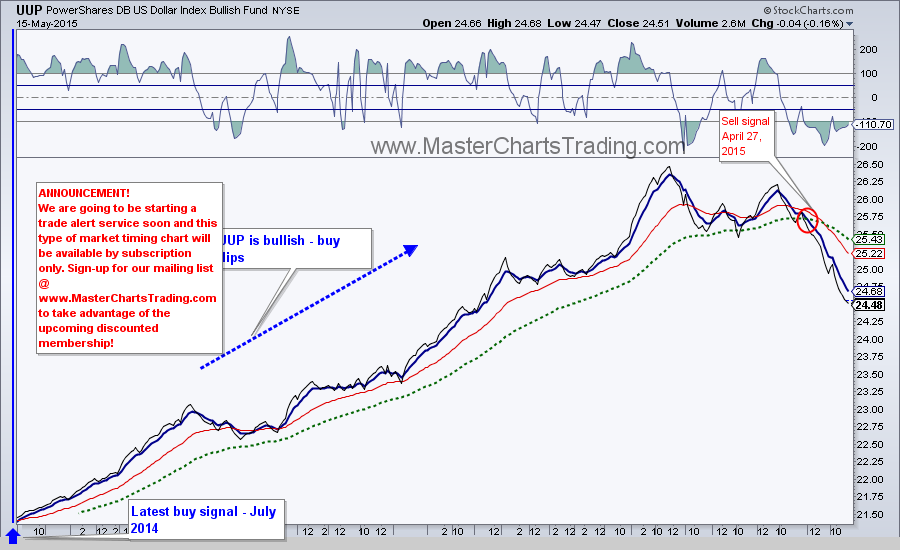
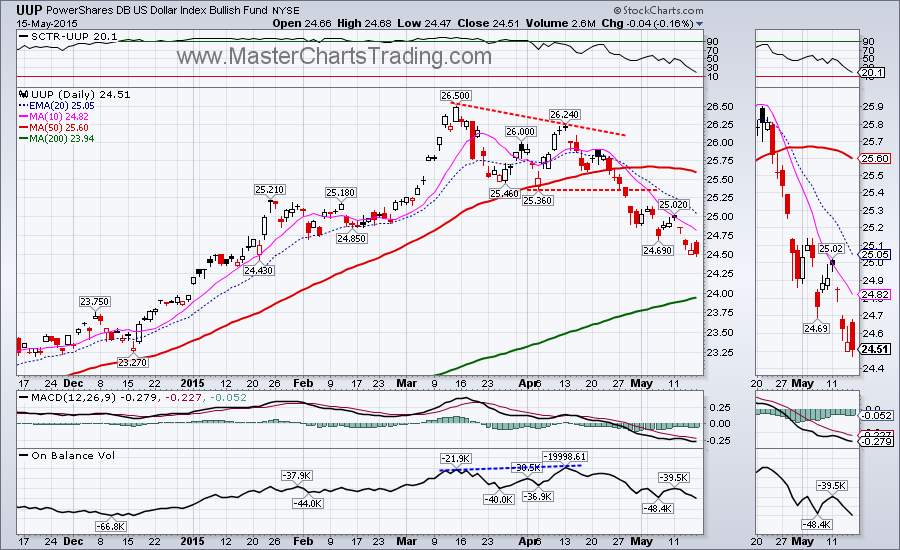
The dollar (UUP) still looks vulnerable. UUP broke another support on Tuesday and closed near the week’s lows. UUP is now very oversold – it is down almost 8% from its peak in mid-March. UUP is a bullish security, so I am more apt to look for a bullish setup. So far an oversold condition is present in UUP, but no bullish trigger yet per our trading system.
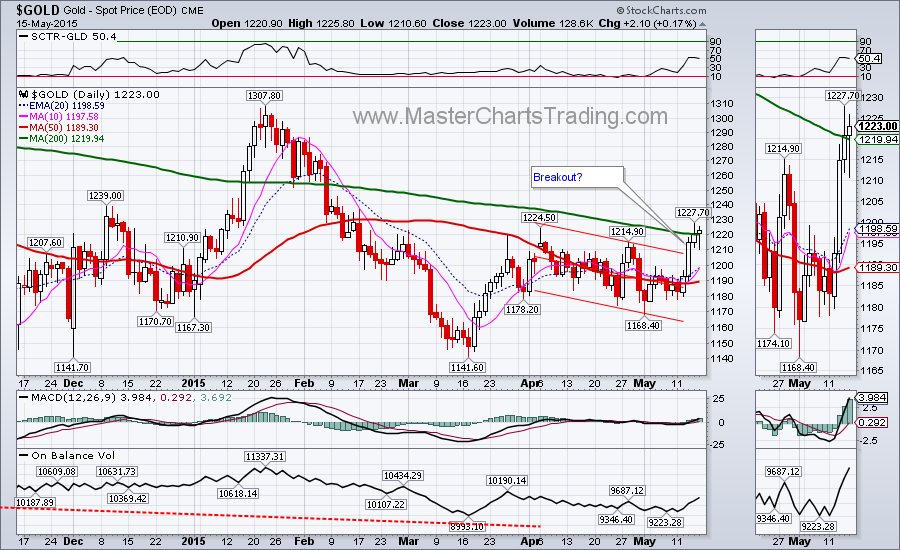
Strength in dollar is making commodities of all sorts more attractive to investors. Gold made a comeback and managed to close above the 200-day moving average, albeit not above the April 6th peak. Could this be the beginning of a new bull market? Entirely possible. Once that happens I will be looking for buying opportunities, for now we simply covered our short.
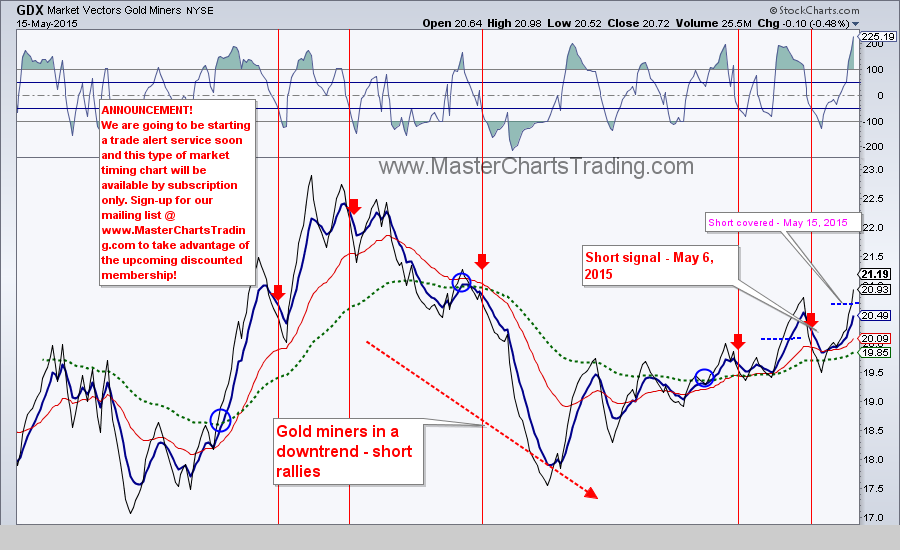
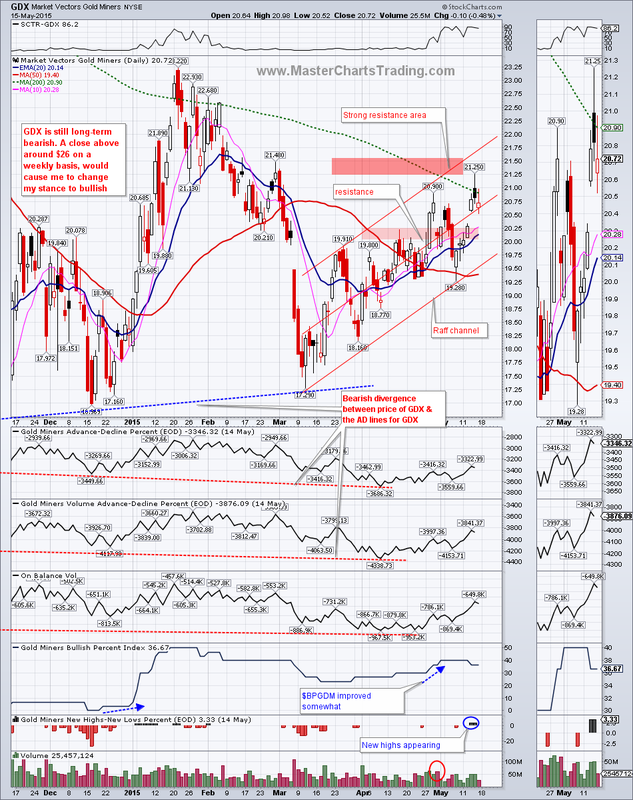
Breakdown in GDX clearly did not materialize and the security rebounded to the top of the Raff regression channel and challenged the overhead 200-day moving average at around $21. Again, GDX is in a long-term downtrend, but may be showing signs of life as some new 52-week highs were registered for some stocks within the index.
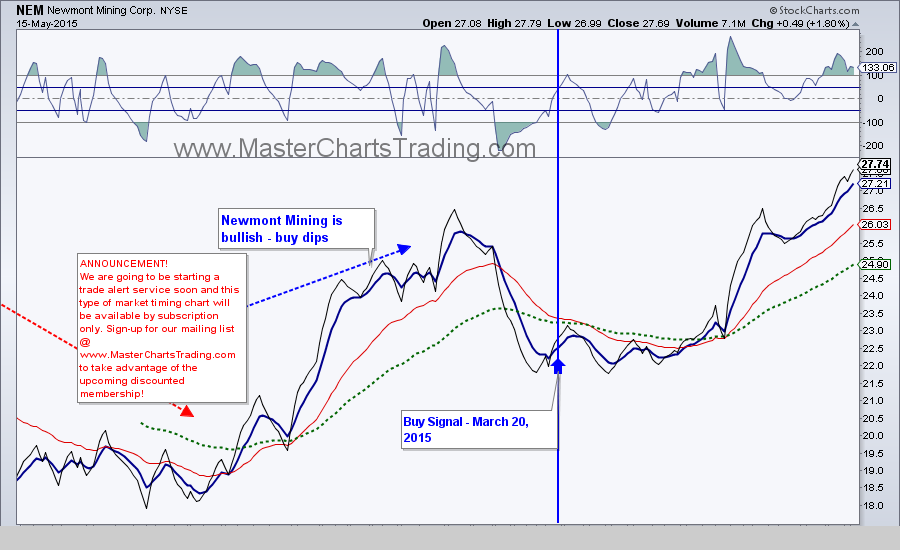
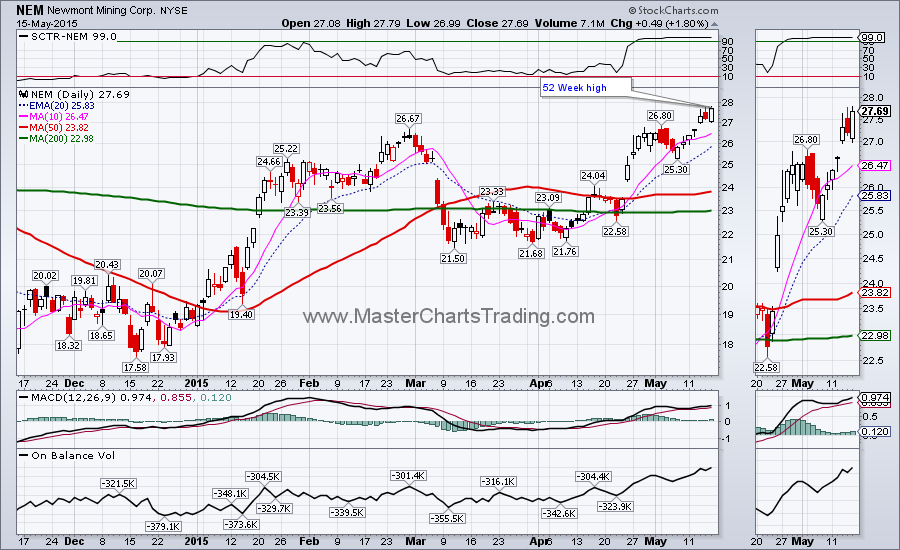
Newmont mining (NEM) is one of those stocks. NEM is showing surprising strength. Its technical rank (SCTR) is now at a very strong 99 – right up there with biotech and Chinese stocks. It also hit a 52-week high. Newmont Mining is now on my list of stocks to buy on a pullback.
Gold, gold mining and Newmont Mining charts located here
Breakdown in GDX clearly did not materialize and the security rebounded to the top of the Raff regression channel and challenged the overhead 200-day moving average at around $21. Again, GDX is in a long-term downtrend, but may be showing signs of life as some new 52-week highs were registered for some stocks within the index.
Newmont mining (NEM) is one of those stocks. NEM is showing surprising strength. Its technical rank (SCTR) is now at a very strong 99 – right up there with biotech and Chinese stocks. It also hit a 52-week high. Newmont Mining is now on my list of stocks to buy on a pullback.
Gold, gold mining and Newmont Mining charts located here

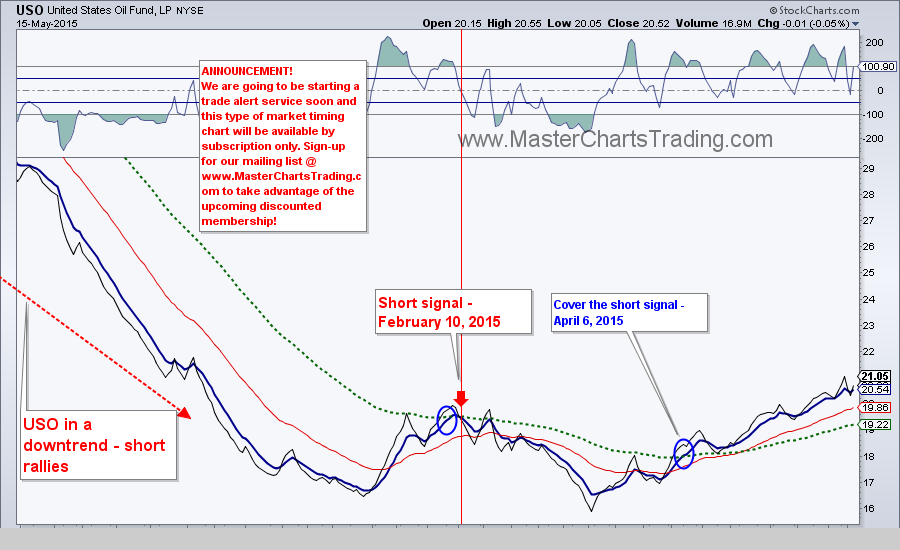
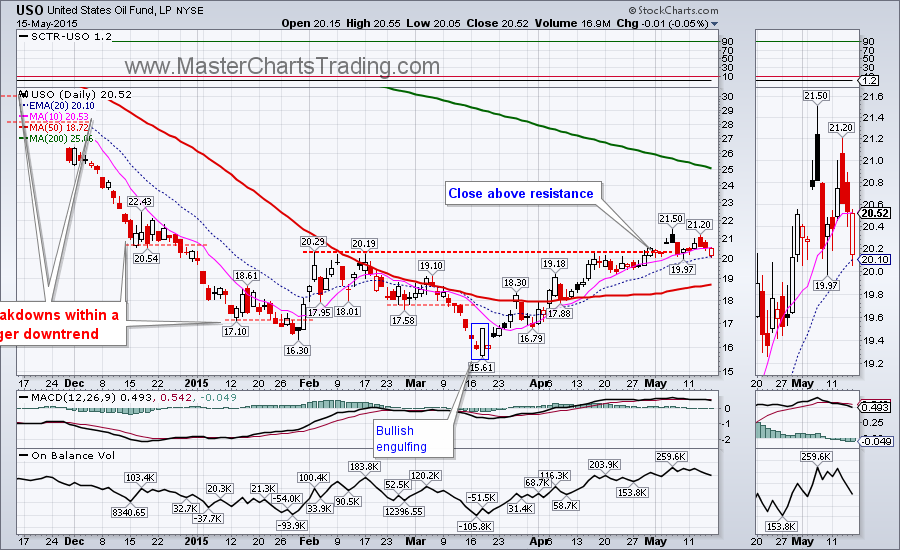
Strength in the dollar has also helped oil come back from the dead. USO rallied over 38% from its low in March. It is more or less holding support in the $20. Long-term oil is bearish, so I am looking for a shorting opportunity. So far no short signal was given per our trading system. Oil, gas, and broad commodities charts here
That’s it for this week’s market recap,
Best Regards and have another great trading week!
** Special Announcement**
We are weeks away from launching a stocks alert service. Please sign-up for our mailing list to be the first to take advantage of the discounted membership!
Alexander Berger (www.MasterChartsTrading.com)
Disclaimer, we have:
Open positions: IBB, XSD, IWM, IYR, LULU
New position: TAN, TLT
Closed position: DUST


 RSS Feed