|
Friday, May 1st, 2015 Weekly Market Recap.
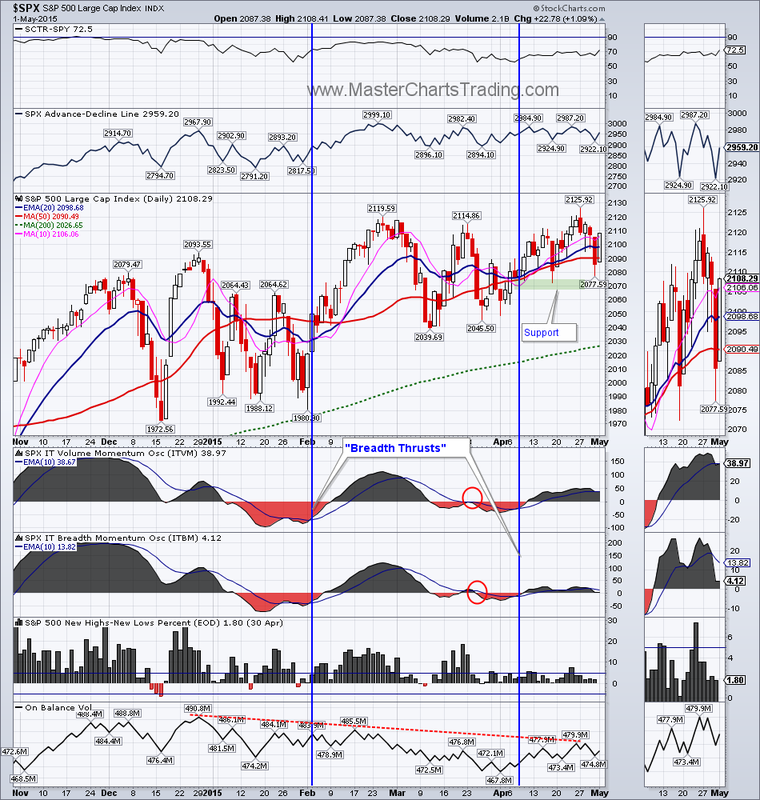
S&P 500 retested support in the 2070 area and held it for now. The buyers stepped in on Friday and pushed $SPX right back above the 50-day and the 10-day moving averages. So far no sell signal generated on the $SPX per our trading system. Charts for SPX and IWM here. |
|
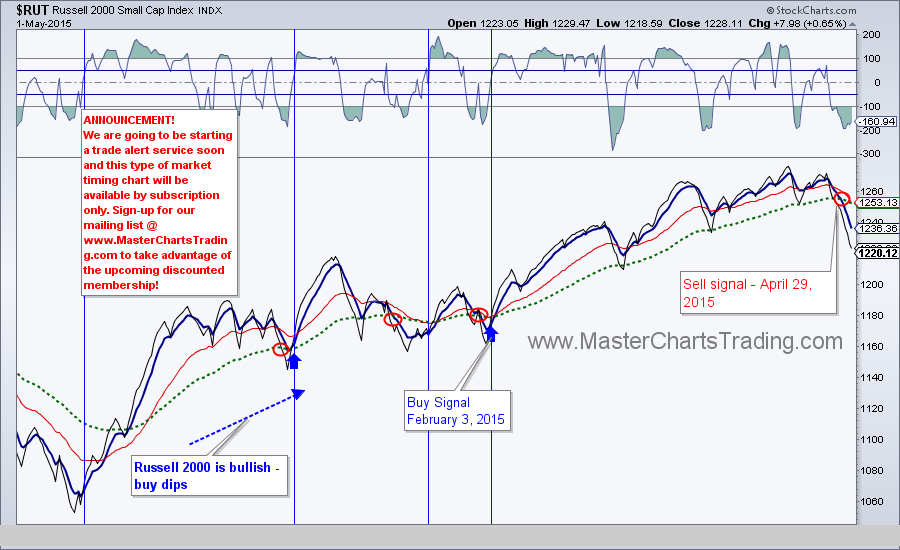
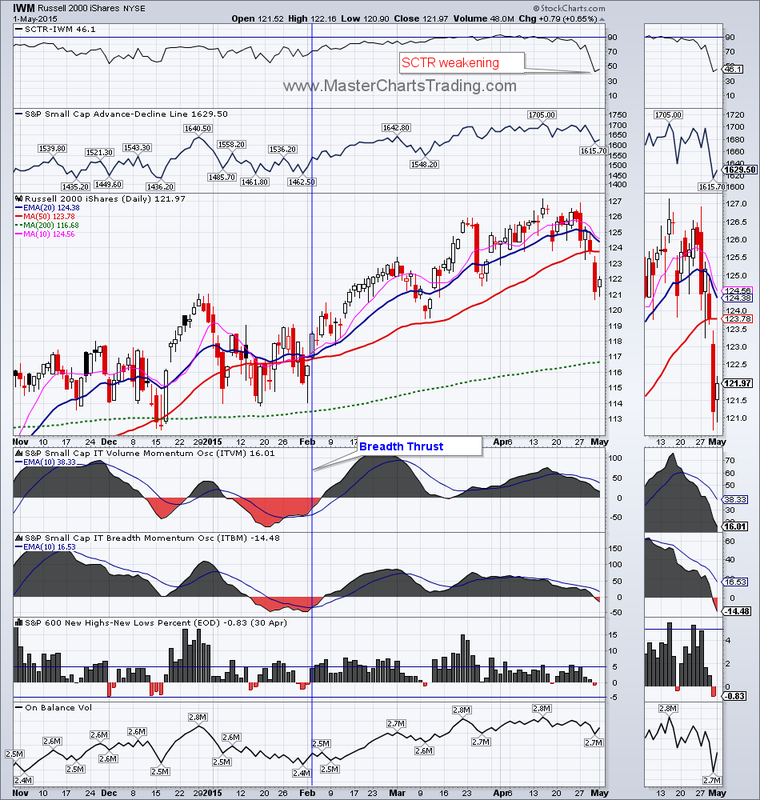
Small caps came under selling pressure and on Friday IWM closed below the 50-day moving average. IWM is currently the weakest of the big 3 averages (SPX, QQQ and IWM). How long this weakness will continue is anybody’s guess. For now our trading system generated a sell signal on April 29th. Better be on the outside looking in, than on the inside wishing you were out.
Market breadth has deteriorated somewhat especially in the small cap universe. Breadth Momentum Oscillators has rolled over below their 10-day exponential moving averages. In the past it meant less upside potential and maybe even more downside potential. Market breadth is kind of like a wind when sailing – it’s always better to have it at your back.
Market breadth has deteriorated somewhat especially in the small cap universe. Breadth Momentum Oscillators has rolled over below their 10-day exponential moving averages. In the past it meant less upside potential and maybe even more downside potential. Market breadth is kind of like a wind when sailing – it’s always better to have it at your back.
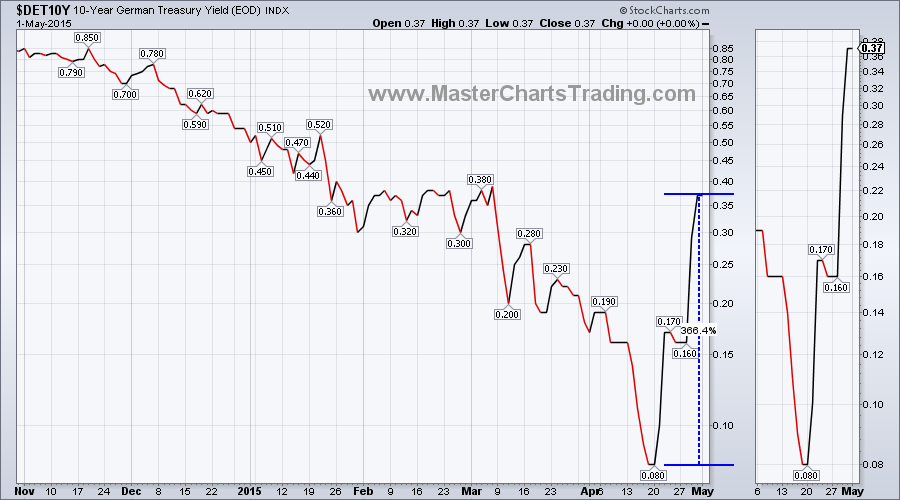
Bonds sold off worldwide. Just on April 20th, the 10-year German Treasury yield was basically at zero (0.08%). Here we are just 9 days later and same yield is now at 0.37% - a 366% move! For comparison purposes US Treasury 10-year yield is currently over 2%.
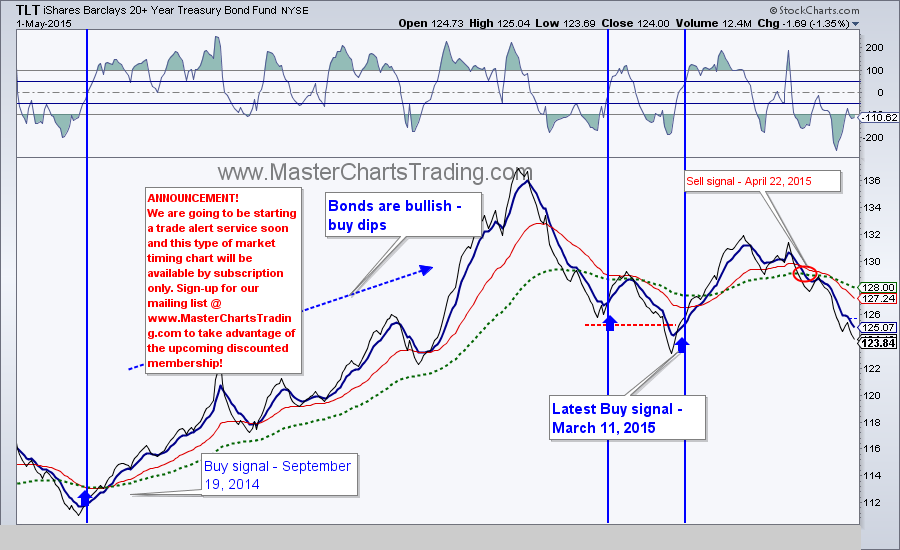
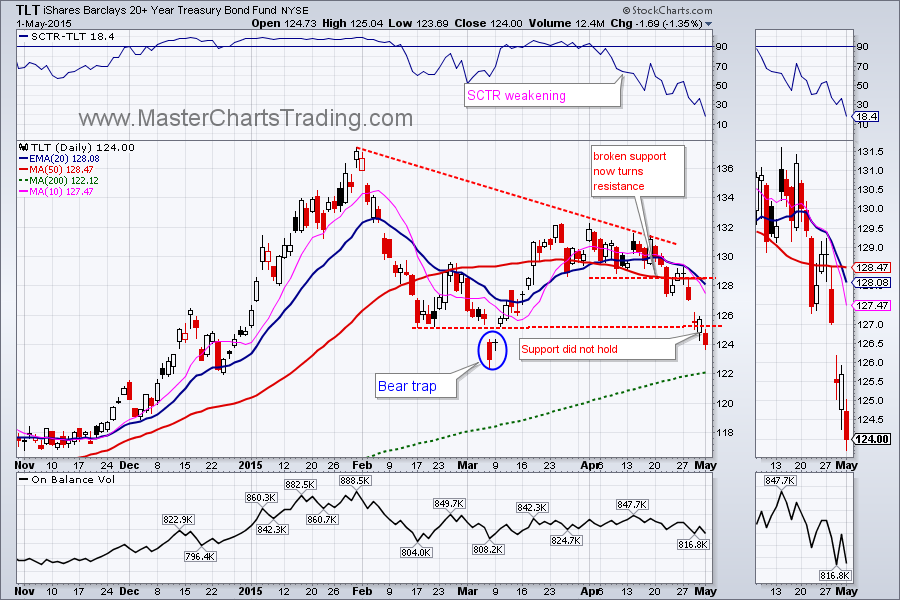
Treasury bonds (TLT) were off another 3.73% this week. On Thursday it looked like bond bulls were going to make a stand and TLT was going rally. Yet Friday TLT closed below the support level from February. Unless it rallies from here, the next stop for TLT might be the 200-day moving average, currently around 122.
Treasury bonds (TLT) were off another 3.73% this week. On Thursday it looked like bond bulls were going to make a stand and TLT was going rally. Yet Friday TLT closed below the support level from February. Unless it rallies from here, the next stop for TLT might be the 200-day moving average, currently around 122.
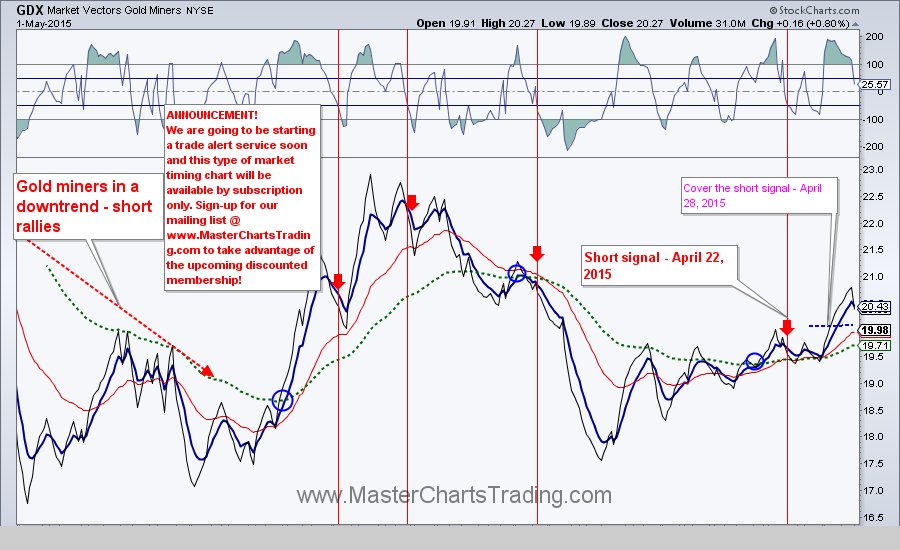
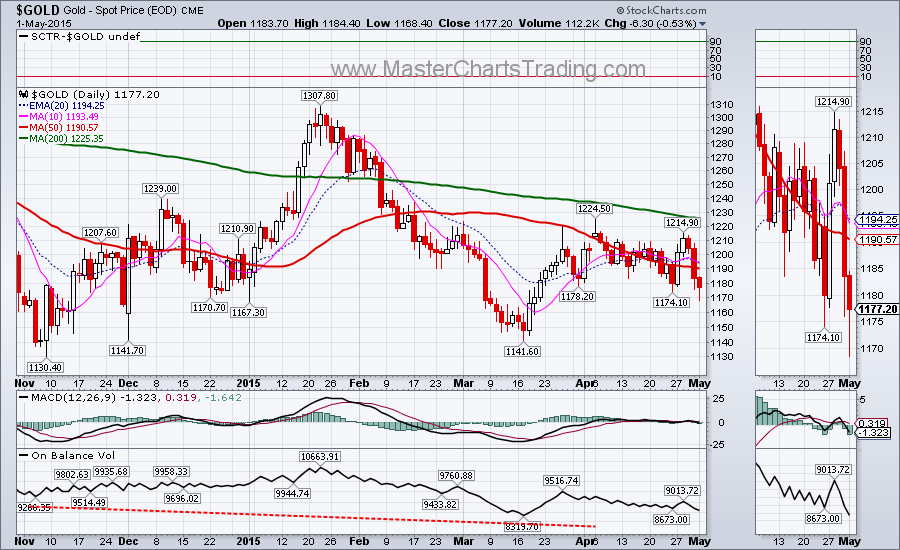
Gold turned very volatile as it first retested resistance at $1224 and later same week retested the support at $1174. I was short gold via JDST going into this week, but was forced to cover on Monday. Gold and gold miners are still bearish long-term, so I would be looking to reenter on the short side again.
GDX may be drawing out what appears to be a rising wedge formation. A break below the lower line of the wedge may call for a retest of December lows. For now GDX is rapidly coming up on a major resistance zone defined by the 200-day moving average and the peak from February - around $21.50.
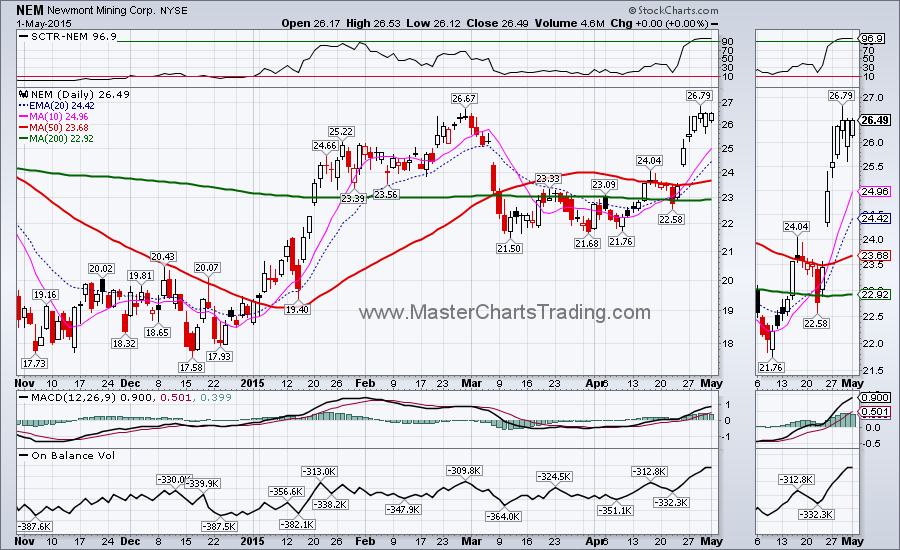
It’s always a good idea to be cognizant of the opposing view. To that degree I question myself to see if my assumption about a stock is correct. In other words - what if I am wrong? One of the stronger stocks in the gold mining complex Newmont Mining (NEM) became an outright market leader this week. Its SCTR (Stockcharts technical rank) is now above 90, which means it’s in the top 10 percent of all large cap stocks. This shows that money may be rotating into the gold and the natural resources sectors again.
Gold and gold miners charts are located here
GDX may be drawing out what appears to be a rising wedge formation. A break below the lower line of the wedge may call for a retest of December lows. For now GDX is rapidly coming up on a major resistance zone defined by the 200-day moving average and the peak from February - around $21.50.
It’s always a good idea to be cognizant of the opposing view. To that degree I question myself to see if my assumption about a stock is correct. In other words - what if I am wrong? One of the stronger stocks in the gold mining complex Newmont Mining (NEM) became an outright market leader this week. Its SCTR (Stockcharts technical rank) is now above 90, which means it’s in the top 10 percent of all large cap stocks. This shows that money may be rotating into the gold and the natural resources sectors again.
Gold and gold miners charts are located here


Undoubtedly one of the reasons why natural resources are gaining (or at least no longer falling) is the sell-off in the dollar. UUP is off over 6% from its March peak. UUP may already be making a stand. It is short-term oversold and short-term traders might be stepping in for a rebound play. No buy signal on UUP yet per our trading system.
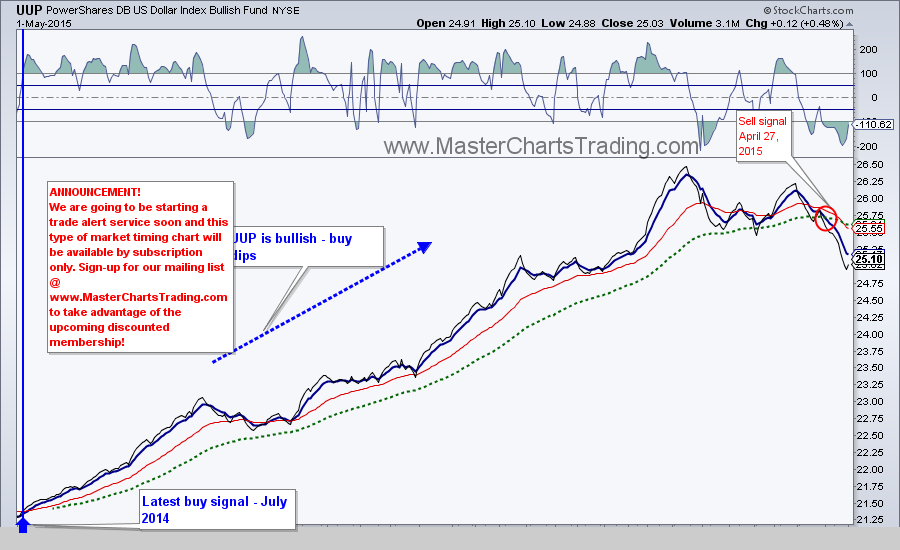

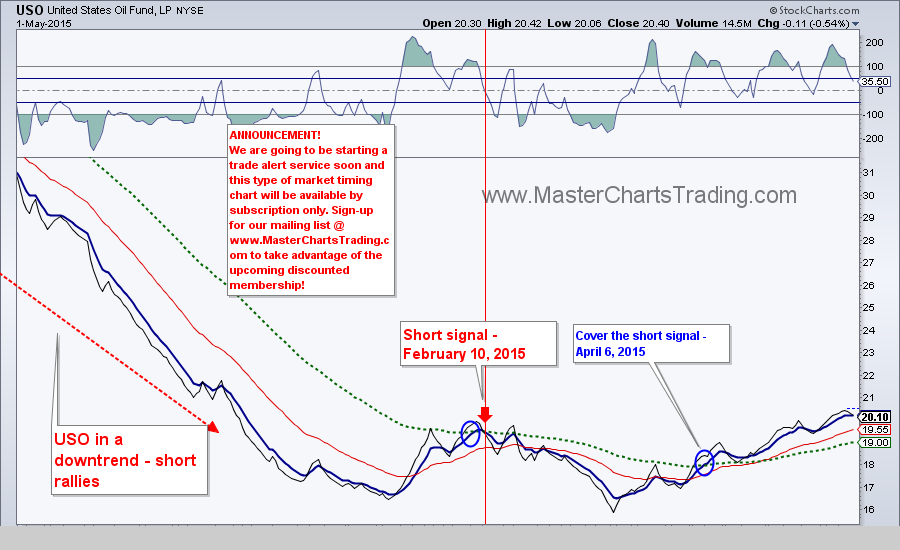
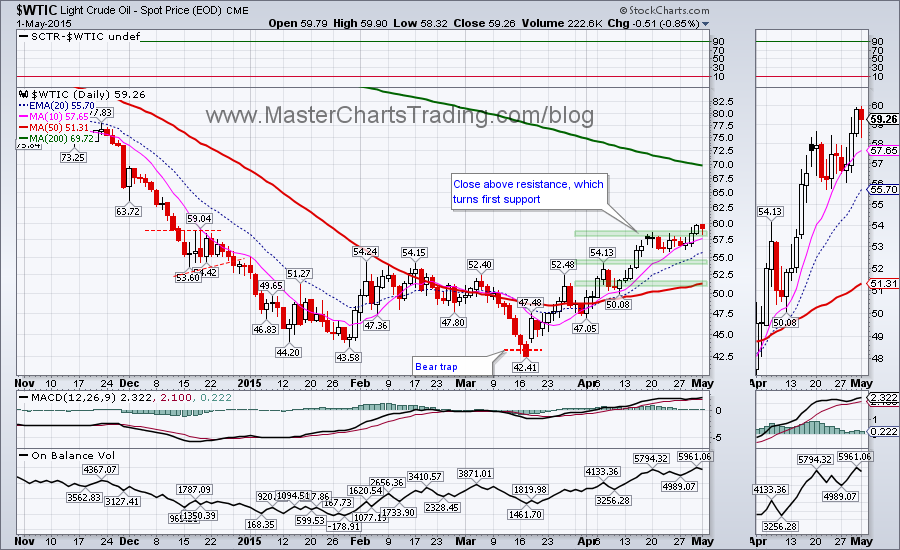
During the same time period that UUP was down a little over 6%, West Texas Intermediate Oil ($WTIC) is up over 40%. Again, I am bearish on $WTIC in the long-term and will look for shorting opportunities, but there is no denying that there are now decent support levels for oil in the $54 and $51 areas. Still, should the dollar rally it would pressure all commodities.
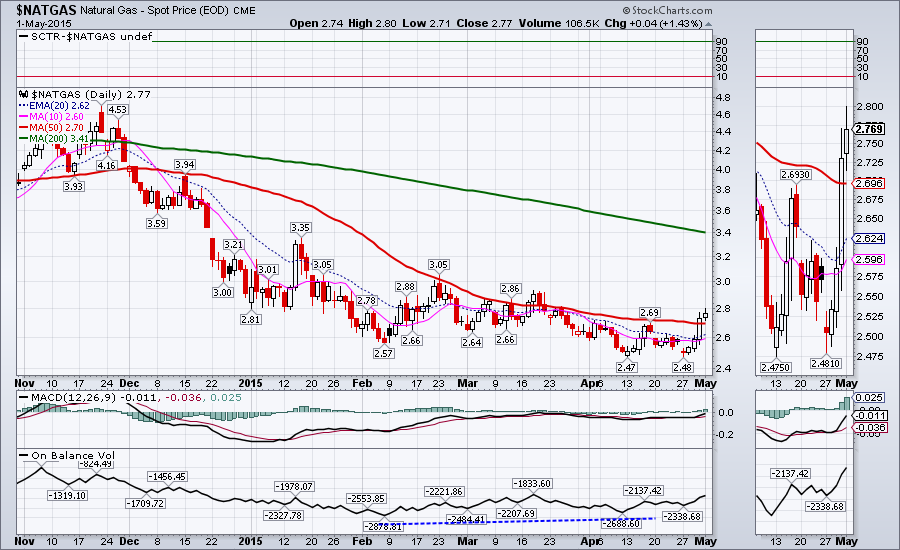
Natural gas ($NATGAS) may have put in a double bottom. It rebounded from the low of $2.48 on Monday and closed above the 50-day moving average for the second day in a row on Friday. A quick move below the 50-day moving average next week would reaffirm the longer-term downtrend in gas. Again, I would be looking for shorting opportunities until proven otherwise especially should the dollar rally.
Commodities charts located here
That’s it for this week’s market recap,
Best Regards and have another great trading week!
** Special Announcement**
We are weeks away from launching a stocks alert service. Please sign-up for our mailing list to be the first to take advantage of the discounted membership!
Alexander Berger (www.MasterChartsTrading.com)
Disclaimer, we have:
Open positions: SPY, LULU, EA (took profits)
New position:
Closed position: JDST


 RSS Feed