|
Friday, May 8th, 2015 Weekly Market Recap.
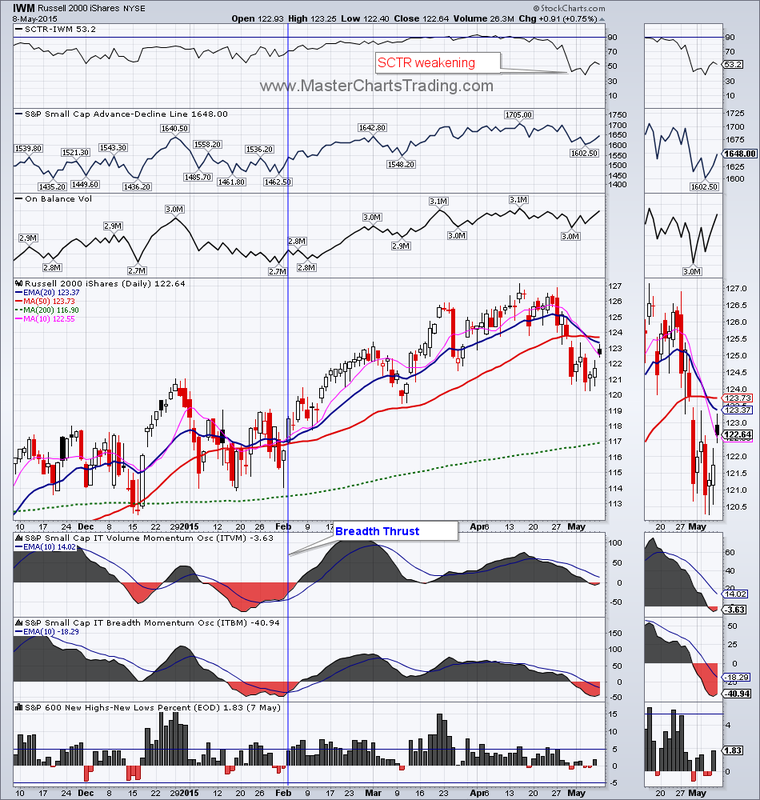
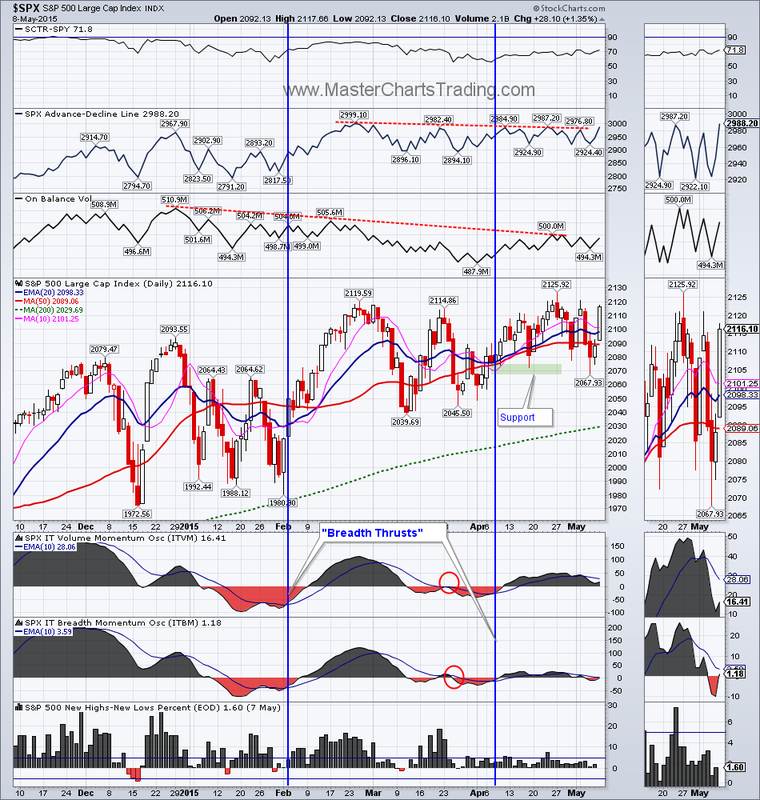
Just 2 days after a sell signal in the S&P 500 caused us to take our final profits in the SPY fund, the markets surged on Friday on the heels of a very upbeat jobs report. Buying was strong across the board with stocks, bonds and commodities all rallying. Market breadth is still lagging a bit for the large cap dominated $SPX. The slight bearish divergence in the AD-Line and the On Balance volume are still present. No such divergences are present on the charts of QQQ or IWM. We went ahead and opened a position in IWM. Charts for SPY, QQQ, IWM here |
|


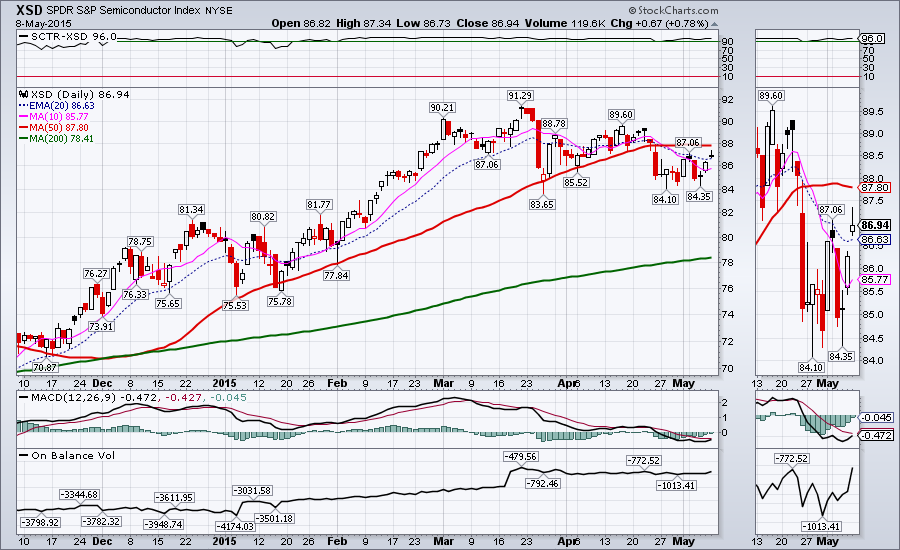
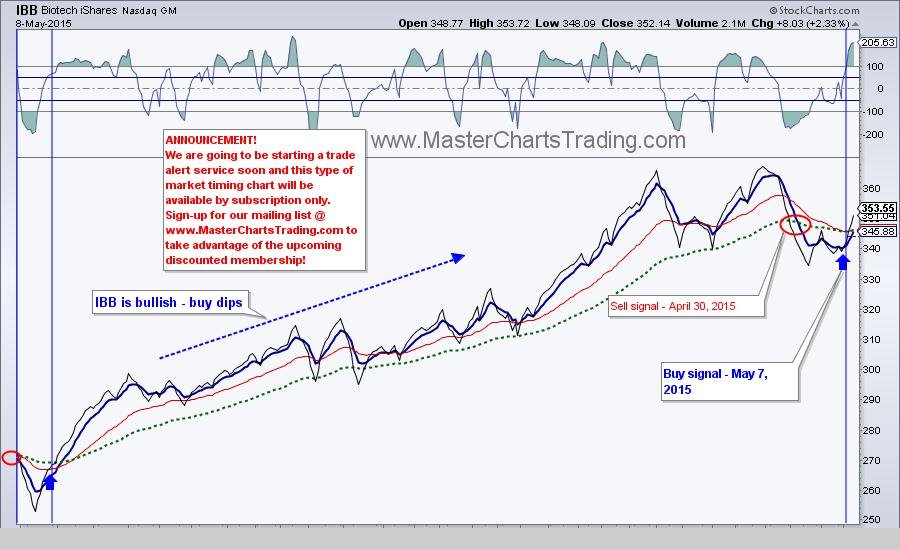
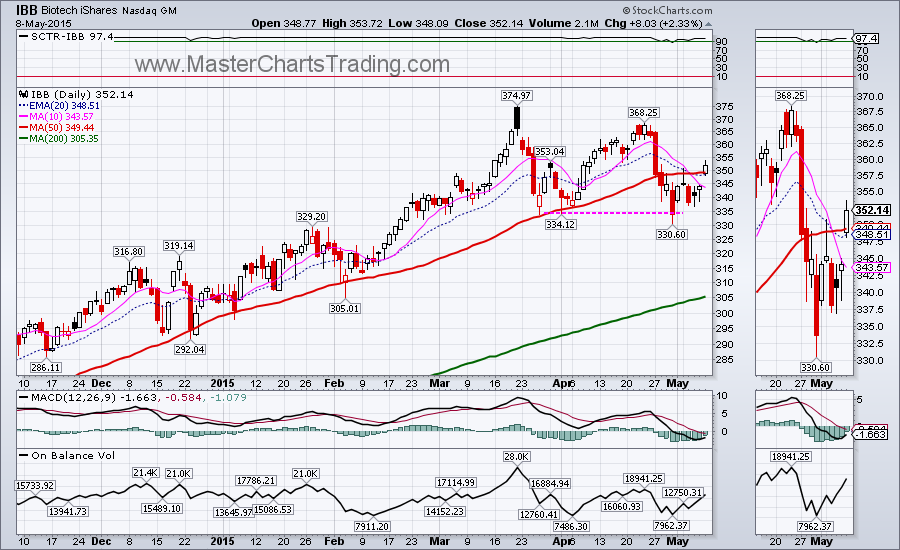
Some of the stronger sectors started their rebounds even earlier then the general market. Biotech sector (IBB) and semiconductors (XSD) went on our buy signals yesterday and we opened positions in both of these. I think XSD represents the semiconductors sector better then the other more popular semiconductors fund - SMH. XSD is a much more balanced ETF, with its top 10 holdings representing only 28% of the total ETF composition. By contrast SMH has over 72% in the top 10 holdings, with Intel and Taiwan Semiconductor making up 34.5%! So if either INTC or TSM make large moves, the whole ETF gets distorted.
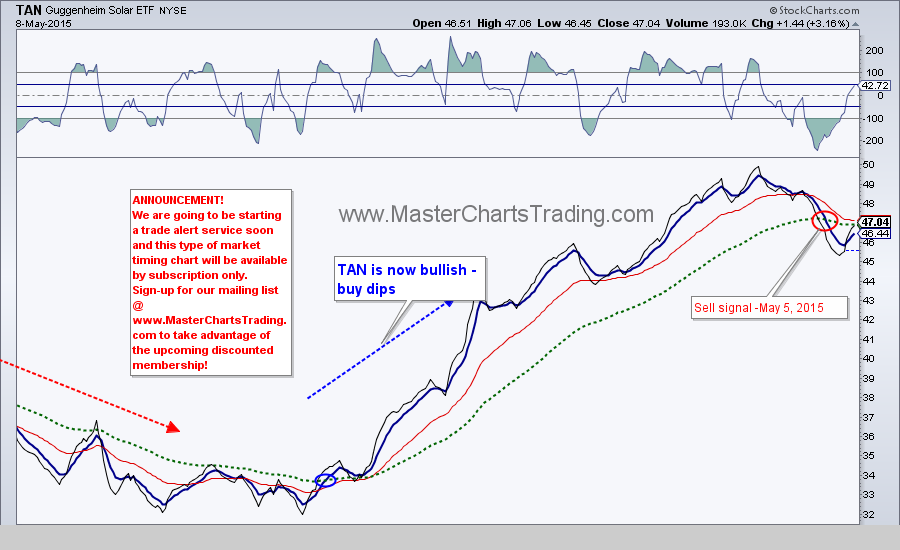
Solar ETF – TAN is also very close to our buy signal. TAN broke out of its short-term bear market in March and hit a high for the move in April. It has since corrected around 10% and has become sufficiently oversold for me to become interested in a lower risk entry. Just a little more upside is needed for me to confirm that the selling has indeed stopped and buying began.
Charts of IBB, XSD and TAN here


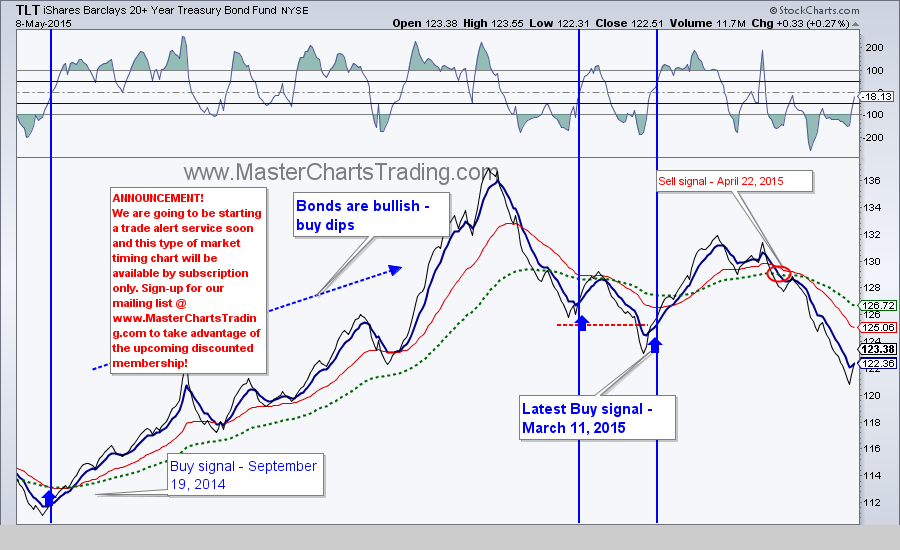
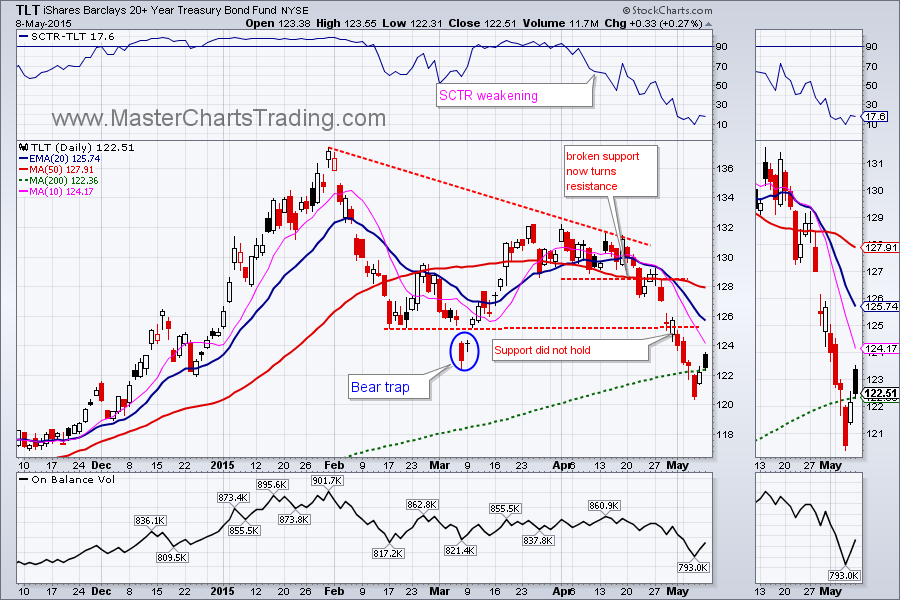
Bonds (TLT) rebounded weakly from very oversold levels. TLT closed below the 200-day moving average on Wednesday. Since TLT then was able to close above the 200-day on Friday. Judging from the reaction to the jobs report, there is now more greed then the fear in the markets. Bonds do better when there is more fear. Our trading system did not generate a buy signal on TLT yet, so we are staying out of the bond market for now.
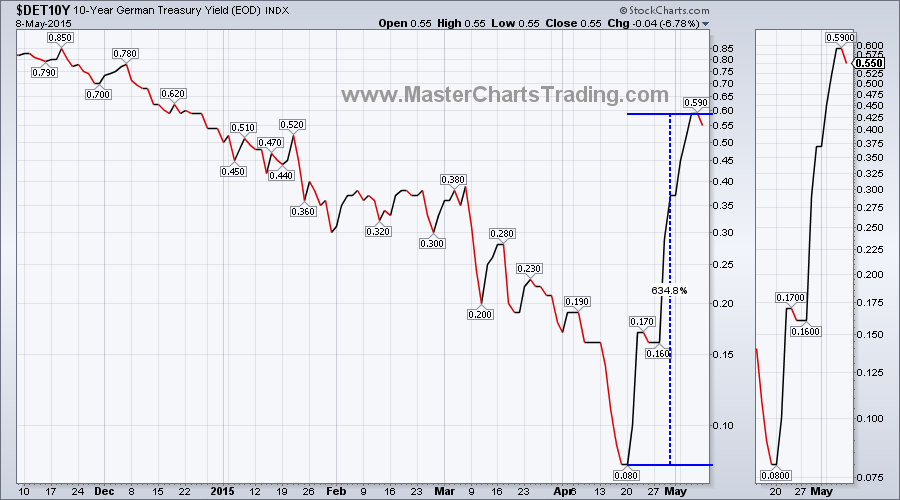
Similar patterns are unfolding in the 10 year German bund yield. It surged over 630% (!) in just 3 weeks, but the yield has come down a bit as bonds rebounded.
Similar patterns are unfolding in the 10 year German bund yield. It surged over 630% (!) in just 3 weeks, but the yield has come down a bit as bonds rebounded.
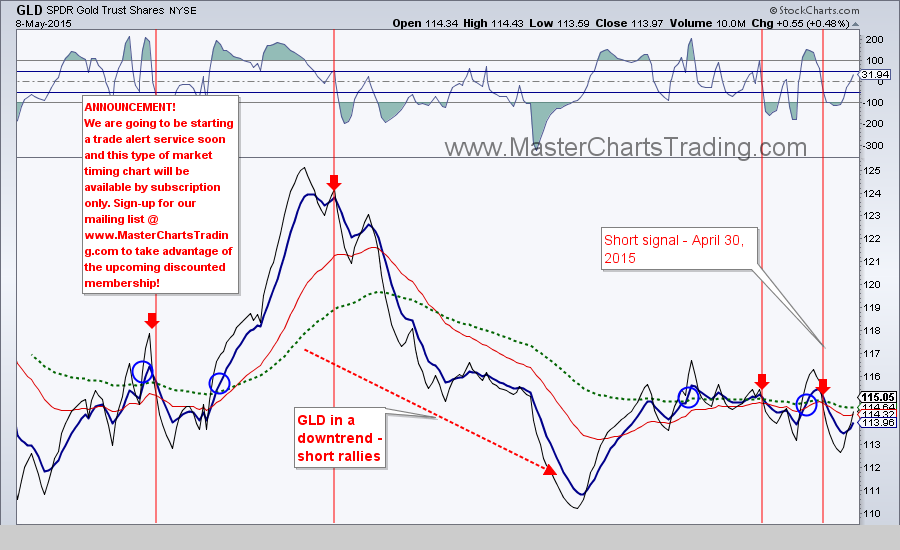
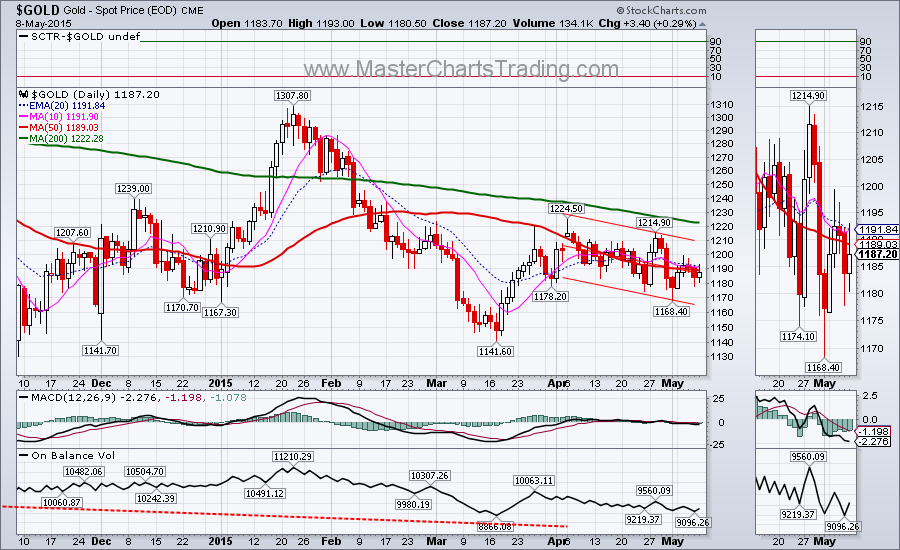
Gold remains in long-term and short-term downtrends. A close below $1174 would almost certainly open the door to a re-test of November lows. A short signal remains in force from April 30th.
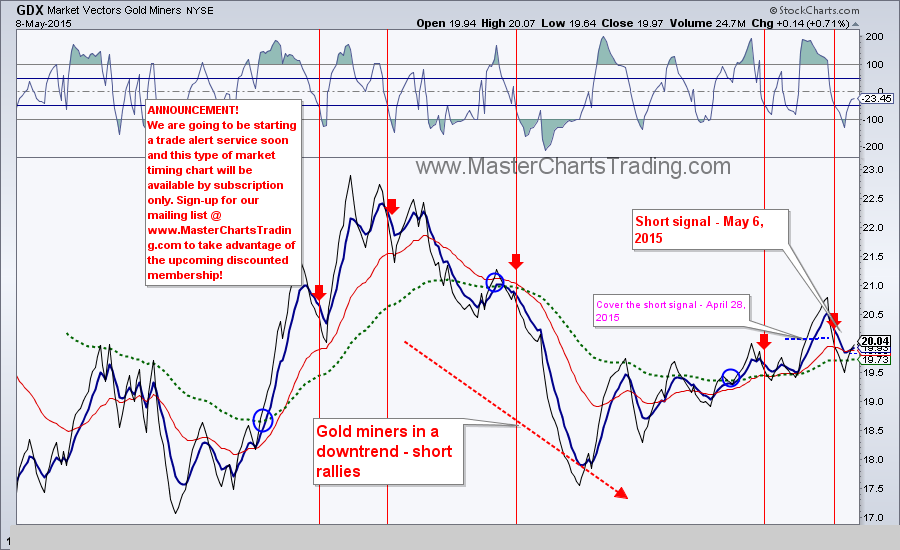
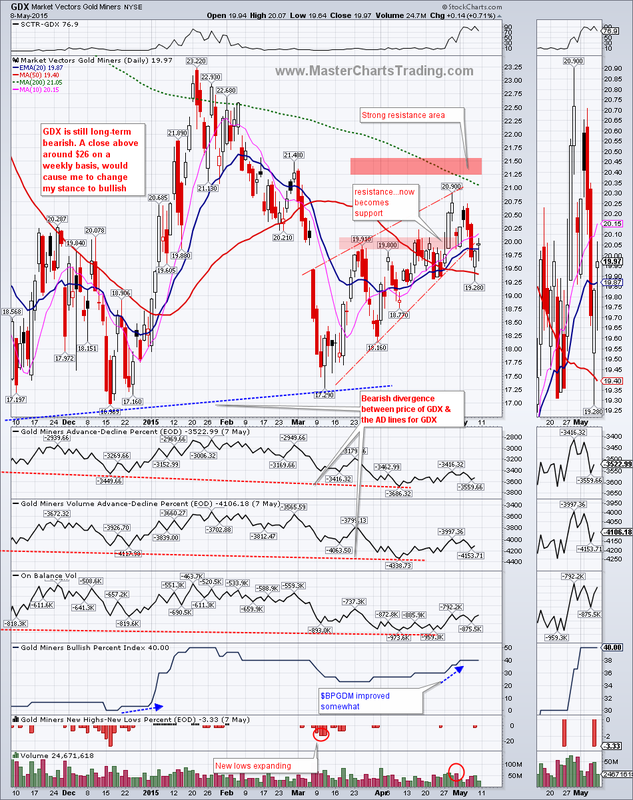
GDX broke a rising wedge formation on Wednesday. This breakdown also generated a short signal per our trading system and we opened a position in DUST. It remains to be seen if this breakdown holds. So far GDX rebounded from the 50-day moving average and closed on the rising wedge trend line. Any further weakness in gold will put more downward pressure on gold equities. GDX could easily drop another 10% from today’s close since there is some support around $18. Or, it could possibly even retest December lows, which are 15% down.
Gold and gold miners charts here
On the energy front, XLE, the energy ETF, ran into the resistance area defined by a falling 200-day moving average and the previous gap down area from late November. On Tuesday, I believe we had an Outside reversal on the candlestick chart of XLE. It was subsequently confirmed on Wednesday by a lower close. An Outside reversal happens when yesterday’s trading range is completely inside today’s trading range. In the case of XLE this reversal happened at the top of the rebound that started in March – thus it’s a bearish Outside reversal.XLE remains on our short signal since April 21.
Oil is looking like it may be topping out for the move - it was a very strong move indeed. From the March lows till the high on May 6th, USO went up almost 40%! The selling in USO started on May 6th and followed through the next day with a long red candlestick being printed on the chart. A little more follow-up is required for our system to generatea short signal.
Oil is looking like it may be topping out for the move - it was a very strong move indeed. From the March lows till the high on May 6th, USO went up almost 40%! The selling in USO started on May 6th and followed through the next day with a long red candlestick being printed on the chart. A little more follow-up is required for our system to generatea short signal.


That’s it for this week’s market recap,
Best Regards and have another great trading week!
** Special Announcement**
We are weeks away from launching a stocks alert service. Please sign-up for our mailing list to be the first to take advantage of the discounted membership!
Alexander Berger (www.MasterChartsTrading.com)
Disclaimer, we have:
Open positions: LULU
New position: IBB, XSD, IWM, DUST
Closed position: SPY, EA


 RSS Feed