Friday, November 7 2014.
Weekly Market Recap Video Recap
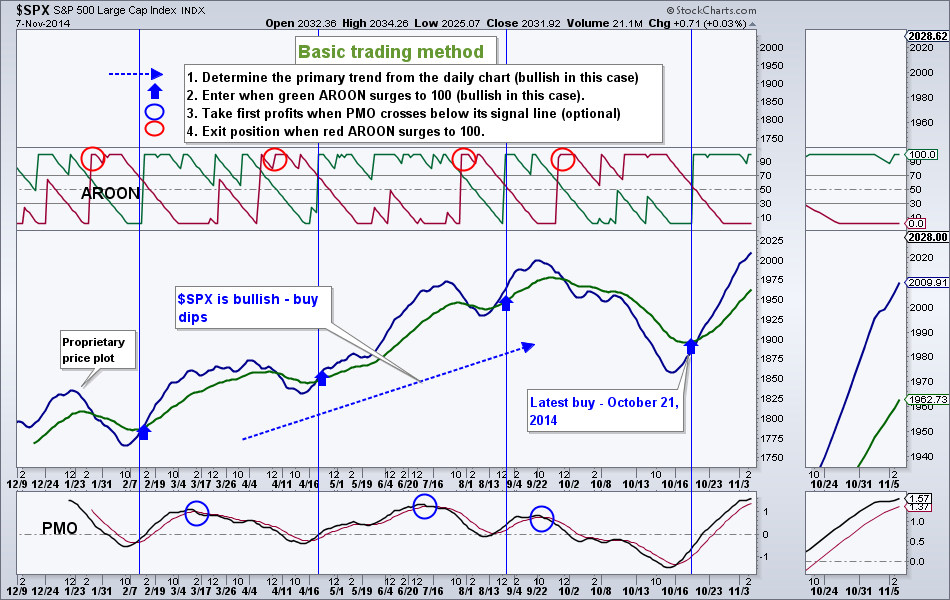
The Friday employment report was met with little enthusiasm by stock traders. Needless to say it was a very positive report: non-farm employment rose by 214,000, while the unemployment rate ticked down to 5.8%! Yet I did not observe a strong push higher by the stocks. Instead I saw a strong push higher by the bonds, indicating more fear and uncertainty.
Weekly Market Recap Video Recap
The Friday employment report was met with little enthusiasm by stock traders. Needless to say it was a very positive report: non-farm employment rose by 214,000, while the unemployment rate ticked down to 5.8%! Yet I did not observe a strong push higher by the stocks. Instead I saw a strong push higher by the bonds, indicating more fear and uncertainty.
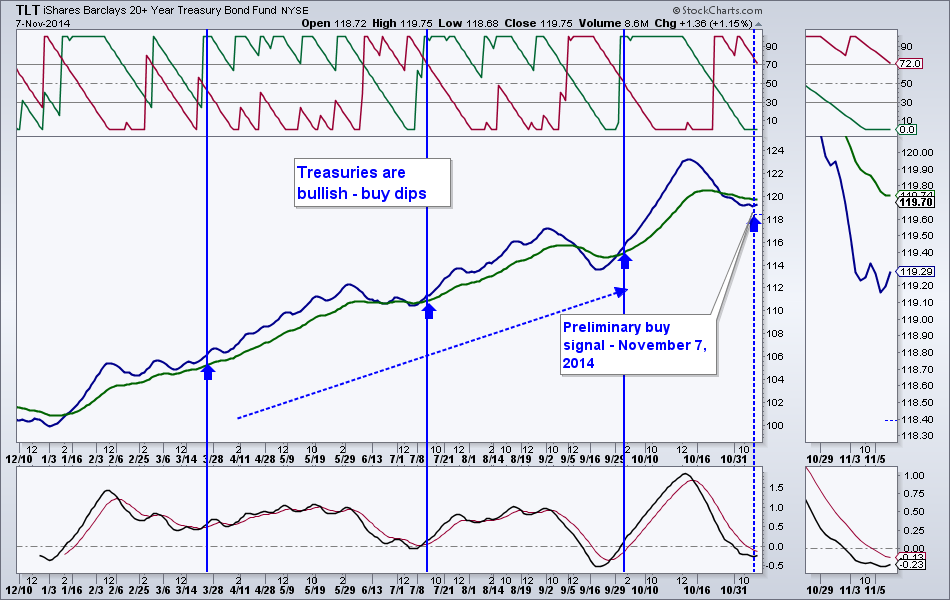
In fact the long-dated treasury fund, TLT, rose by 1.15% - quite a move by bond standards! Other bond funds also gained. AGG, a barometer of bond market, gained 0.34%. There is now a palpable buying pressure in the bond market. I went ahead and opened a position in AGG and a smaller one in TLT (TLT did not quite meet my criteria, but it may do so on Monday.)
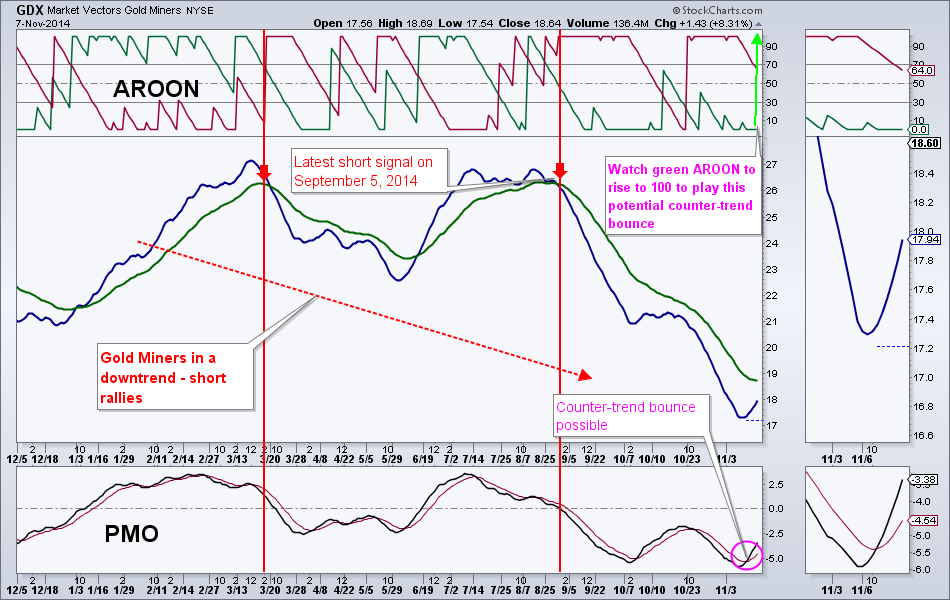
Gold miners showed some strength on Thursday and Friday. GDX is up over 10% over these 2 days. GDX is in a strong long-term downtrend, so I would need more confirmation before entering this counter-trend bounce. Watch green AROON on this chart to rise to 100 to play this potential counter-trend bounce.
Crude oil may have stopped falling after breaking support at around $79. There are some indications that it may rally from here. This means that a potential bear trap is developing. This happens when a security falls below a critical support level and then rallies from there.
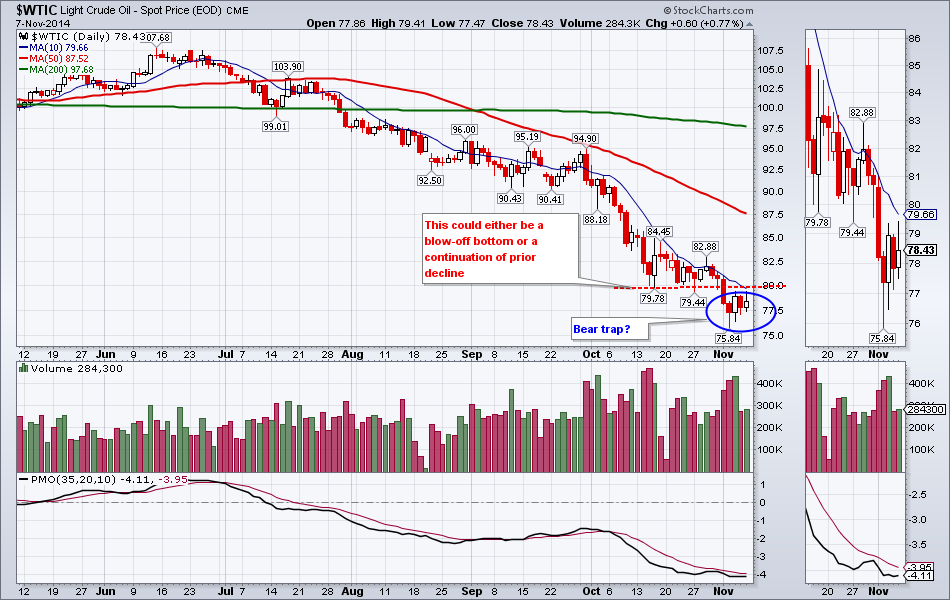
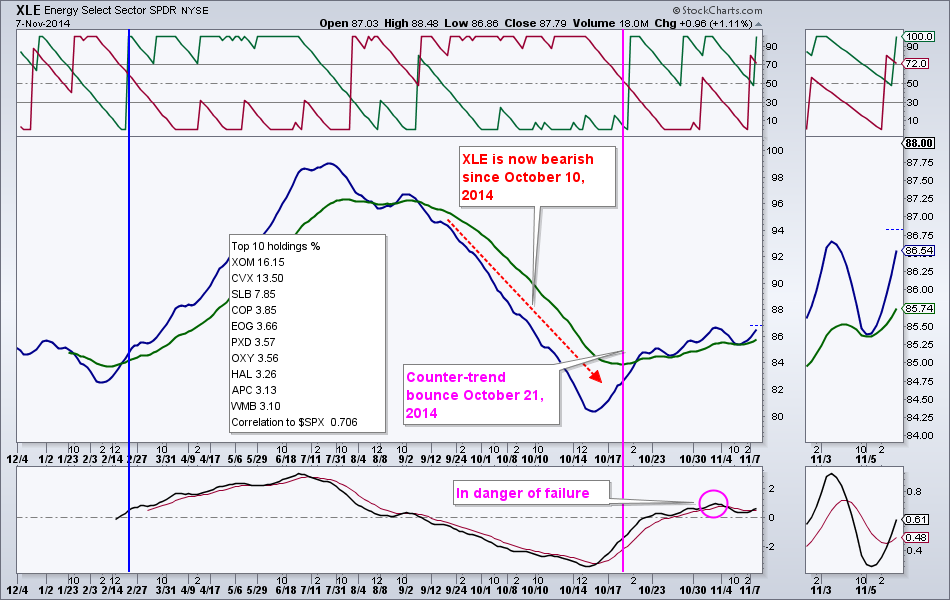
The reason I think that this may be a bear trap is because of the energy ETF performance, that I highlighted last week. XLE has been bearish since breaking important support on October 10 of this year. But it found its footing and rebounded along with the general market. While oil was making lower lows, XLE was already rebounding which makes me think that oil will follow suit higher.
That’s it for this week. Thank you for reading and listening and have another great trading week!
Best Regards,
Alexander Berger (www.MasterChartsTrading.com)
Disclaimer we have open positions in: SPY, AGG, TLT and XLE.
Best Regards,
Alexander Berger (www.MasterChartsTrading.com)
Disclaimer we have open positions in: SPY, AGG, TLT and XLE.


 RSS Feed