|
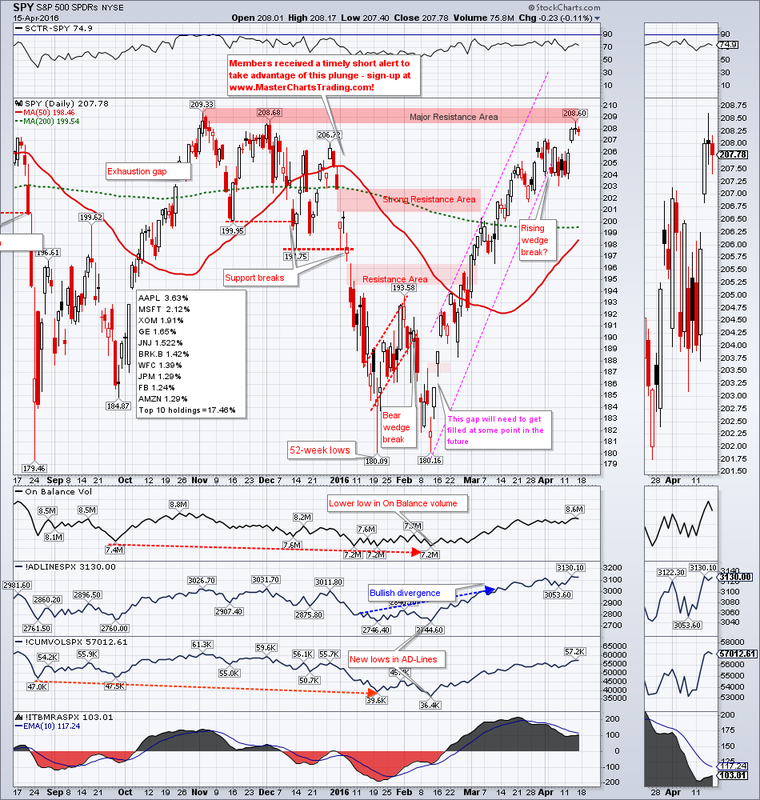
Another tough week for the bears. Stocks gapped-up on Wednesday above the recent highs. SPY hit the high for the move on Thursday, and touched a major resistance in the 208-209 area. Bulls, especially those that bought back in February, are probably feeling very good right now since they are sitting on an about 15% gain. Could we gap above this resistance and simply make another all-time high? Absolutely! But after such a strong rally some sort of a retracement or a pullback is highly likely.
CHART OF SPY |
|
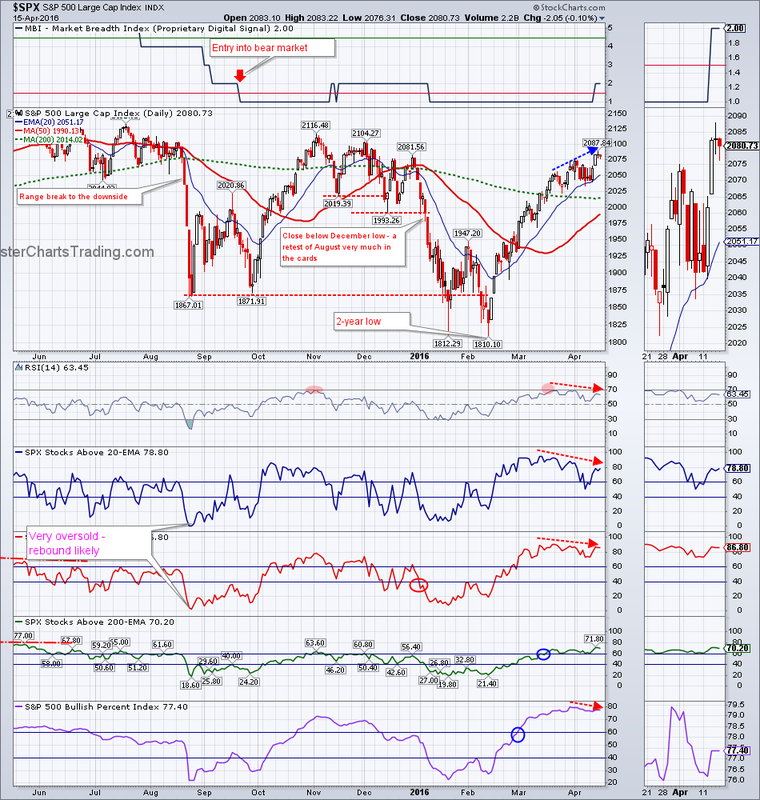
Bearish divergences are now appearing on the various charts of major indices. RSI on $SPX chart has made a lower high relative to March peak, while the index itself made a higher high. Additionally several of the market breadth indicators are trending lower, while the index is pushing higher. This is indicative of fewer and fewer stocks carrying the index higher.
My long-term model stock market model (MBI) has flipped into the bear mode as early as September of last year and is yet to even begin improving. By extension I have a bearish outlook.
CHART OF $SPX
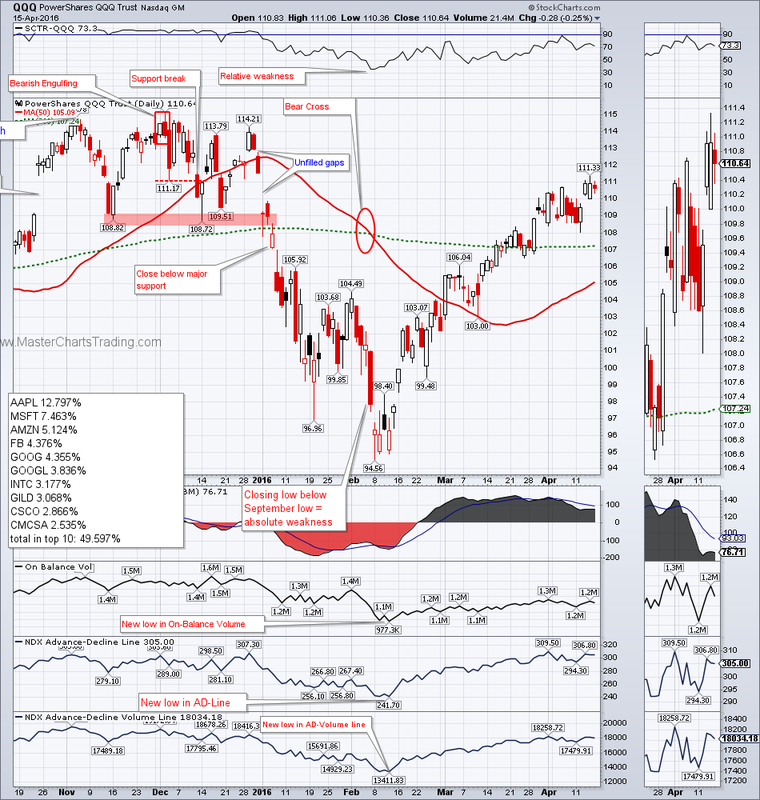
Similar divergences are appearing on the chart of NASDAQ 100.
CHART OF QQQ
My long-term model stock market model (MBI) has flipped into the bear mode as early as September of last year and is yet to even begin improving. By extension I have a bearish outlook.
CHART OF $SPX
Similar divergences are appearing on the chart of NASDAQ 100.
CHART OF QQQ
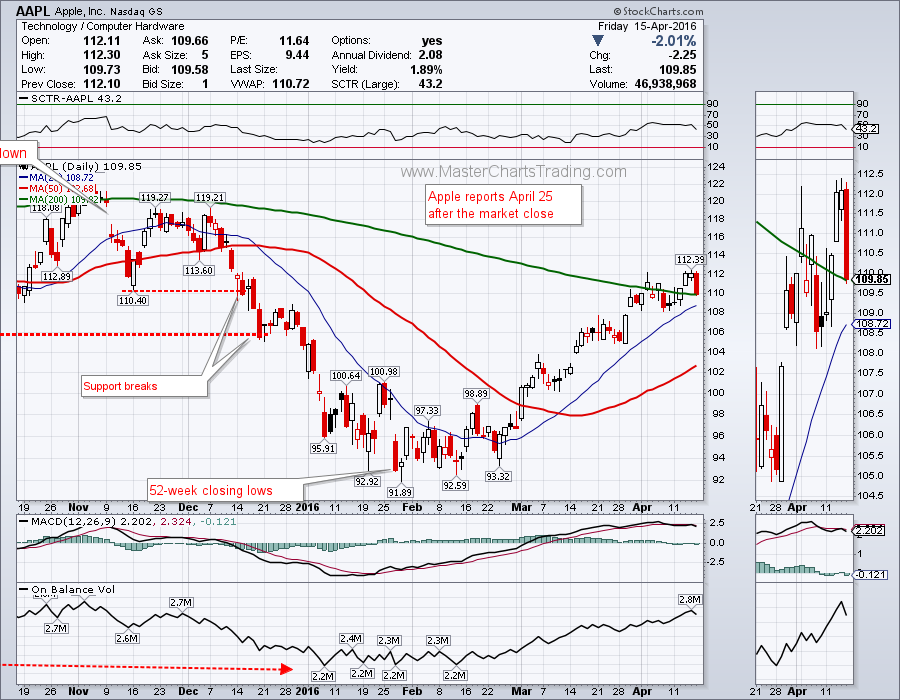
Interestingly, AAPL dropped over 2% today. In my opinion AAPL is bearish, so this could be a prelude to the earnings report coming out April 25th.
CHART OF AAPL
CHART OF AAPL
Bonds
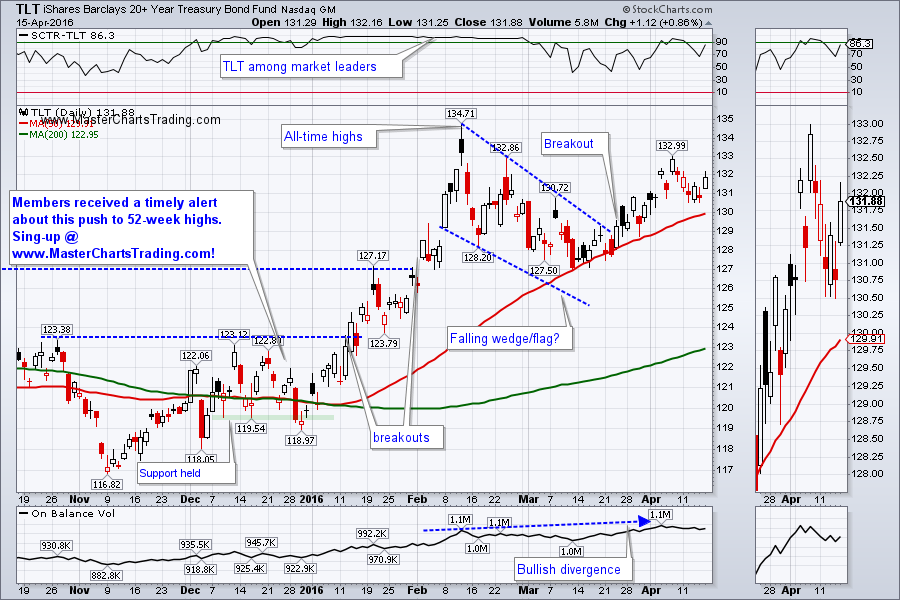
TLT corrected from February all-time highs into March. It then held support at the 50-day moving average and bounced higher. There is now a very good chance that TLT will attempt to re-challenge the all-time highs again. This is indicative of risk aversion by investors.
CHART OF TLT
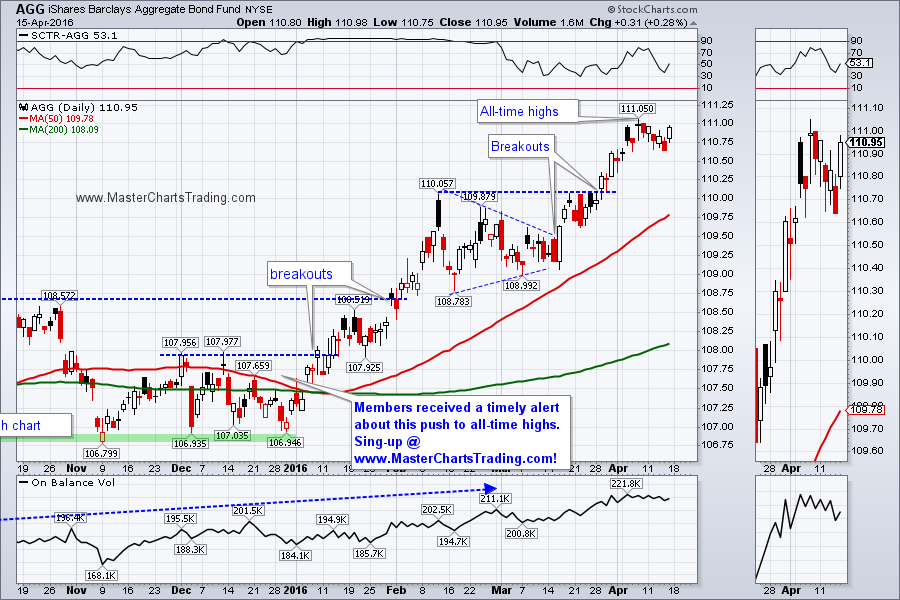
AGG is looking even more bullish as it consolidates near all-time highs.
CHART OF AGG.
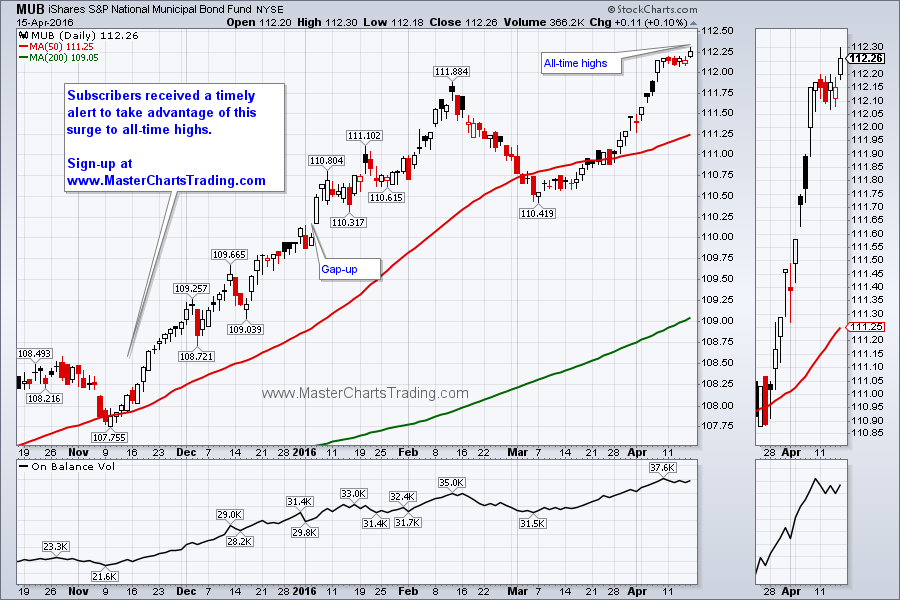
Municipal bonds are acting even stronger as MUB hit an all-time high on Friday and then managed to close at an all-time closing high. This is very bullish and is showing strong buying interest and the presence of elevated levels of fear.
CHART OF MUB
TLT corrected from February all-time highs into March. It then held support at the 50-day moving average and bounced higher. There is now a very good chance that TLT will attempt to re-challenge the all-time highs again. This is indicative of risk aversion by investors.
CHART OF TLT
AGG is looking even more bullish as it consolidates near all-time highs.
CHART OF AGG.
Municipal bonds are acting even stronger as MUB hit an all-time high on Friday and then managed to close at an all-time closing high. This is very bullish and is showing strong buying interest and the presence of elevated levels of fear.
CHART OF MUB
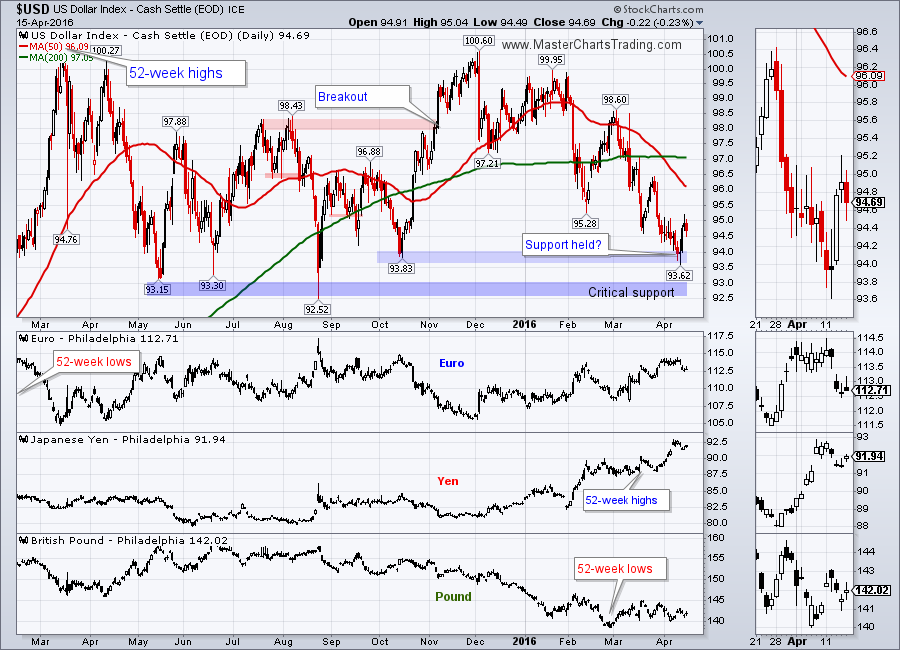
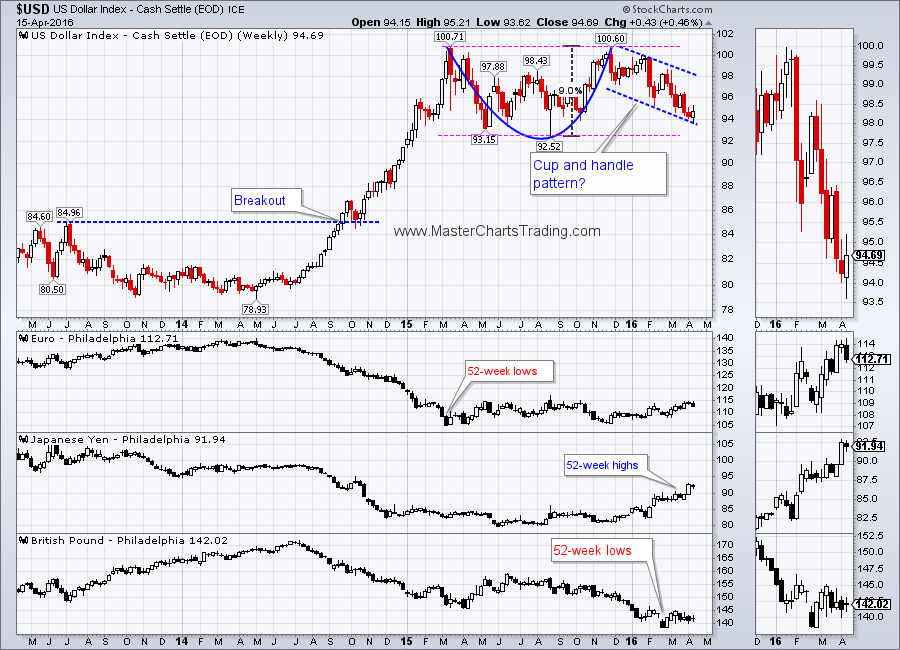
There is now a very good chance that the Dollar index has held support around the 93.60. Wednesday we saw a very strong day as the dollar gained against all major currencies. Could this mark a final reversal and the resumption of a giant uptrend that started back in 2014?
CHART OF $USD
LONG-TERM CHART OF $USD
CHART OF $USD
LONG-TERM CHART OF $USD
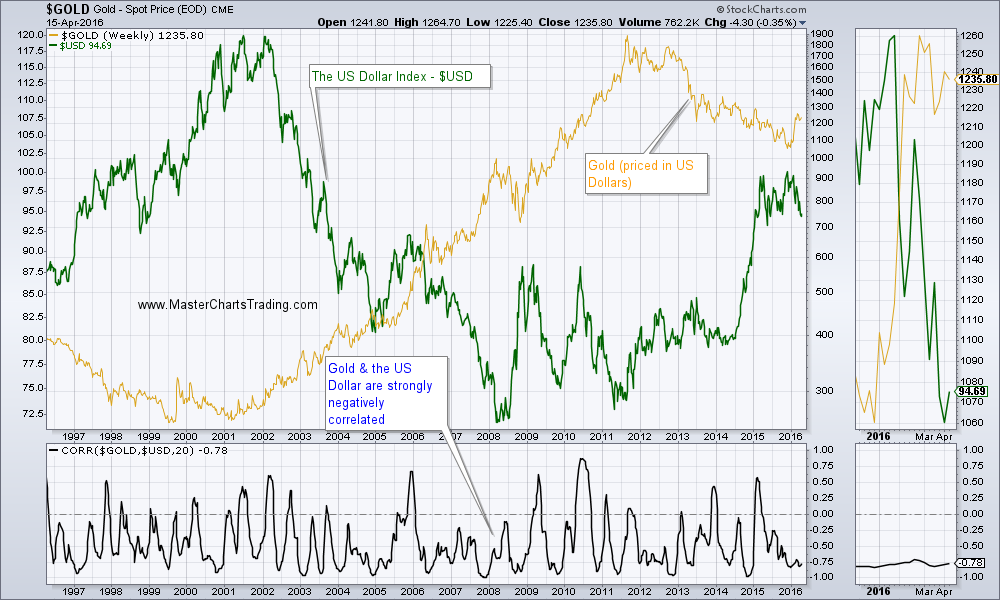
If the dollar bounces higher as I mentioned above, we could see a massive reversal for the precious metal complex. It is clear that gold and the US dollar are strongly inversely correlated
GOLD vs. US DOLLAR
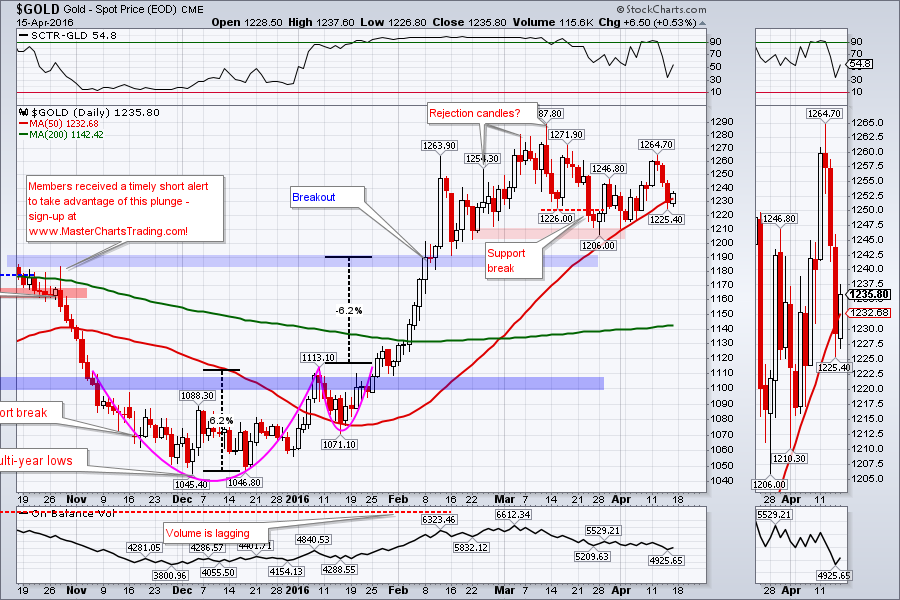
Few weeks ago I mentioned that my long-term gold model (GBI) has flipped into a bull market and I am now looking to buy gold and to trade it on the upside. However gold needs to correct quite a bit more for me to become interested opening a long. A retest of gold’s recent breakout could be upon us soon. $1191 is the level to watch.
GOLD CHART
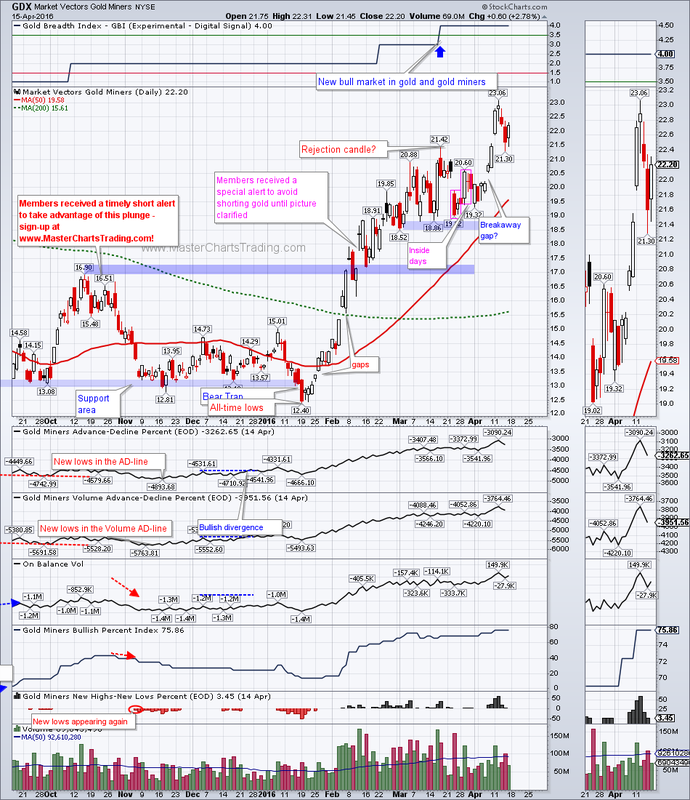
As with gold, GDX is overextended to the upside, so a pullback may provide for an opportunity to partake in this new bull market.
CHART OF GDX
GOLD vs. US DOLLAR
Few weeks ago I mentioned that my long-term gold model (GBI) has flipped into a bull market and I am now looking to buy gold and to trade it on the upside. However gold needs to correct quite a bit more for me to become interested opening a long. A retest of gold’s recent breakout could be upon us soon. $1191 is the level to watch.
GOLD CHART
As with gold, GDX is overextended to the upside, so a pullback may provide for an opportunity to partake in this new bull market.
CHART OF GDX
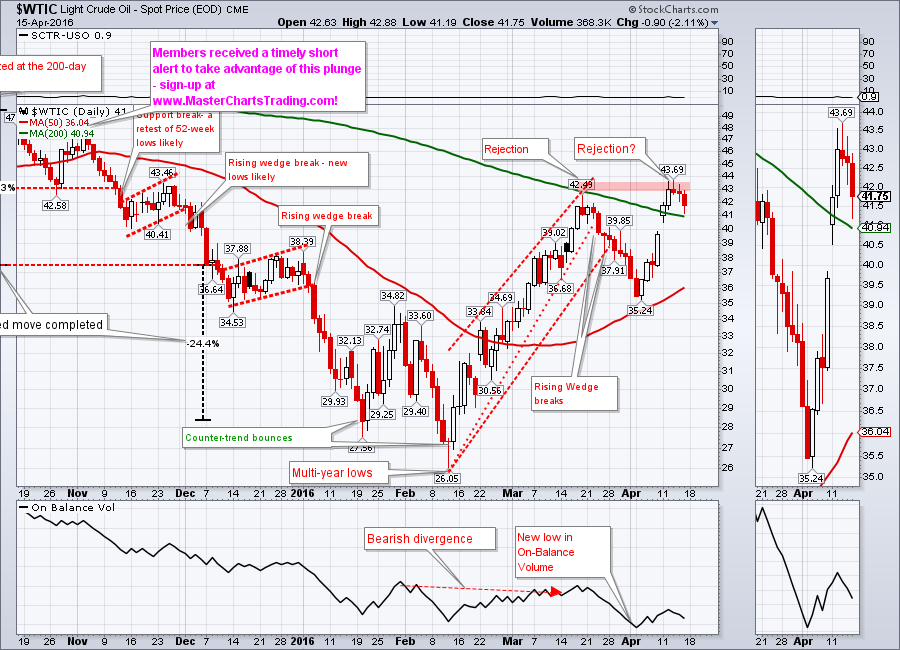
Oil was pulled and pushed around by the various geo-political and market forces. We just witnessed a wave up to the previous rejection level at around $43. Would oil again be rejected there? If yes, we could easily pull back to the 50-day moving average around $36 and possibly lower.
CHART OF $WTIC
CHART OF $WTIC
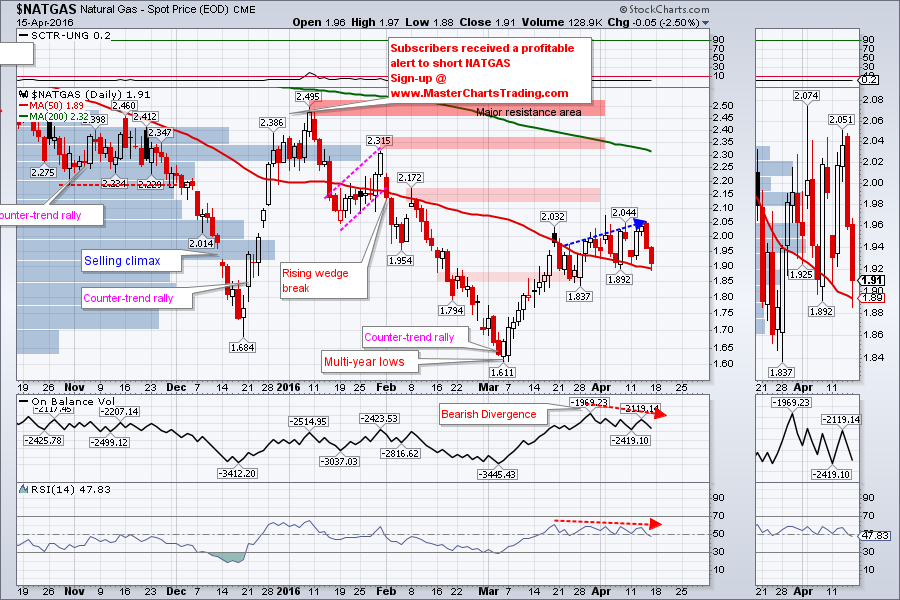
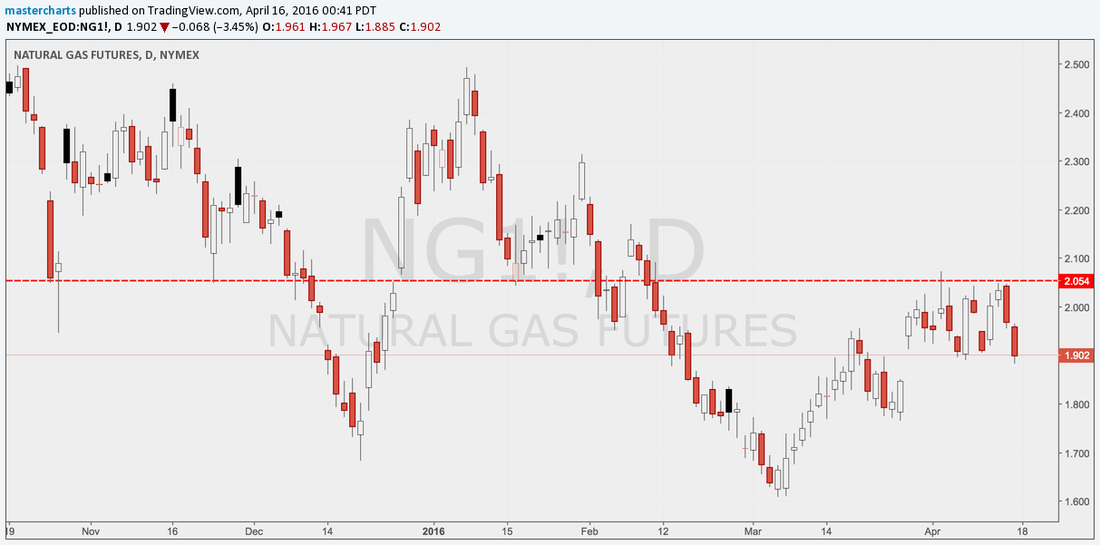
I still think of NATGAS as a bearish security, so I am only looking for bearish setups and to trade on the short side. NATGAS rebounded off the multi-year lows set in March and so far has stalled in the 2.04 area. Additionally chart of NATGAS is showing bearish divergences on both the volume and the momentum indicators. Whether or not they will work out remains to be seen.
CHART OF NATGAS
CHART OF NATGAS
Trade Alerts Service is now live – please sign-up here!
That’s it for this week’s market recap,
Best Regards and have another great trading week!
Alexander Berger (www.MasterChartsTrading.com)
That’s it for this week’s market recap,
Best Regards and have another great trading week!
Alexander Berger (www.MasterChartsTrading.com)


 RSS Feed