|
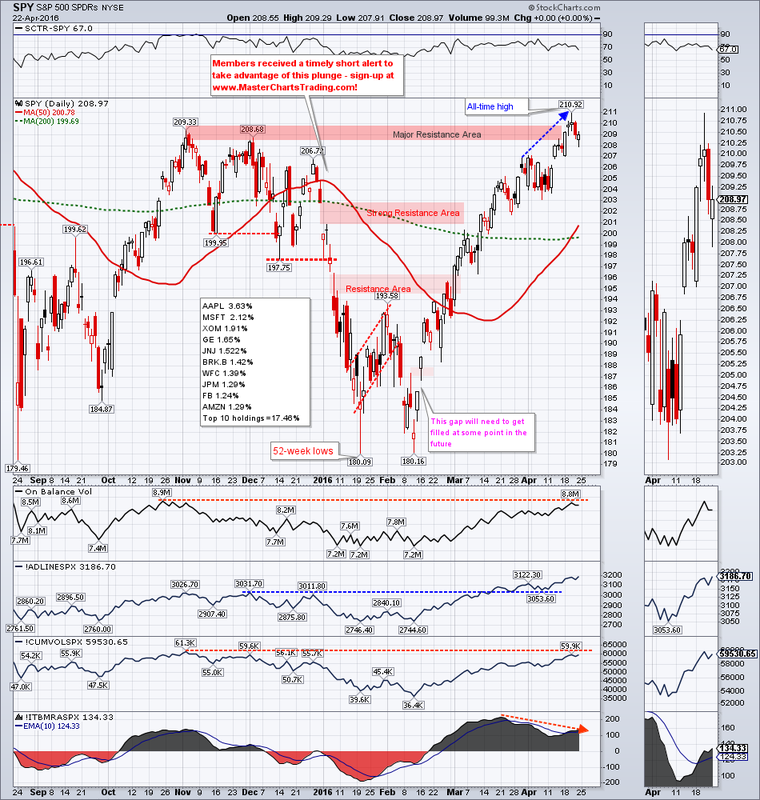
Signs of selling appeared on Wednesday and continued into Friday. SPY gained about ½ of percent to end the week at 208.97. This rally that started in February has probably overstayed its welcome and profit taking is likely to commence. Profit taking implies some sort of a corrective action. Whether or not this coming correction is going to turn into a rout remains to be seen.
CHART OF SPY |
|
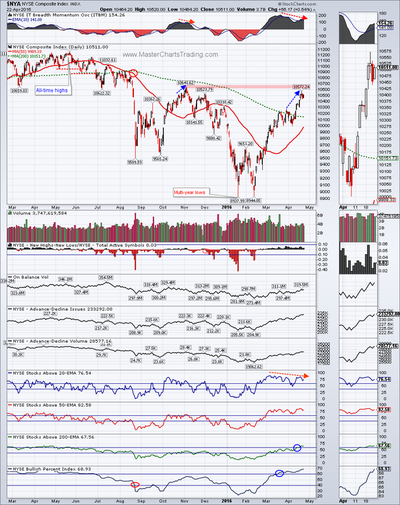
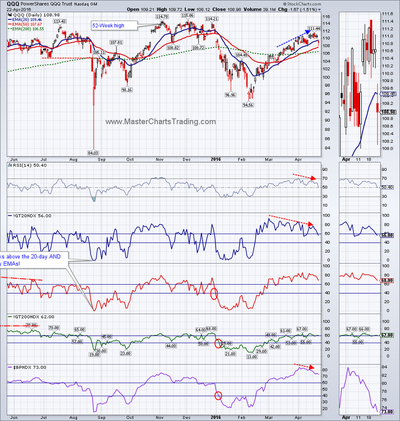
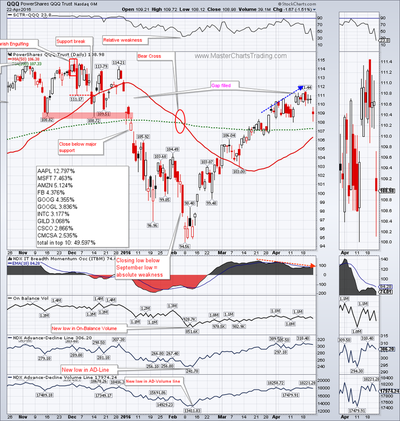
Similar divergences are appearing on the charts of NASDAQ 100 and the New York Stock Exchange Composite ($NYA).
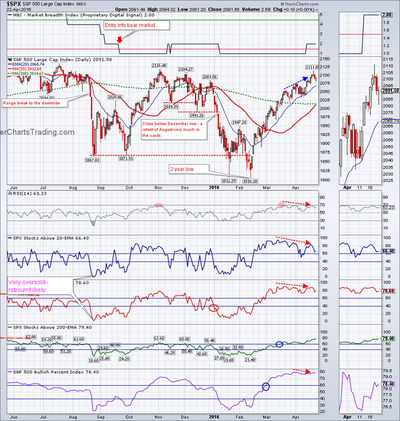
CHART OF $SPX
CHART OF QQQ
CHART OF QQQ with breadth
CHART OF $NYA
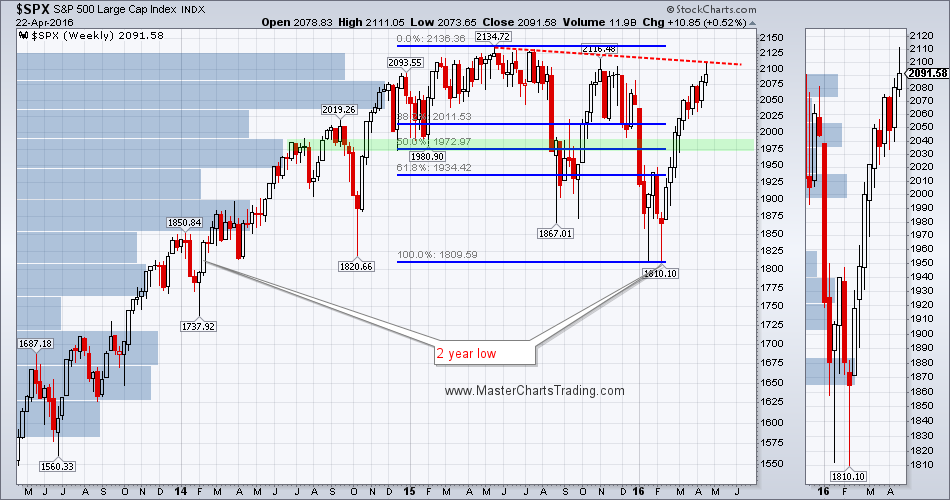
CHART OF $SPX with Fibonacci retracements
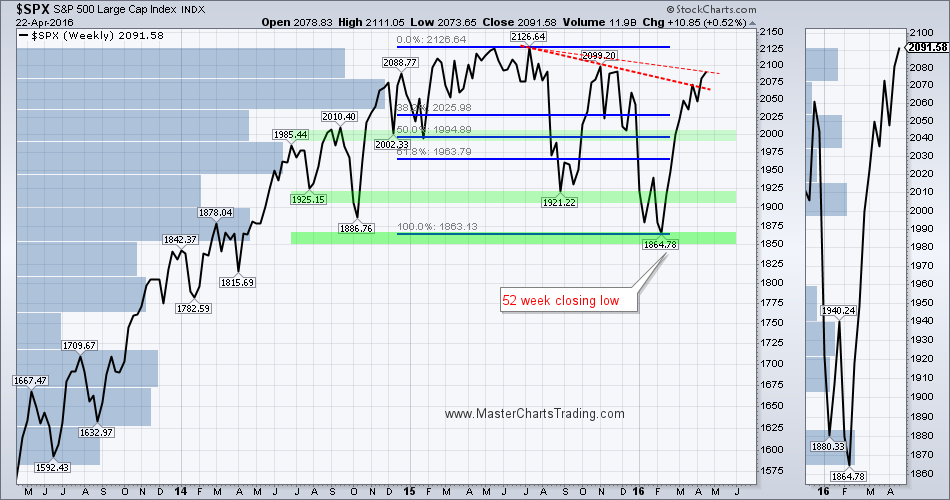
CLOSE ONLY CHART OF $SPX with Fibonacci retracements
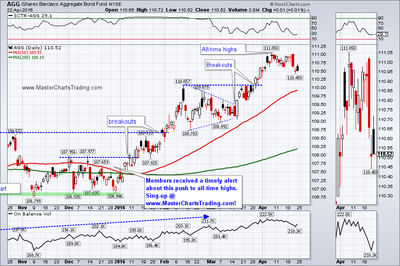
AGG is looking even more bullish as it consolidates near all-time highs. AGG is generally much less volatile then TLT
CHART OF AGG.
LONG-TERM CHART OF AGG
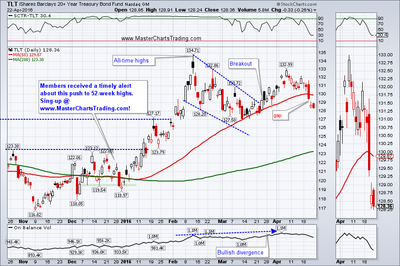
CHART OF TLT
LONG-TERM TLT CHART
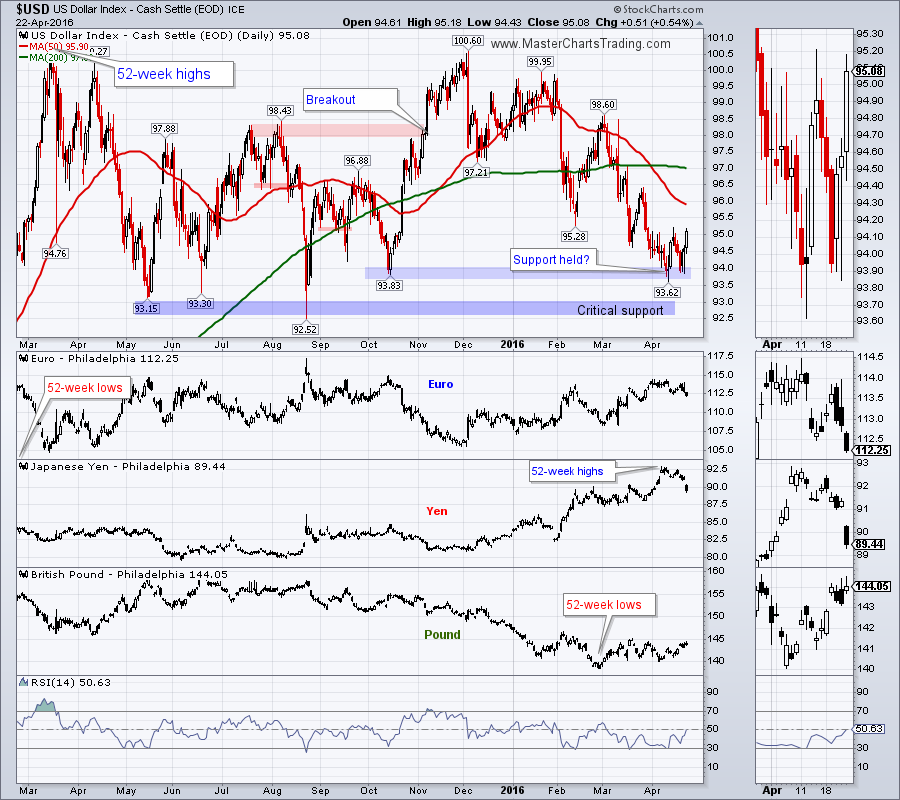
CHART OF $USD
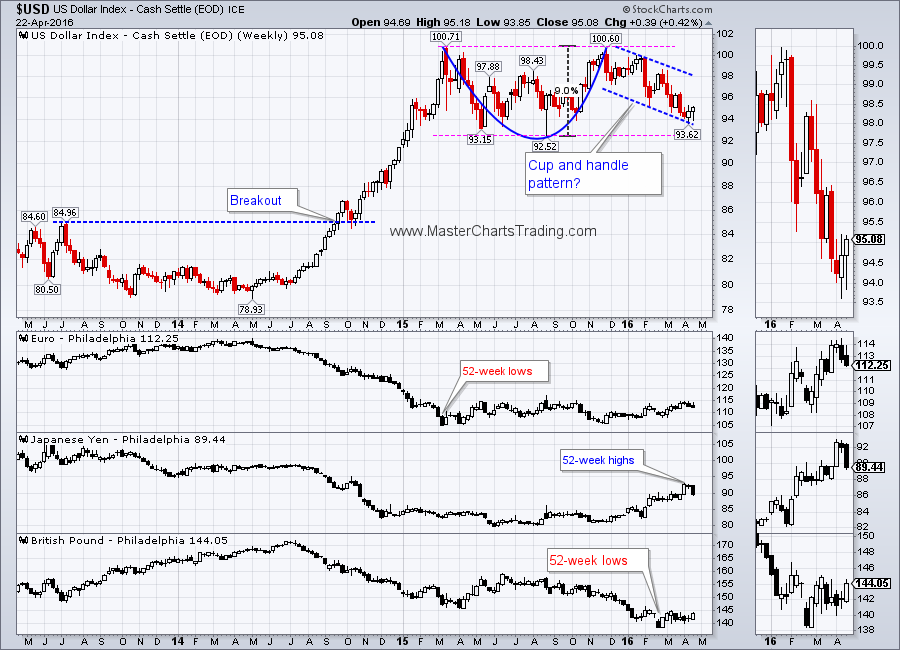
LONG-TERM CHART OF $USD
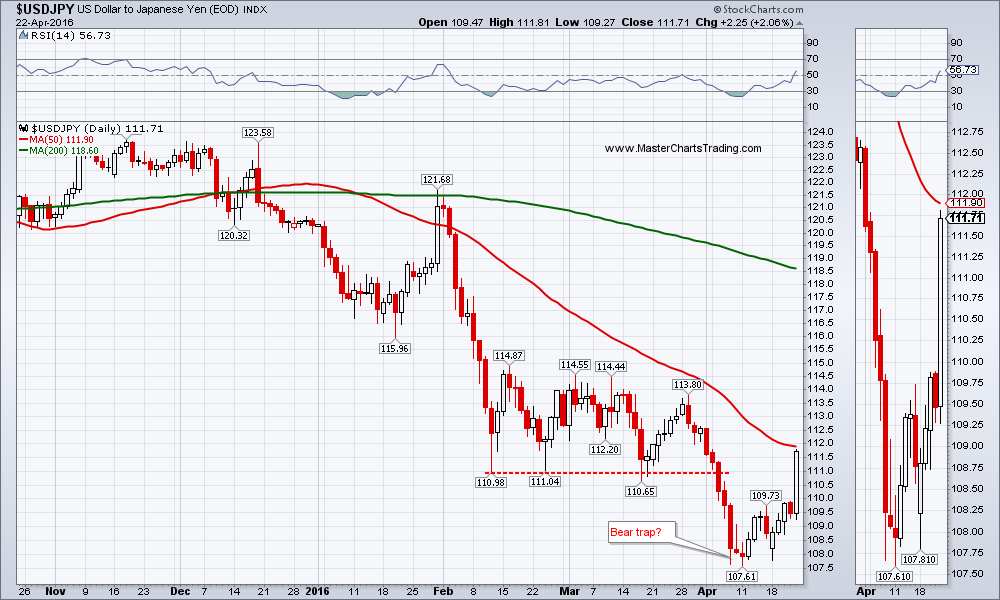
CHART OF USDJPY
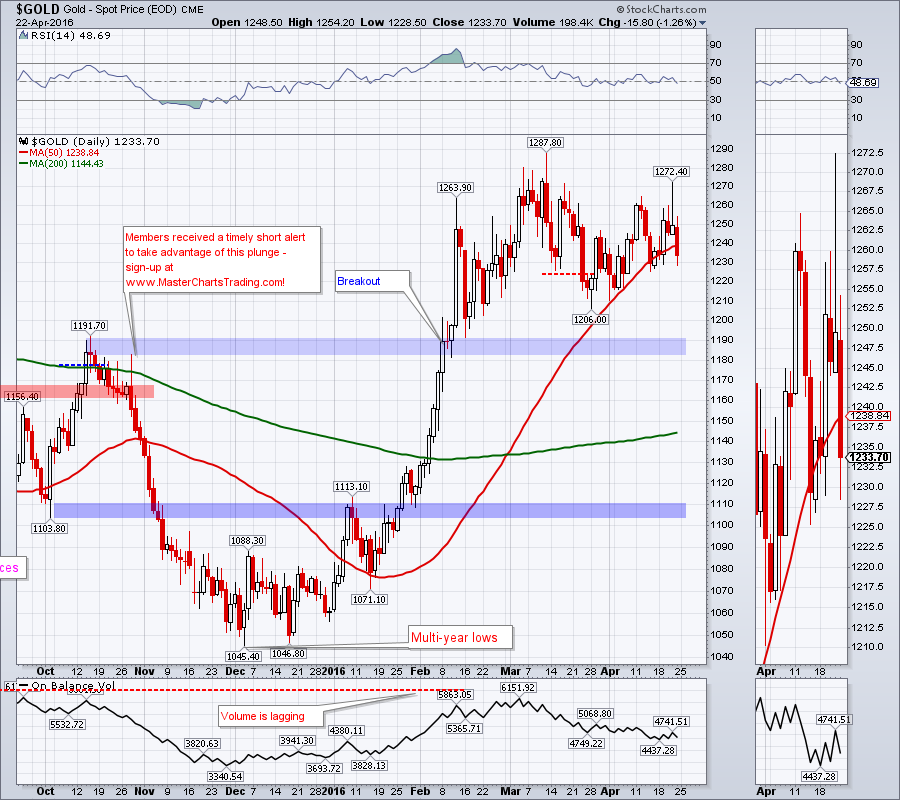
…No major changes in the long-term gold posture, so I am quoting:
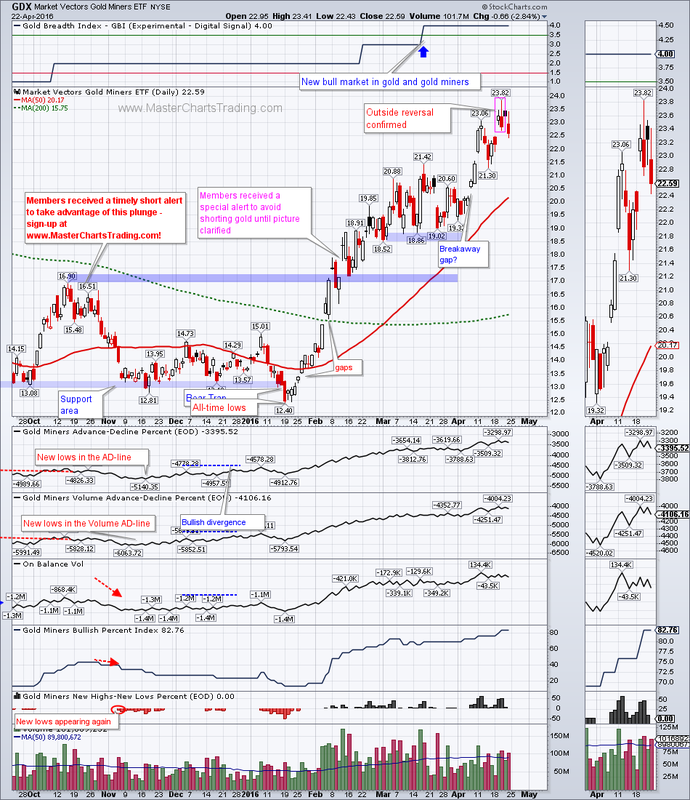
“Few weeks ago I mentioned that my long-term gold model (GBI) has flipped into a bull market and I am now looking to buy gold and to trade it on the upside. However gold needs to correct quite a bit more for me to become interested opening a long. A retest of gold’s recent breakout could be upon us soon. $1191 is the level to watch.”
GOLD CHART
CHART OF GDX
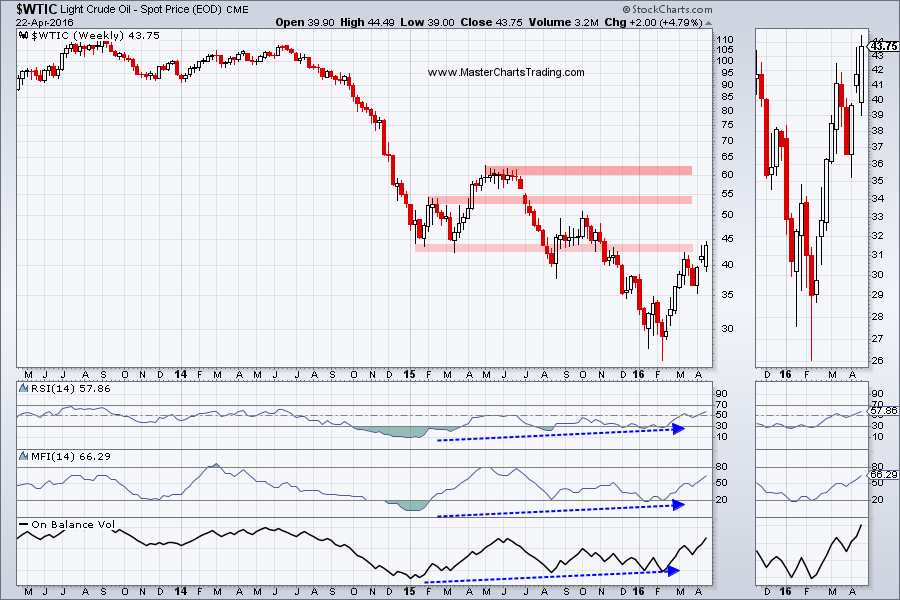
LONG-TERM CHART OF $WTIC
CHART OF $WTIC
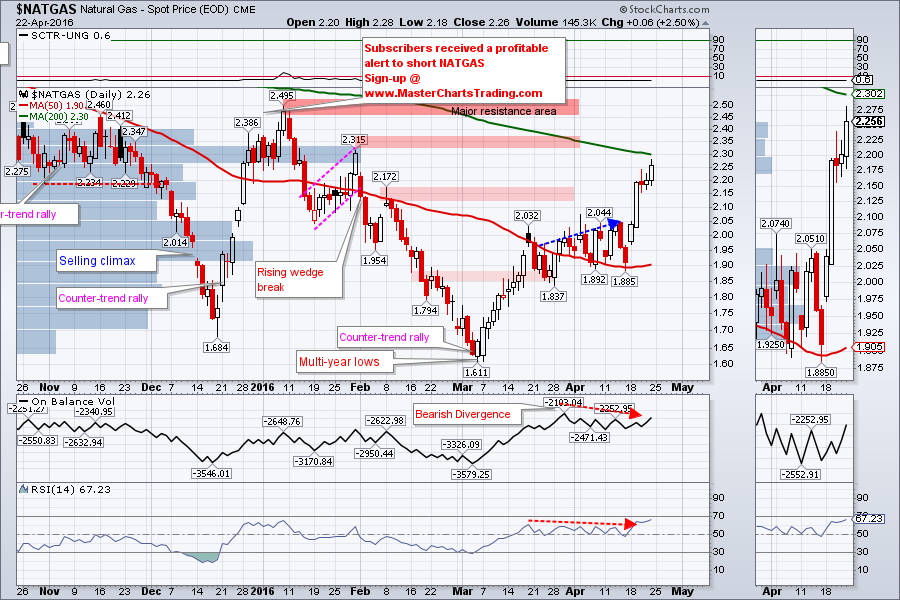
CHART OF NATGAS
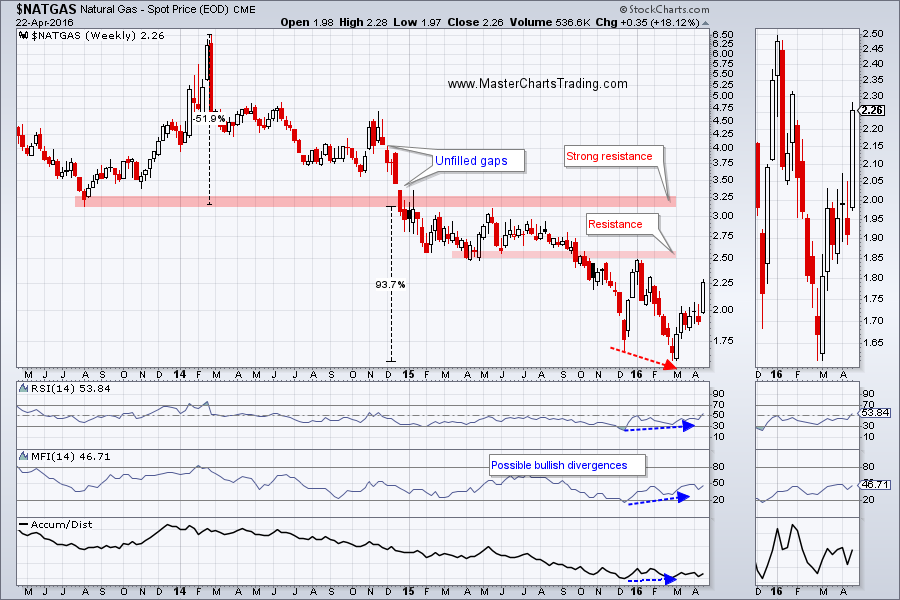
LONG-TERM CHART OF NATGAS
That’s it for this week’s market recap,
Best Regards and have another great trading week!
Alexander Berger (www.MasterChartsTrading.com)


 RSS Feed