|
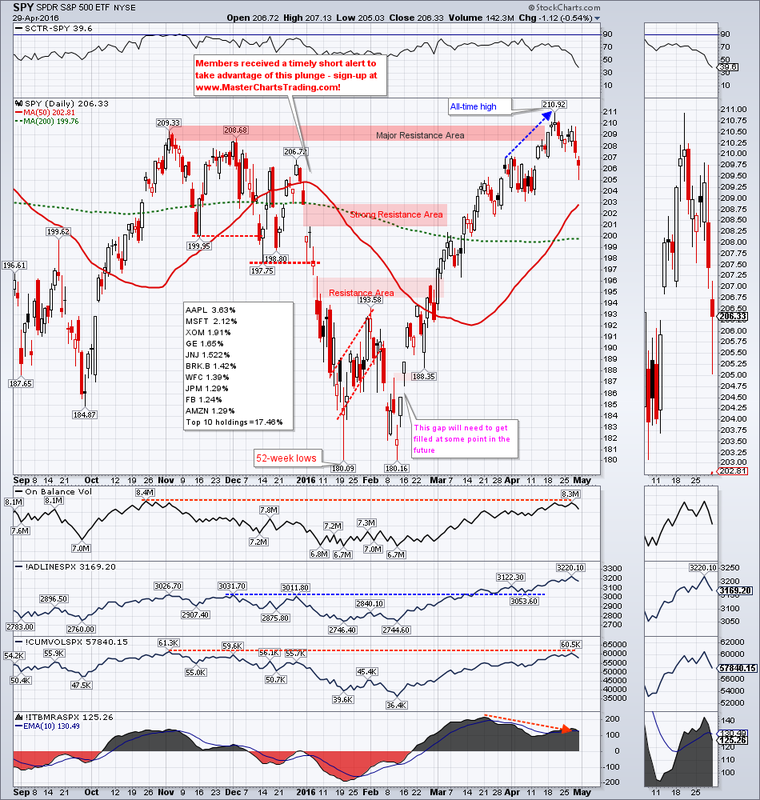
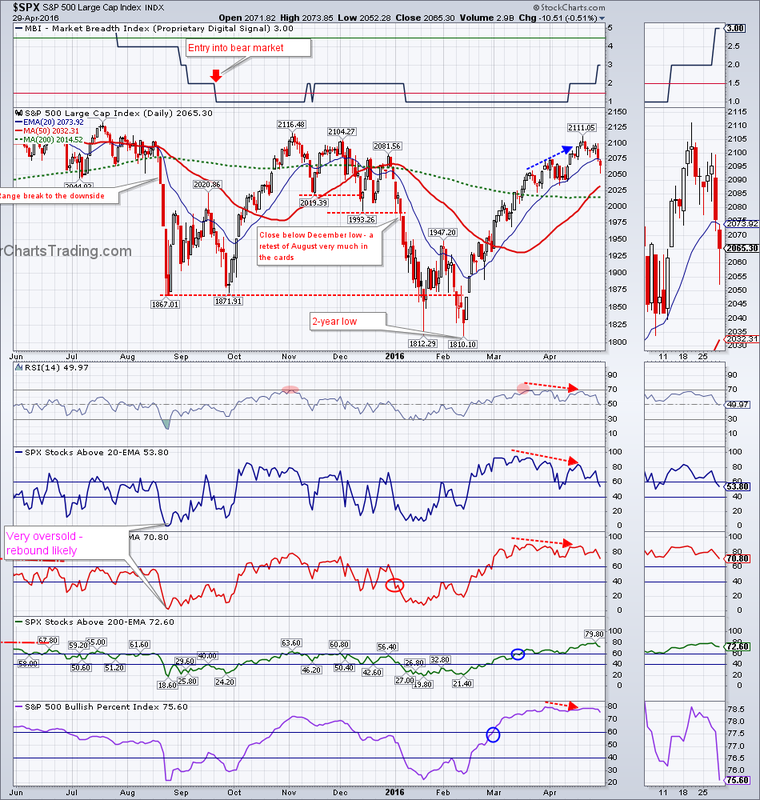
Last week I mentioned that there were numerous divergences present on the charts of major stock indices. It now seems that these bearish divergences are working out. For the week $SPX lost a little over 1% to close at 2065.30. Stocks are somewhat oversold on the short-term basis, so a snap-back rally would not surprise me at this point.
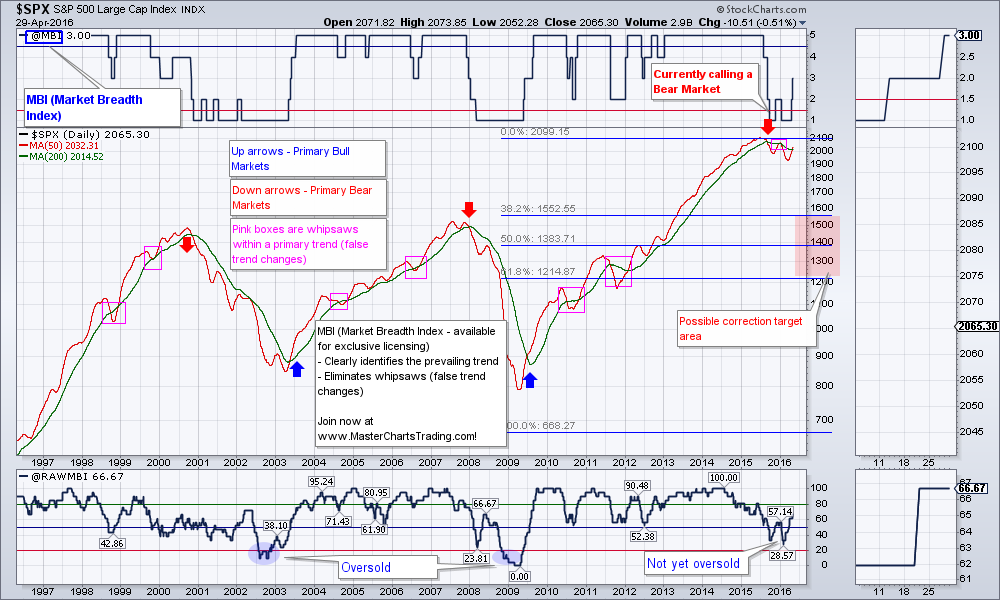
CHART OF SPY CHART OF $SPX |
|
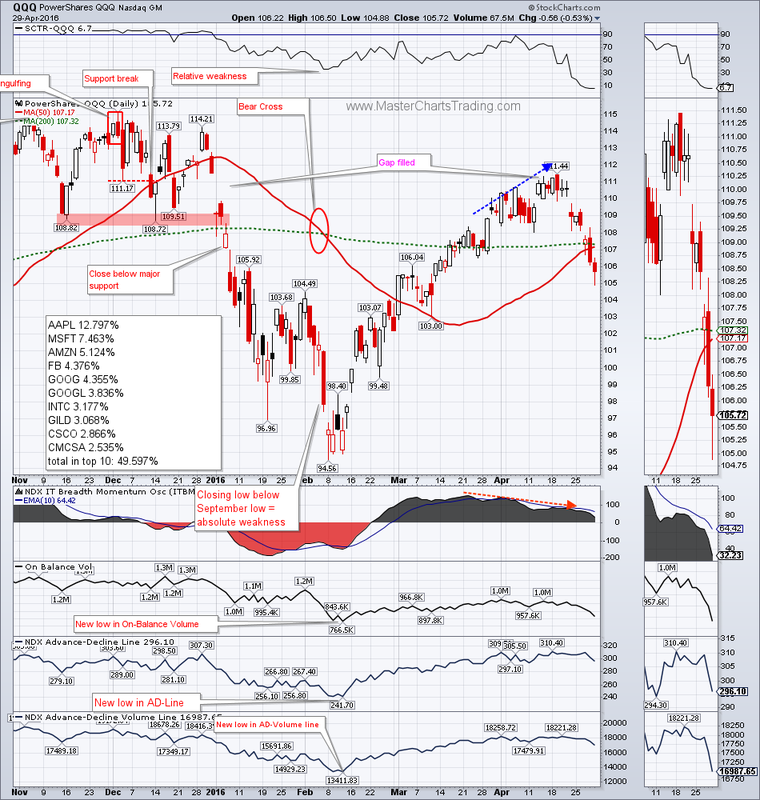
CHART OF QQQ
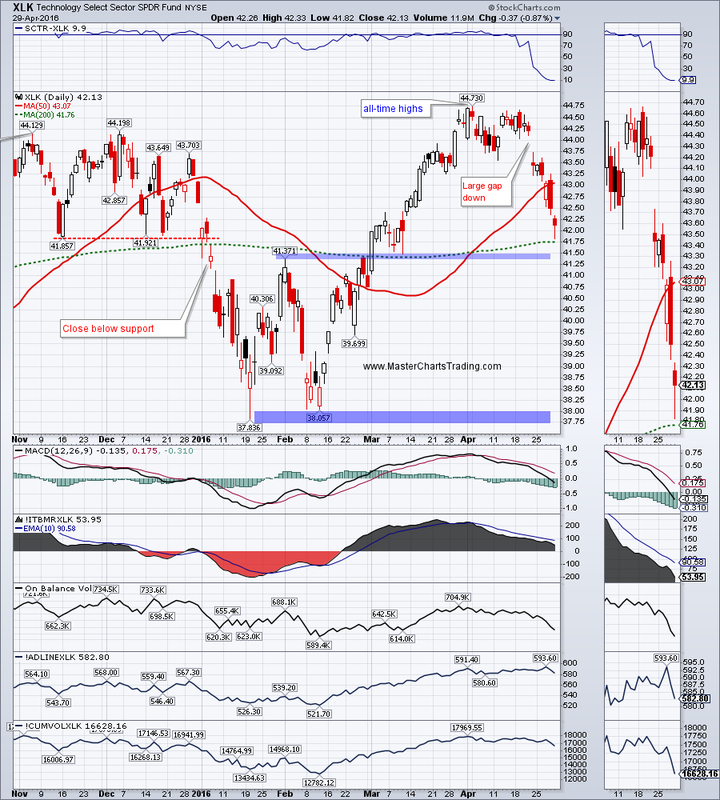
CHART OF XLK
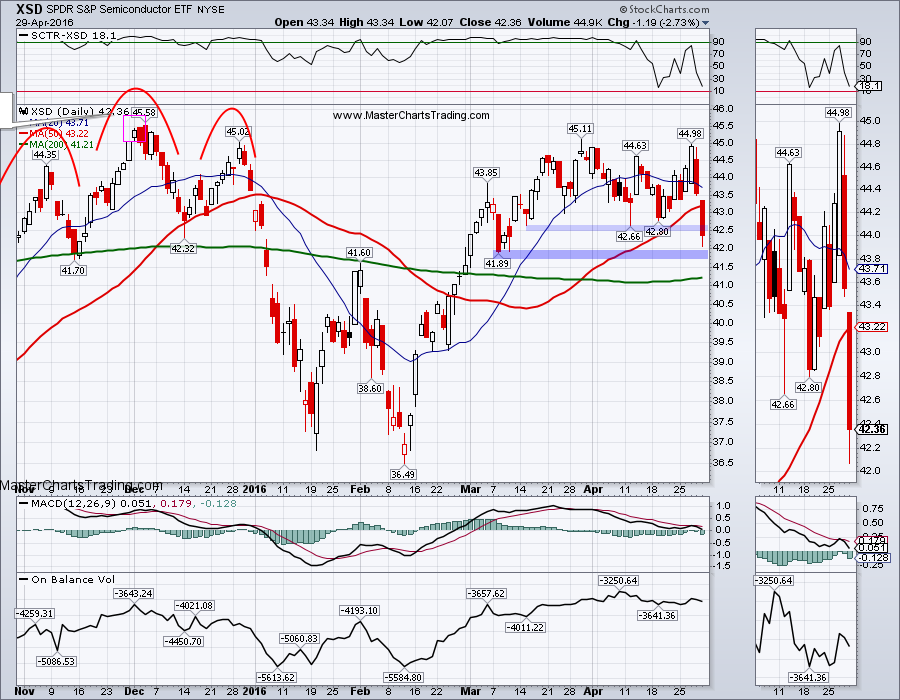
CHART OF XSD (semiconductors)
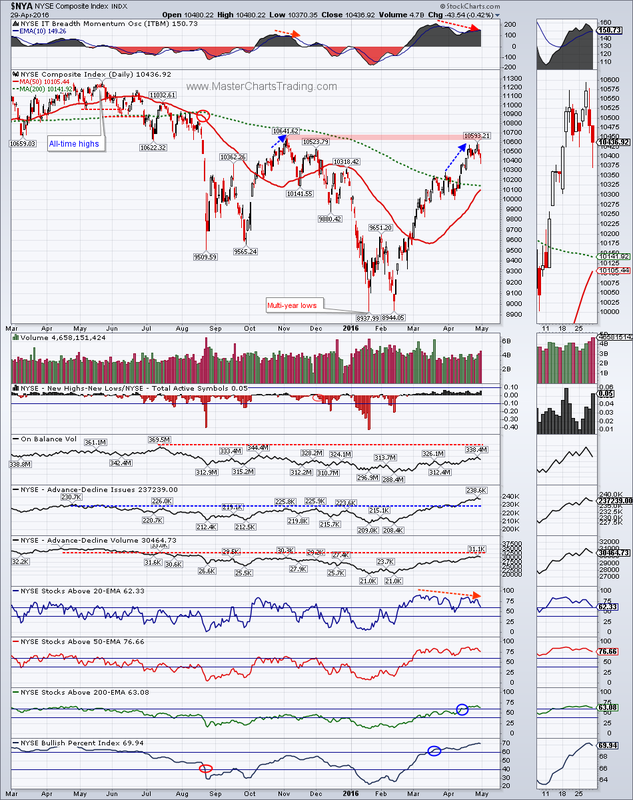
CHART OF $NYA
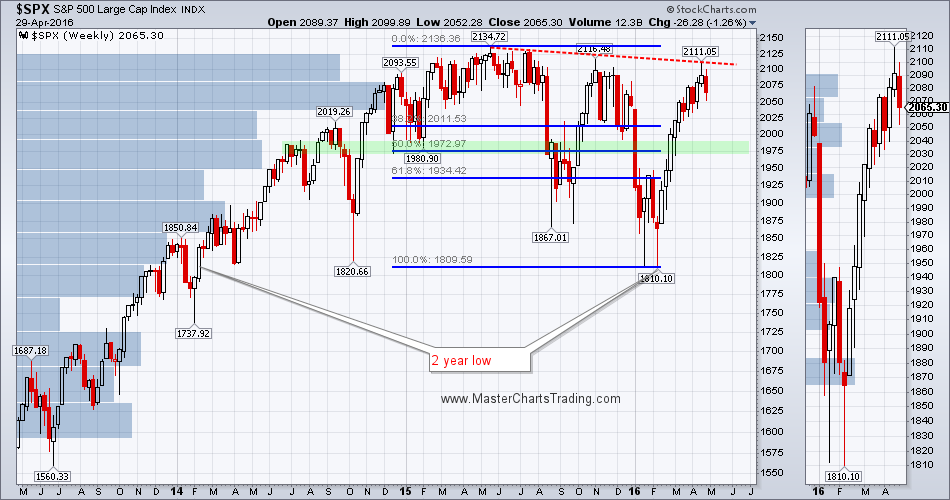
CHART OF $SPX with Fibonacci retracements
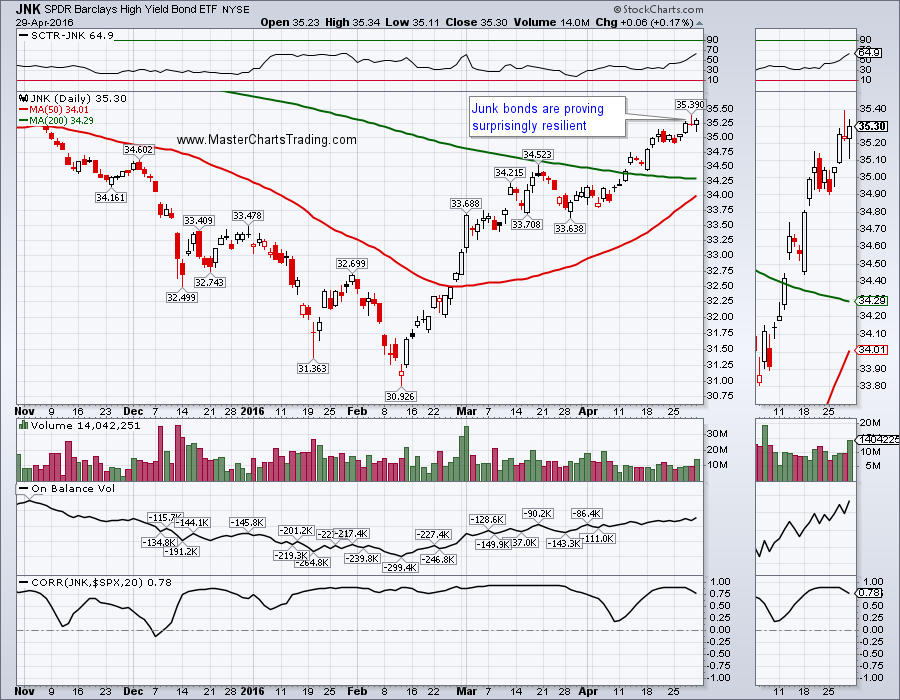
CHART OF JNK
Long-term chart of TLT still shows a giant Cup and Handle pattern. A breakout above the pattern high at $134 would be extremely bullish for bonds and bearish for stocks.
The more diversified bond fund AGG is consolidating near the all-time highs and looks poised to re-challenge them again. Should stocks come under more selling, AGG is likely to benefit.
CHART OF TLT
LONG-TERM TLT CHART
CHART OF AGG.
LONG-TERM CHART OF AGG
The US Dollar index came under serious pressure against major currencies and ended the week over 2% lower. USD is now at a critical support marked on the chart below. A break of that level could spell an even more significant downside correction for USD.
USDJPY FOREX PAIR
CHART OF $USD
LONG-TERM CHART OF $USD
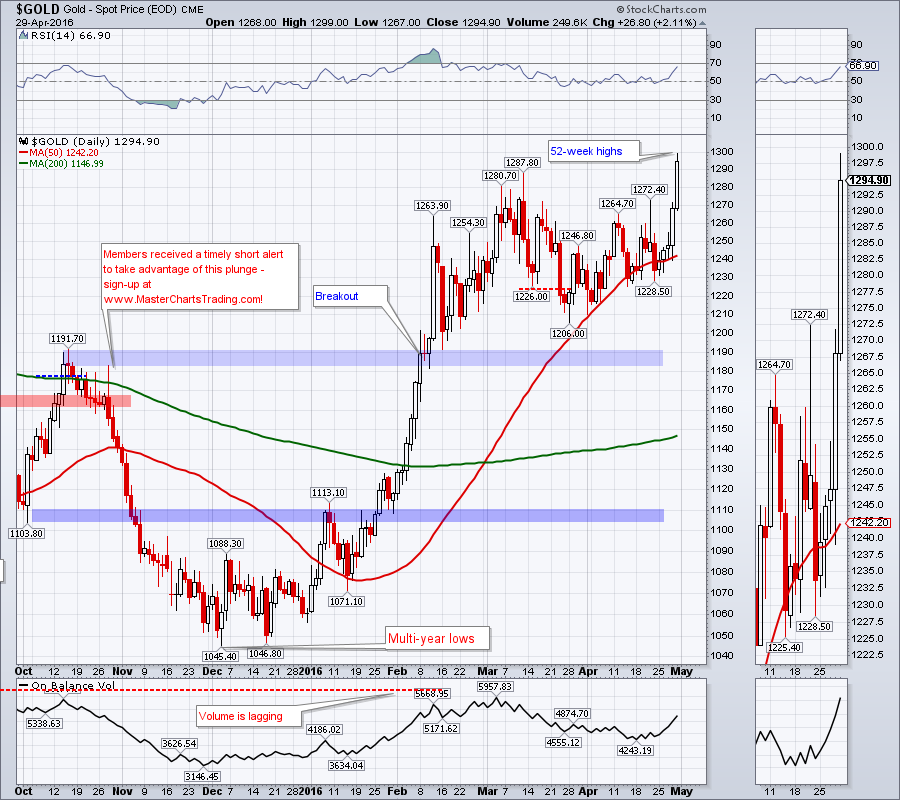
Few weeks ago I mentioned that my long-term gold model (GBI) has flipped into a bull mode and I am now looking to buy gold and to trade it on the upside. However gold needs to correct quite a bit more for me to become interested opening a long.
GOLD CHART
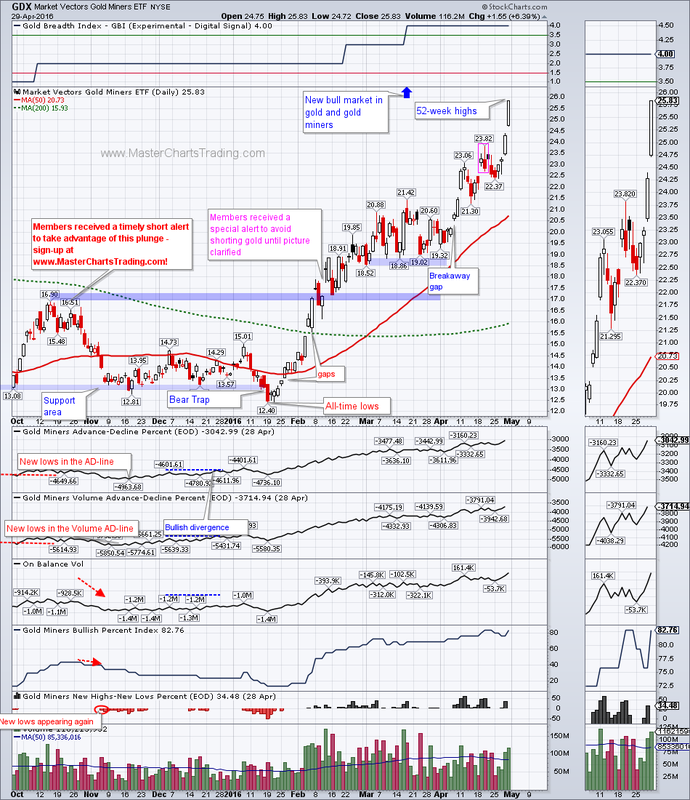
Same comments apply to the gold miners ETF. GDX is enjoying the benefits of a weaker dollar as it moved over 100% off the all-time lows set in January. It is certainly overbought by pretty much any definition of this word, but at the same time it is showing strength. I consider GDX to now be a bullish security and also am looking to buy on a pullback.
CHART OF GDX
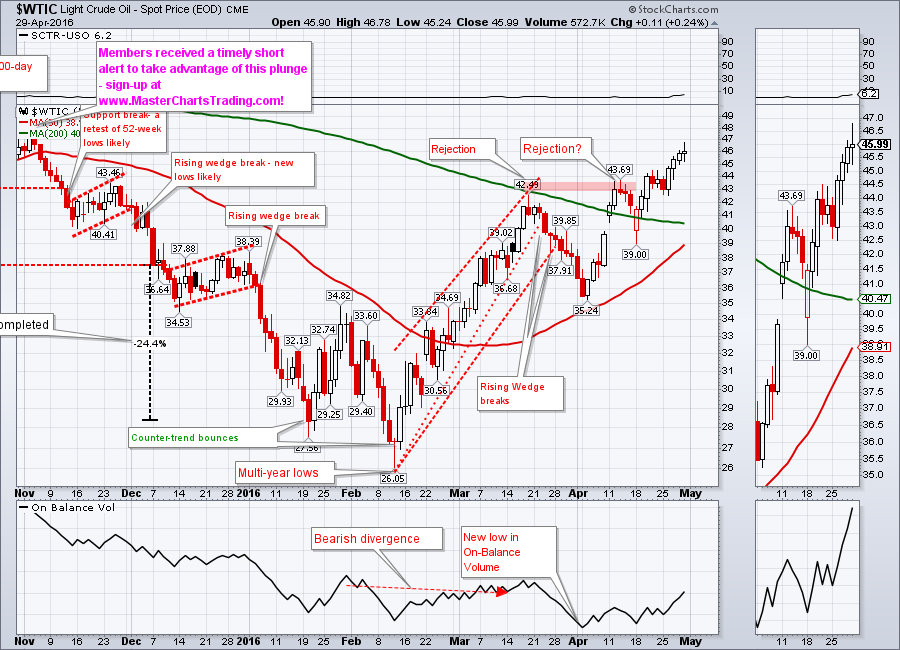
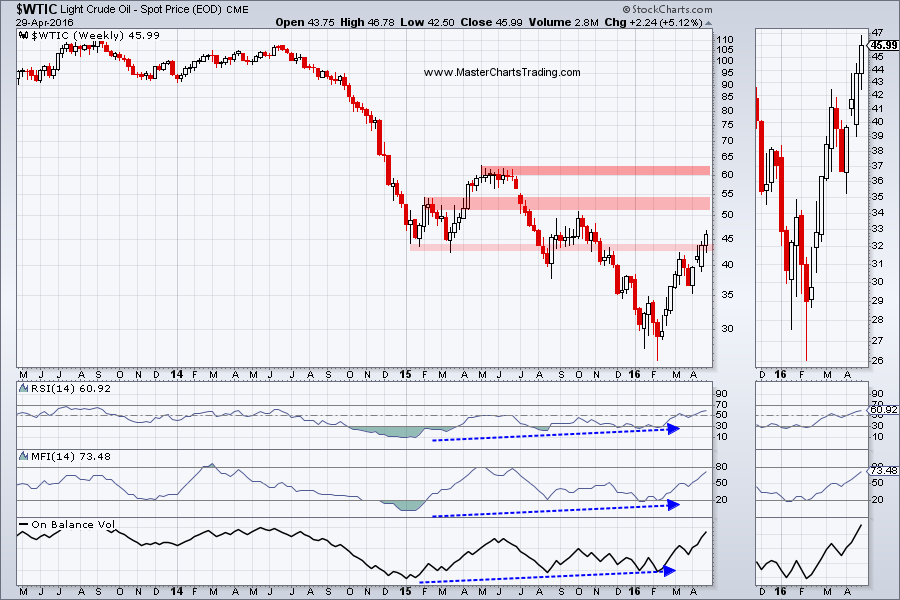
Picture in oil is somewhat ambiguous, so I would wait for a resolution either to the upside or the downside before attempting to trade it.
LONG-TERM CHART OF $WTIC
CHART OF $WTIC
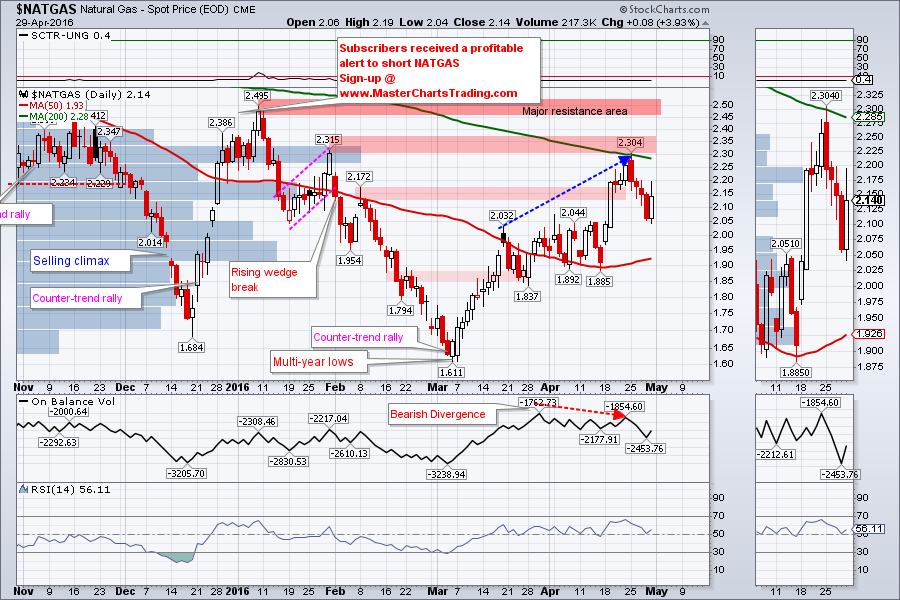
CHART OF NATGAS
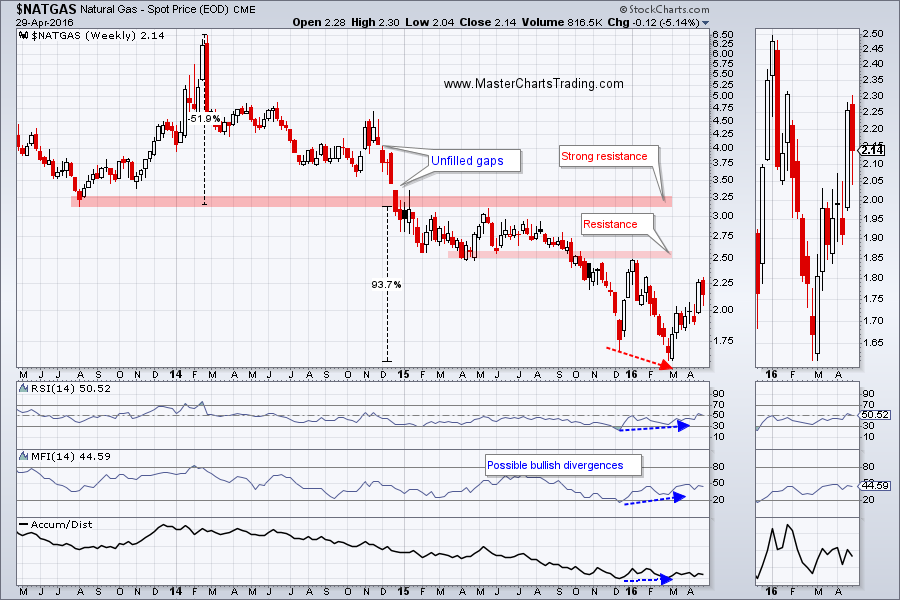
LONG-TERM CHART OF NATGAS
That’s it for this week’s market recap,
Best Regards and have another great trading week!
Alexander Berger (www.MasterChartsTrading.com)


 RSS Feed