|
Guest presentation by Dr. Marie Felberg, Psychologist/Life Coach starts at mark 25:55 on the video, click to play! -->
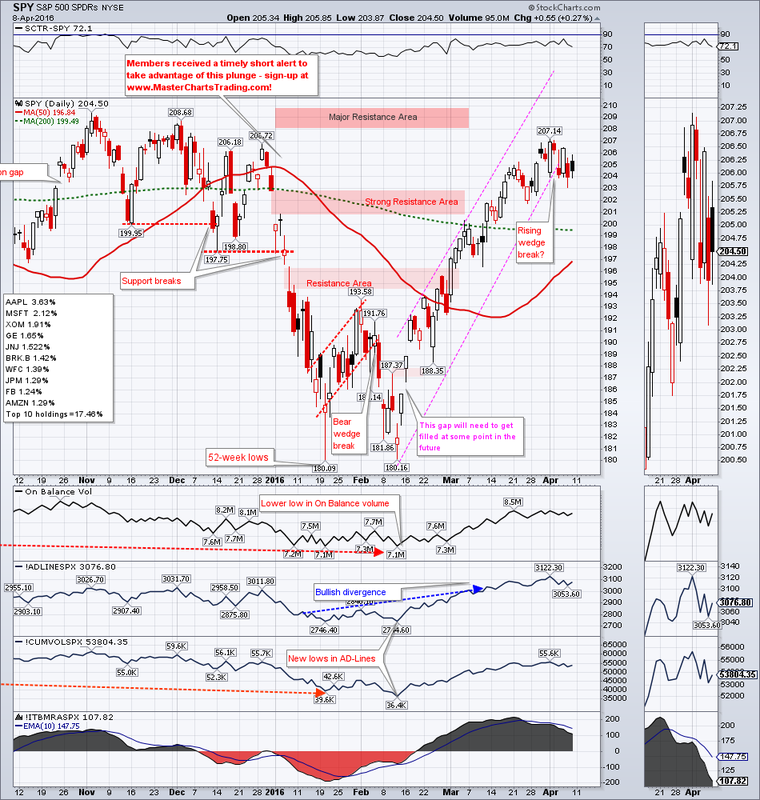
Big news of the week was a possible Rising Wedge break on the chart of S&P 500 ETF SPY. I still say “possible” because Mr. Market has a way to make the life hard for pretty much every participant out there. Maybe the wedge is broken and we now collapse back down to February lows. Maybe the opposite will happen and we will punch through resistance and make all-time highs. Or maybe something completely different will happen and we will meander sideways for month on end. CHART OF SPY |
|
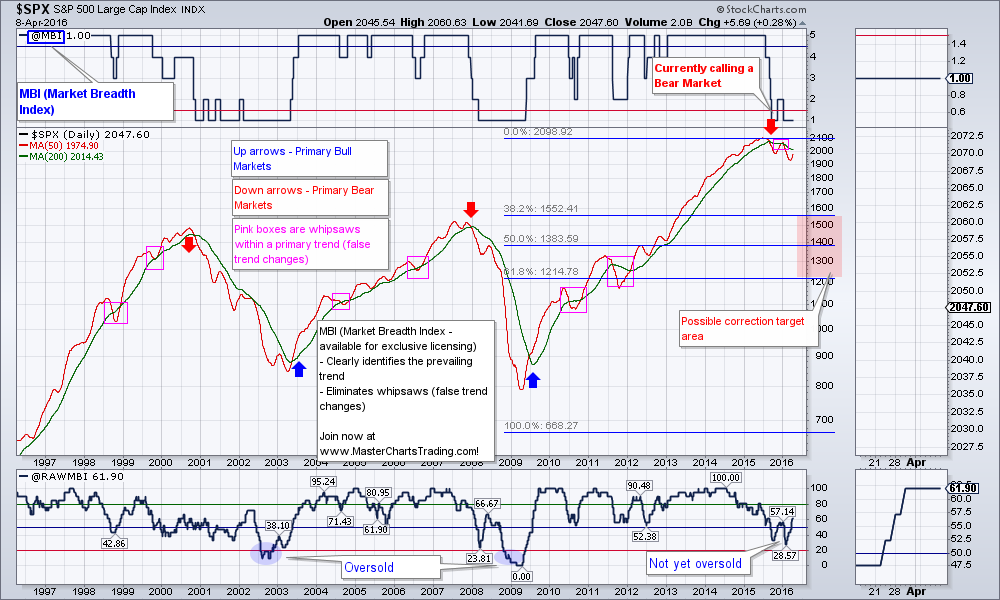
My long-term model stock market model (MBI) has flipped into the bear mode as early as September of last year and is yet to even begin improving. By extension I have a bearish outlook. As a result I am only looking for short setups and short trading opportunities.
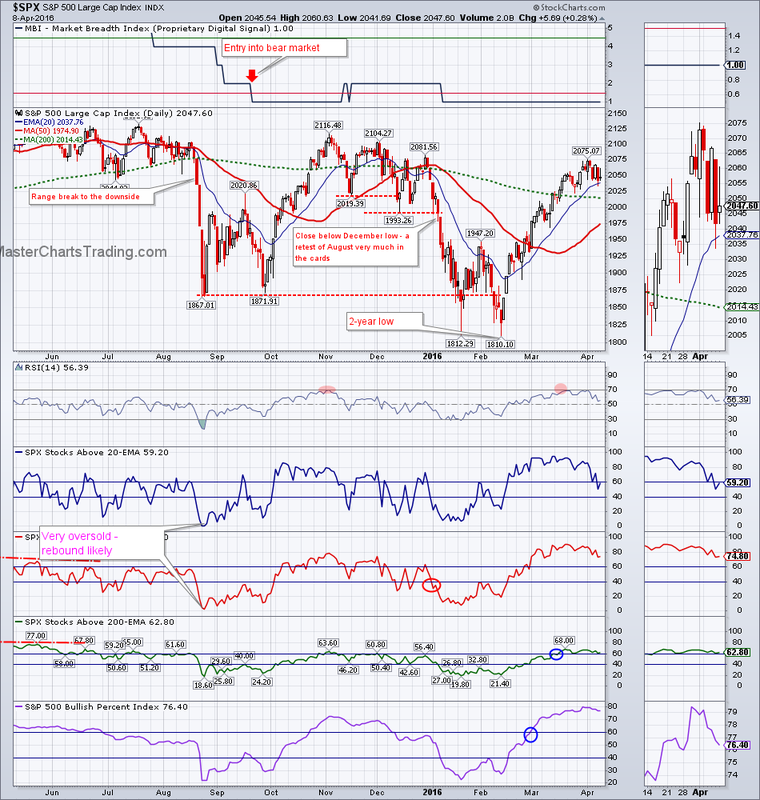
CHART OF $SPX
CHART OF $SPX
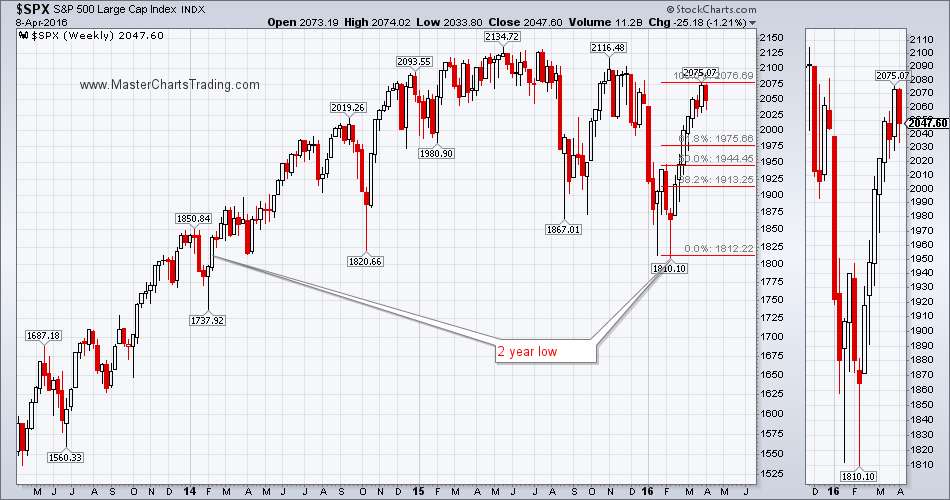
The weekly chart of $SPX is showing the recent peak from last week at 2075.07. If we assume that this indeed was the peak, we can draw in Fibonacci retracements from the February lows. At a minimum $SPX could fall back to around 1975, while a deeper correction could take it as low as 1913. Should it fall below 1913, most likely this rally would have failed and we would be back to retesting February lows.
CHART OF $SPX with Fibonacci retracements
CHART OF $SPX with Fibonacci retracements
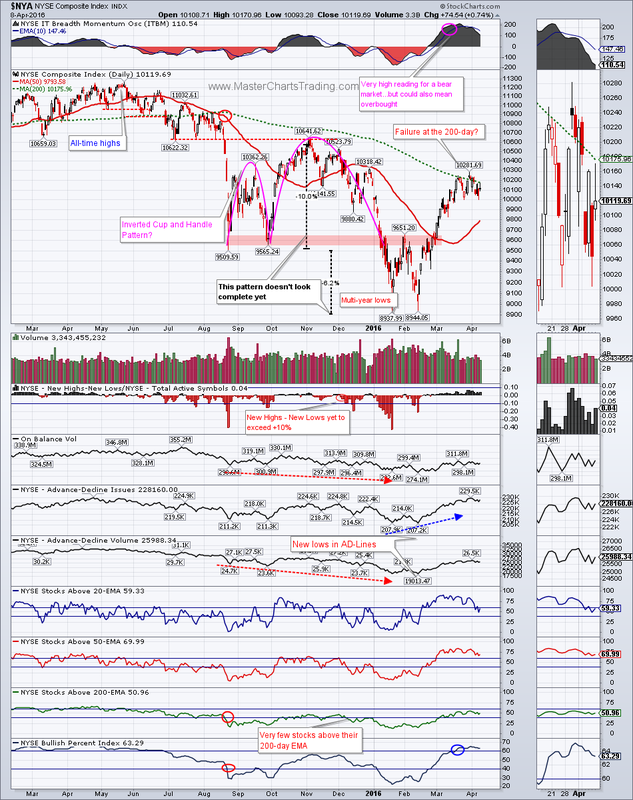
$SPX is approaching its all-time highs, yet the broader NYSE Composite index is nowhere near its all-time highs. $NYA set its record high in May of last year and since then has been making lower lows and lower highs. A conventional definition of a bear market is a decline of 20% off the peaks - $NYA now fits that definition. For me I simply prefer to define a bear market as a series of lower lows and lower highs.
CHART OF $NYA
CHART OF $NYA
Bonds of all sorts are getting a strong bid and many funds are hitting all-time highs. This is very bullish action and is showing a “flight to safety” behavior by investors.
TLT broke out above the falling wedge in late March and continued up this week. It is now within a percentage point of its all-time highs.
CHART OF TLT
Long-term TLT chart may be showing a giant Cup and Handle formation spanning about a year. If I am correct and this indeed is a Cup and Handle, then a breakout above the lip of this cup could be massively bullish for bonds. We could see TLT appreciate by around 20%. If true, this will be quite bearish for stocks.
LONG-TERM TLT CHART
Similar patterns are present of the diversified bonds fund – AGG, however AGG already broke out to new all-time highs and just keeps going. As with TLT, AGG has a similar bullish-looking pattern on the long-term chart. This pattern is suggesting much higher prices ahead for AGG.
CHART OF AGG
LONG-TERM CHART OF AGG
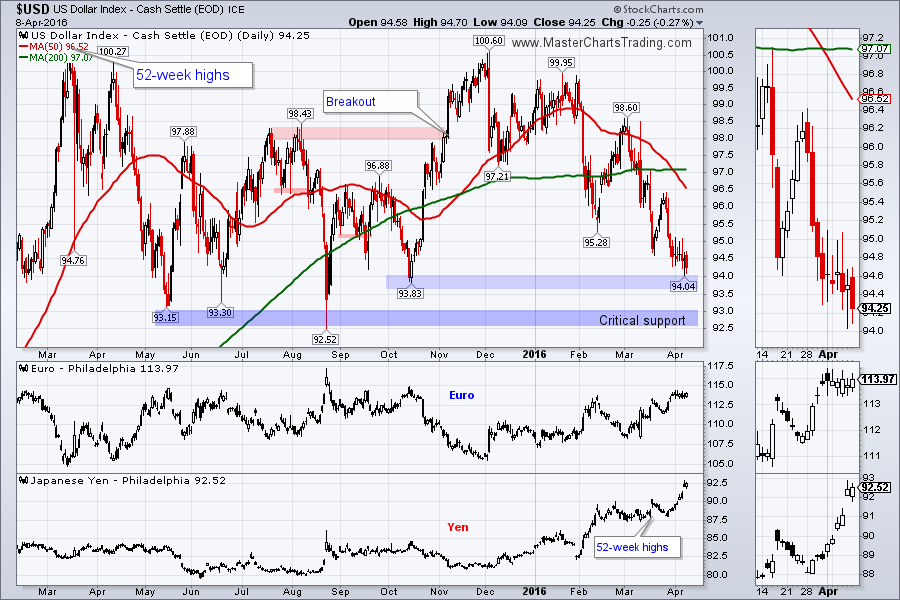
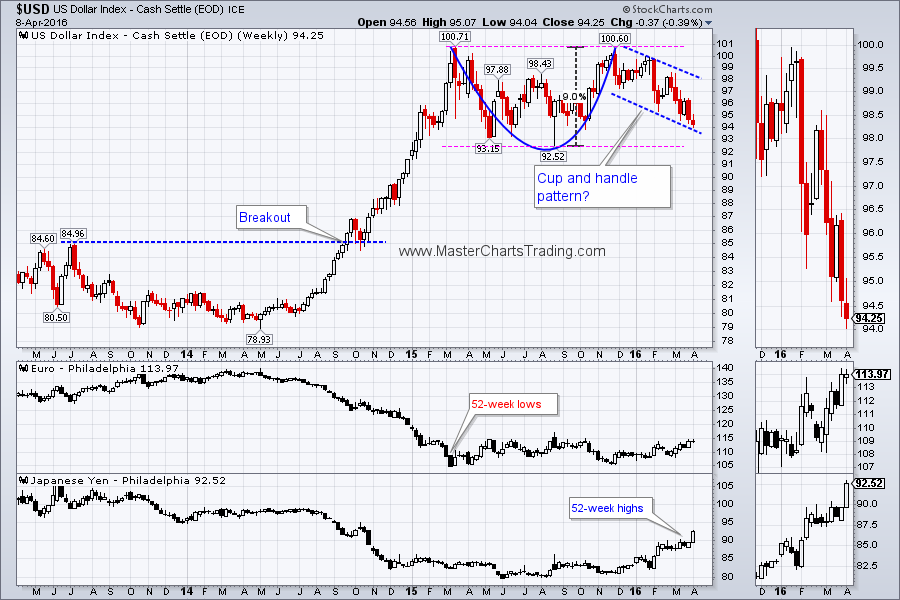
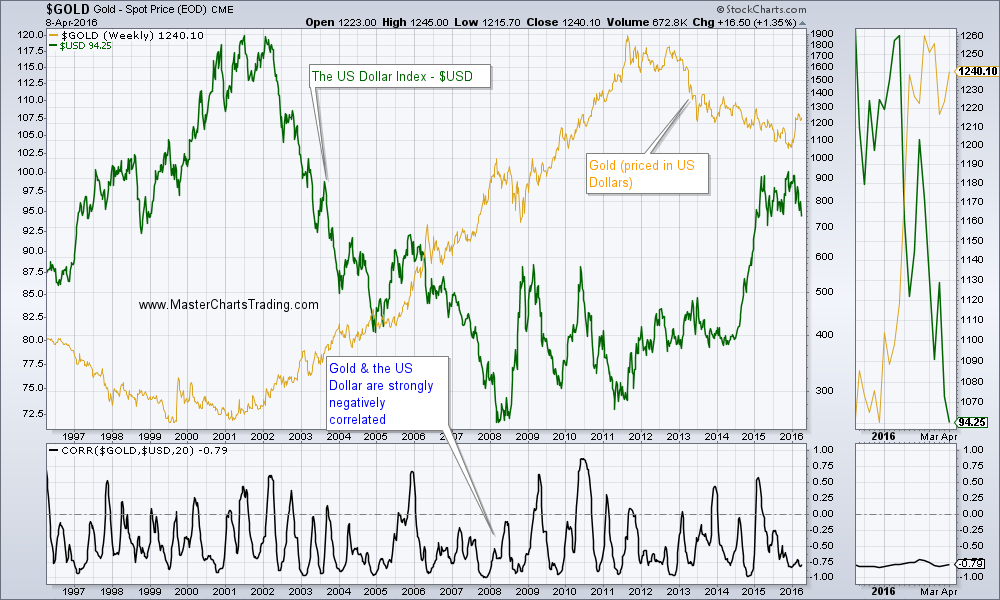
The Dollar index just cant catch a break, as the index kept falling this week. $USD is now down to an important support level around 93.80-94. An even more important (even critical) level is further below around 92.50-93.15. It is important for $USD to hold there, otherwise the breakout from 2014 could become questionable.
CHART OF $USD
LONG-TERM CHART OF $USD
CHART OF $USD
LONG-TERM CHART OF $USD
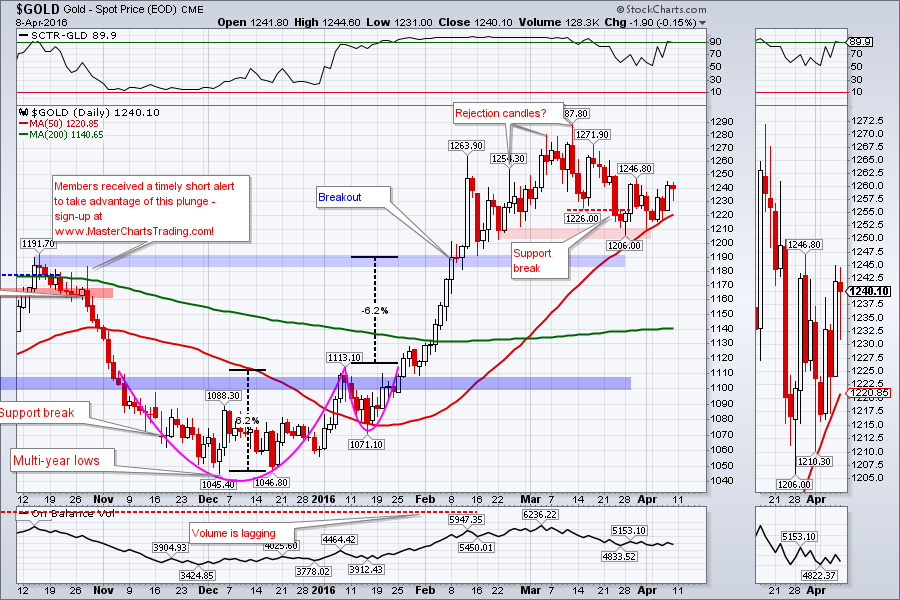
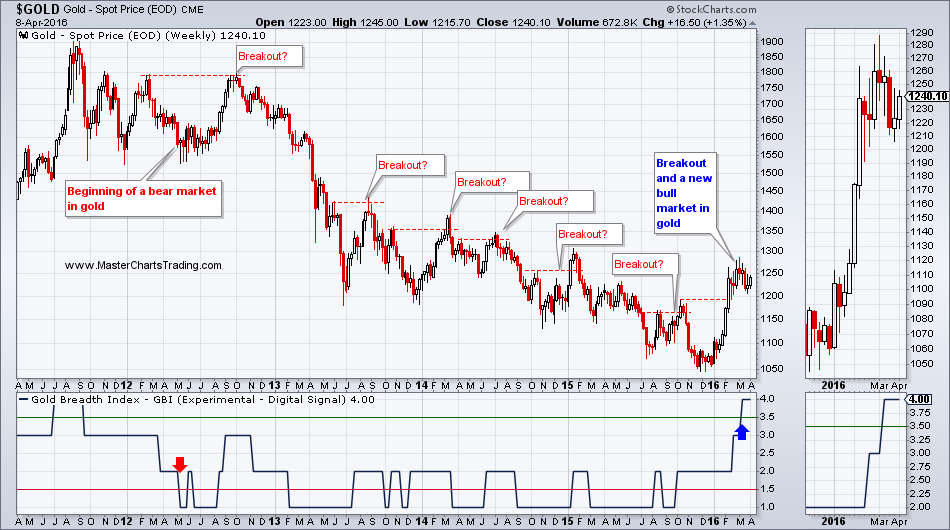
With dollar under pressure, gold managed to gain a little over 1% for the week. Gold is not far off from the 52-week highs.
Few weeks ago I mentioned that my long-term gold model (GBI) has flipped into a bull market and I am now looking to buy gold and to trade it on the upside. However gold needs to correct quite a bit more for me to become interested opening a long. A retest of its recent breakout could be upon us soon. $1191 is the level to watch.
GOLD CHART
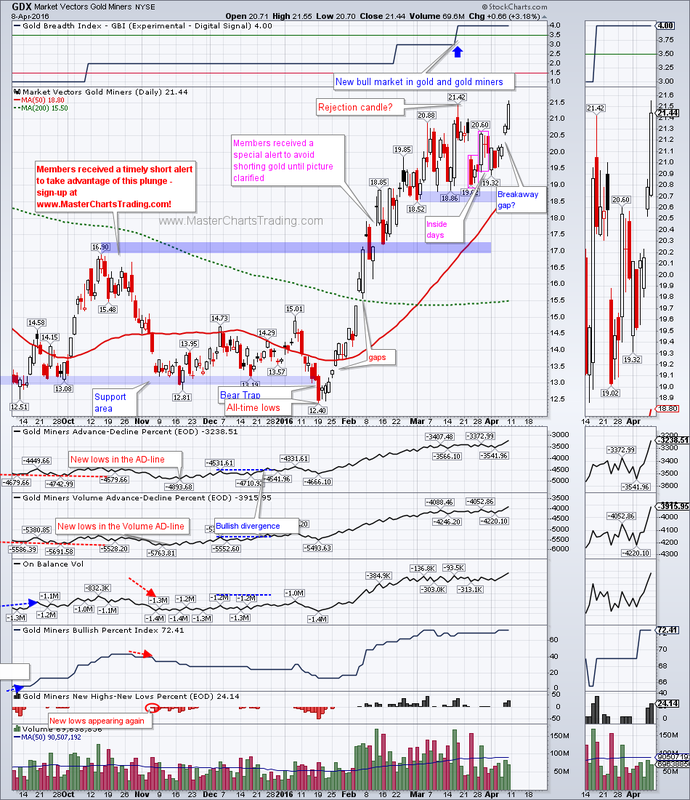
Gold Miners (GDX) look stronger then gold and are hitting 52-week highs. Action over the past few weeks exhibited an extra dose of volatility and we may even have a breakaway gap printed on Thursday. As with gold, GDX is overextended to the upside, so a pullback may provide for an opportunity to partake in this new bull market.
CHART OF GDX
CHART OF GDX
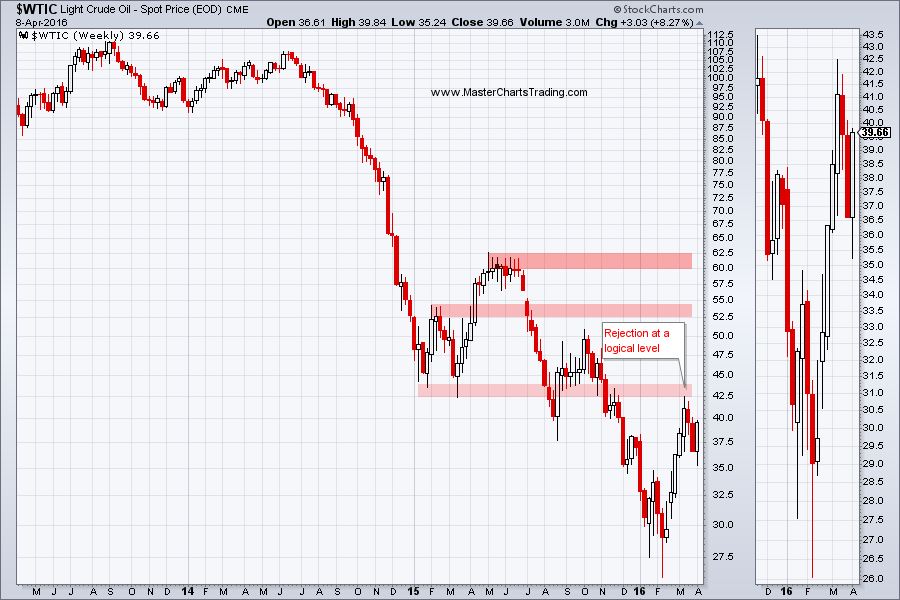
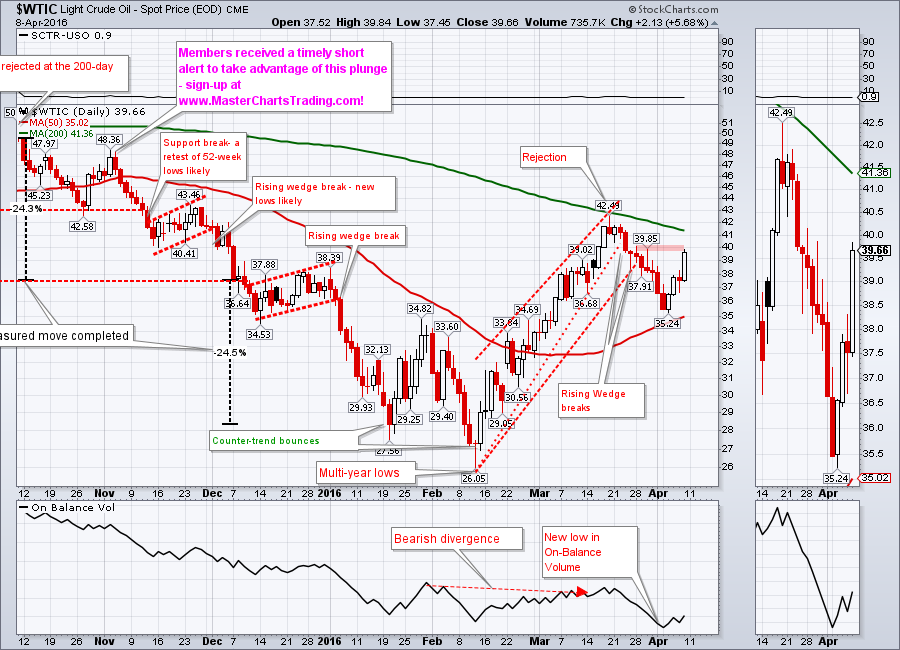
Oil continued in its volatile ways loosing over 8% percent last week, only to regain it all back this week. Friday’s close took oil to the previous resistance levels from end of March. Slightly higher is the 200-day moving average that in mid-March acted as resistance. We will see if it does so again now.
Long-term chart of oil shows rejection at a logical level of $42.50. This is the level where oil held support on two occasions in 2015, but ultimately broke it twice later same year.
CHART OF $WTIC
LONG-TERM CHART OF $WTIC
Long-term chart of oil shows rejection at a logical level of $42.50. This is the level where oil held support on two occasions in 2015, but ultimately broke it twice later same year.
CHART OF $WTIC
LONG-TERM CHART OF $WTIC
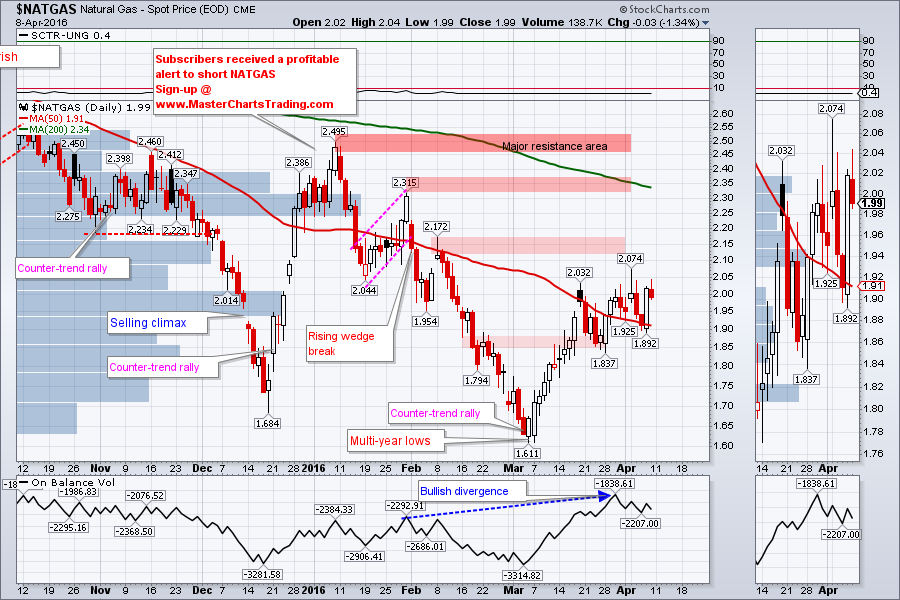
Natural gas (NATGAS) also did not disappoint on the volatility front. After some violent moves up and down throughout the week, NATGAS ended pretty much where it began. The bigger trend is down, IMHO, and I am still looking at this rebound from March lows as a bear-market rally.
Significant resistance level lies about 5% higher at 2.17. Bears would most likely attempt to push the prices lower around there.
More significant resistance is around 2.315 and the very important one is at 2.50.
CHART OF NATGAS
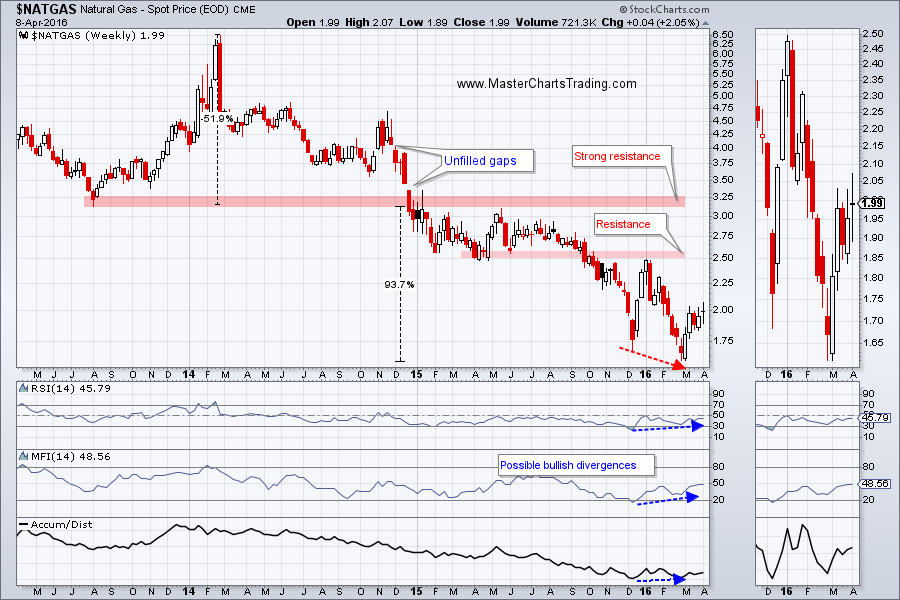
Long-term picture hasn’t changed much, so I am quoting from last week. “The 2.50 level is of a particular importance because it is around there that NATGAS failed last September. It is also around 2.50 where the price was rejected in January. Currently there several bullish divergences present on the long-term chart of NATGAS (price made a lower low, but indicators made higher lows).”
LONG-TERM CHART OF NATGAS
Significant resistance level lies about 5% higher at 2.17. Bears would most likely attempt to push the prices lower around there.
More significant resistance is around 2.315 and the very important one is at 2.50.
CHART OF NATGAS
Long-term picture hasn’t changed much, so I am quoting from last week. “The 2.50 level is of a particular importance because it is around there that NATGAS failed last September. It is also around 2.50 where the price was rejected in January. Currently there several bullish divergences present on the long-term chart of NATGAS (price made a lower low, but indicators made higher lows).”
LONG-TERM CHART OF NATGAS
“Psychological Aspects of Trading – the Rule of 21”
by Dr. Marie Felberg, Psychologist/Life Coach -visit her site to get help with your trading performance today!
by Dr. Marie Felberg, Psychologist/Life Coach -visit her site to get help with your trading performance today!
Trade Alerts Service is now live – please sign-up here!
That’s it for this week’s market recap,
Best Regards and have another great trading week!
Alexander Berger (www.MasterChartsTrading.com)
That’s it for this week’s market recap,
Best Regards and have another great trading week!
Alexander Berger (www.MasterChartsTrading.com)


 RSS Feed