|
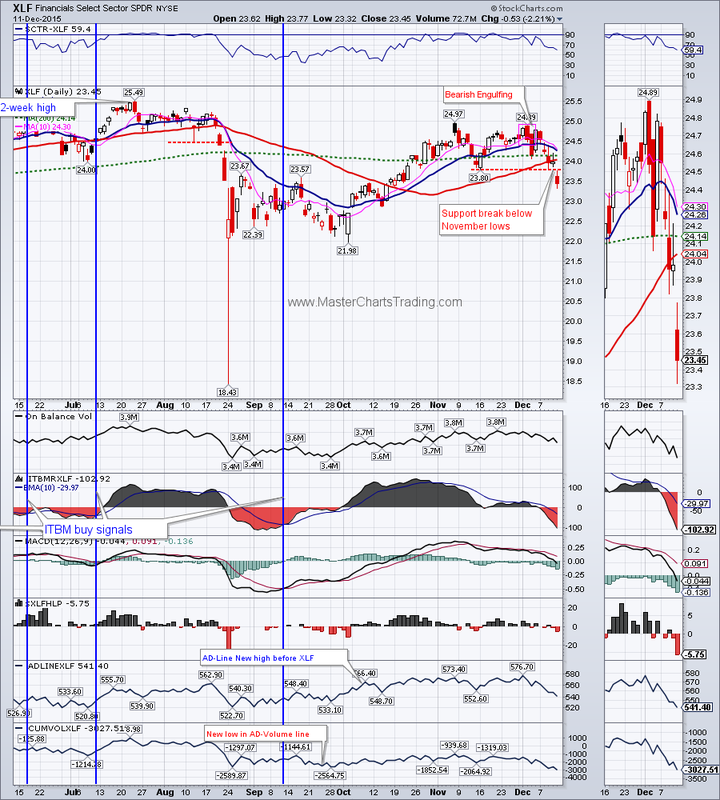
The topping process continues. Perhaps once we roll over into an outright bear market, it would be called the Commodities Crisis? This week sellers came back with gusto and no sector was spared. Energy again led to the downside, but financials was the close second with XLF loosing 5.37% for the week. As I have repeatedly mentioned since the mid-September, I believe we are in the beginning stages of the next bear market. How it will unfold is anyone’s guess, but the fact remains that we must now change and adapt to these new market conditions.
|
|
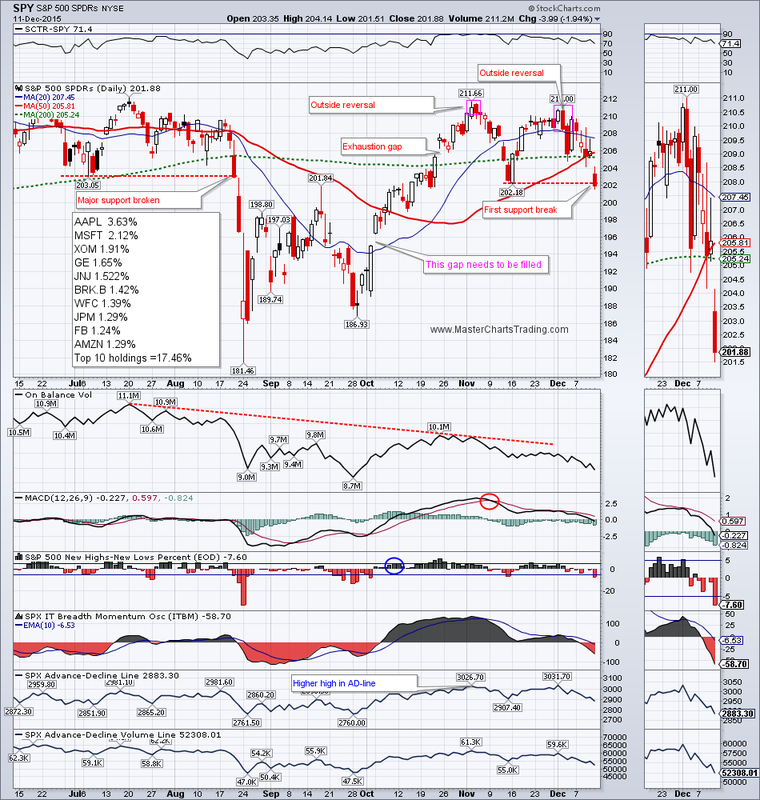
S&P 500 (SPY) gapped down on Friday and closed below the mid-November low. This is an important break of key support. The door is now open for SPY to at the very least fill the gap-up from the early October that would be a logical place for some sort of a bounce. Very short term, SPY might rebound to the 200-day moving average around $205.24, but I think the bigger trend is down, so the short sellers might re-join the party at that level.
CHART OF SPY
CHART OF SPY
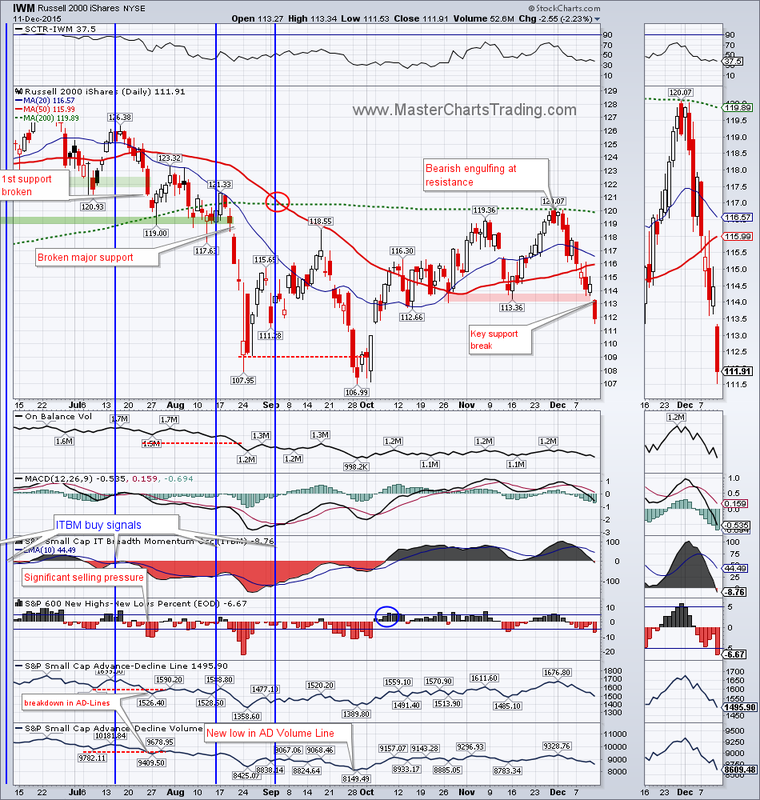
IWM is the weakest of the big 3 major ETFs (SPY, QQQ, IWM). Today IWM broke below the November lows and closed near the lows. IWM also has a gap-up to fill from the early October, and from there, the August and October lows are just a few percentage points away.
CHART OF IWM
CHART OF IWM
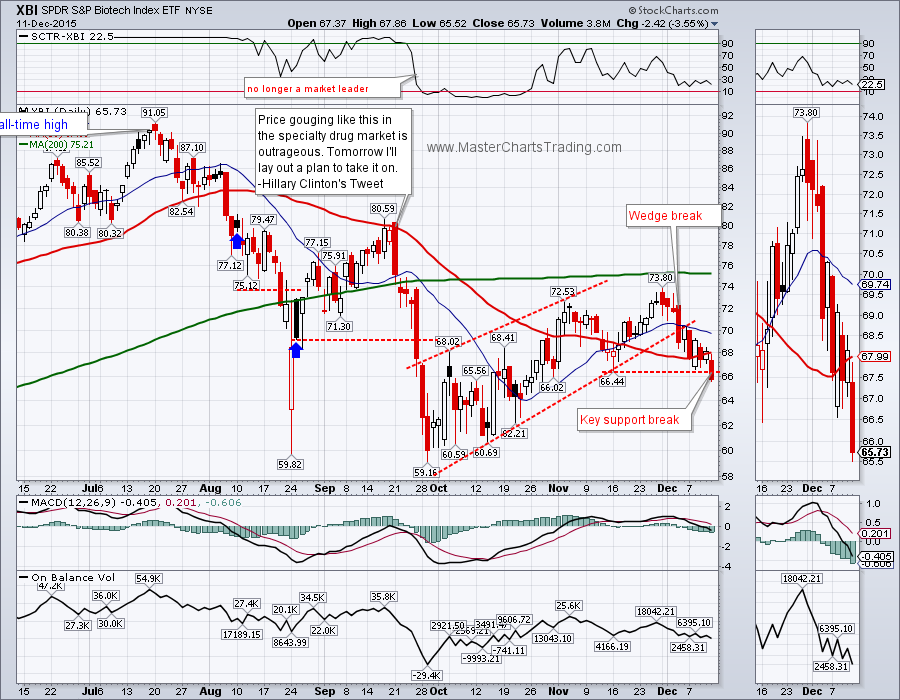
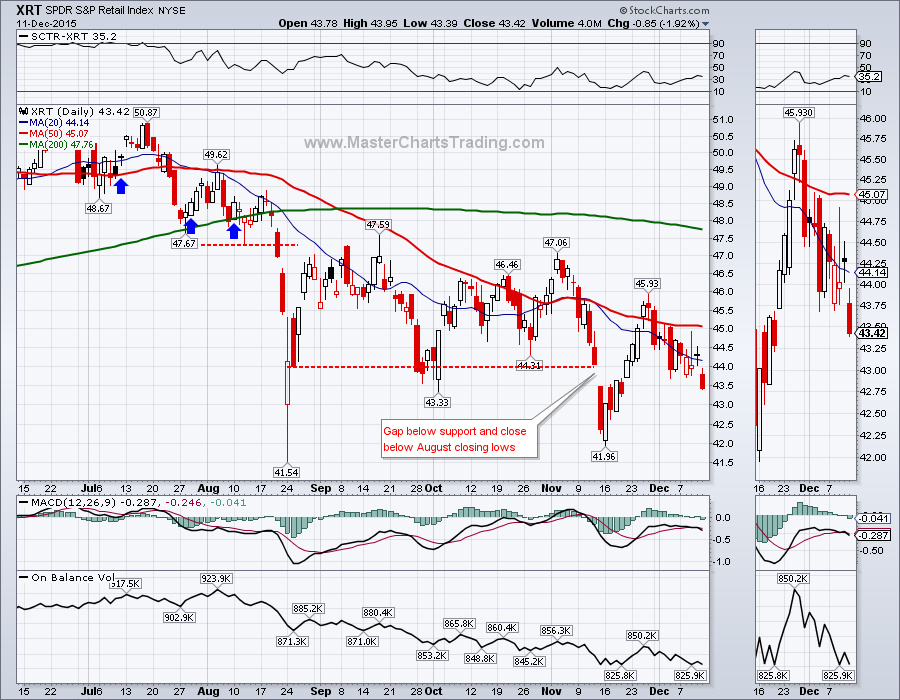
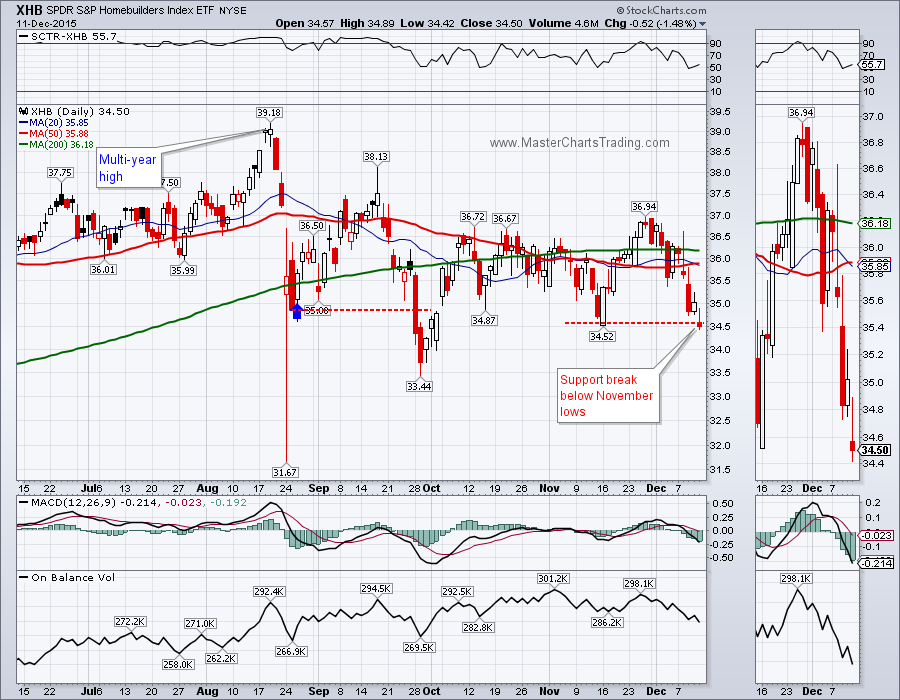
Several sectors and industry groups deserve special mentions: Finance, Homebuilders, Retail and Biotech all either broke major supports, are gaining on their August/September lows, or have actually closed below them. These are important, aggressive parts of the stock market and weakness here doesn’t bode well for the rest of the market.
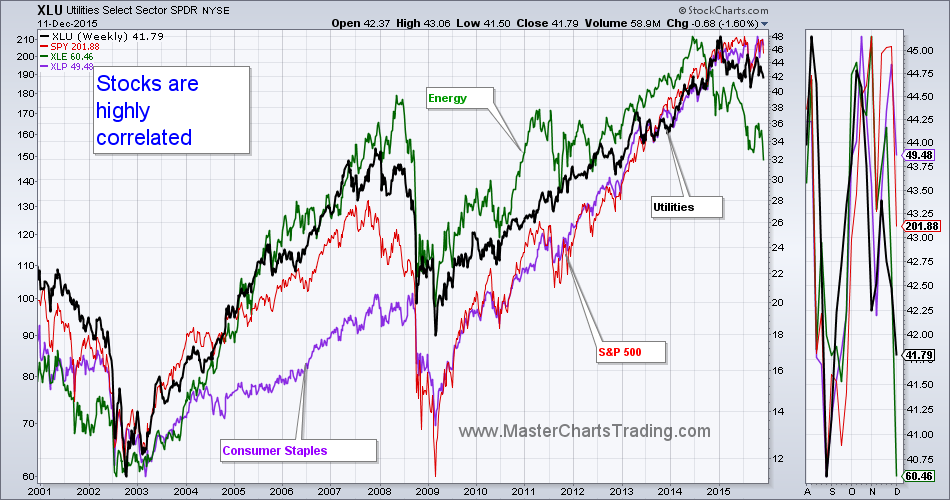
Correlations between the various stock sectors increase when the markets drop. If the general markets drop, it is very unlikely you would be able to wait things out in a defensive sector like Utilities or Consumer Staples.
STOCKS ARE HIGHLY CORRELATED
STOCKS ARE HIGHLY CORRELATED
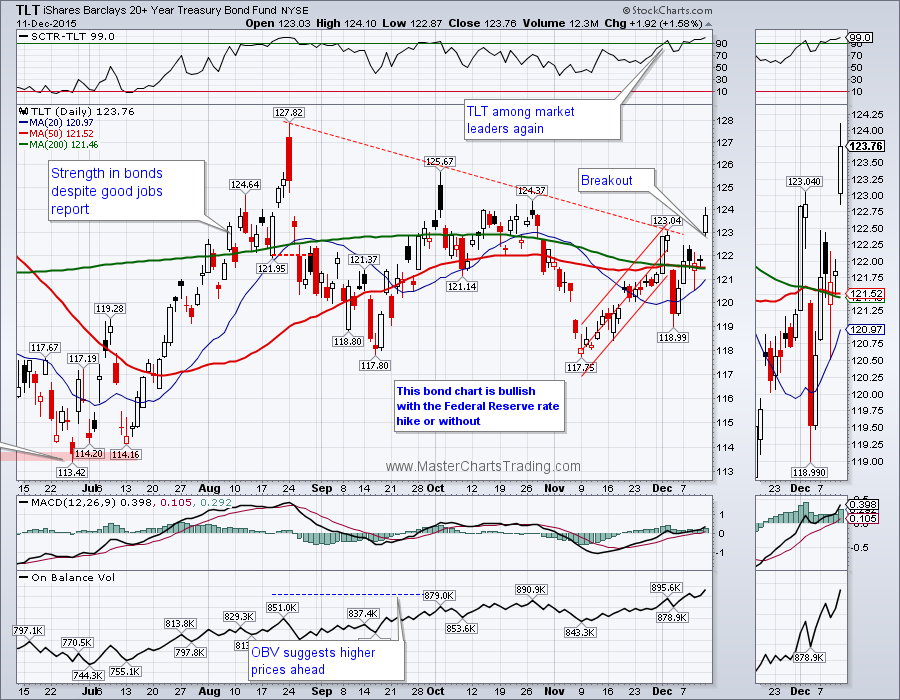
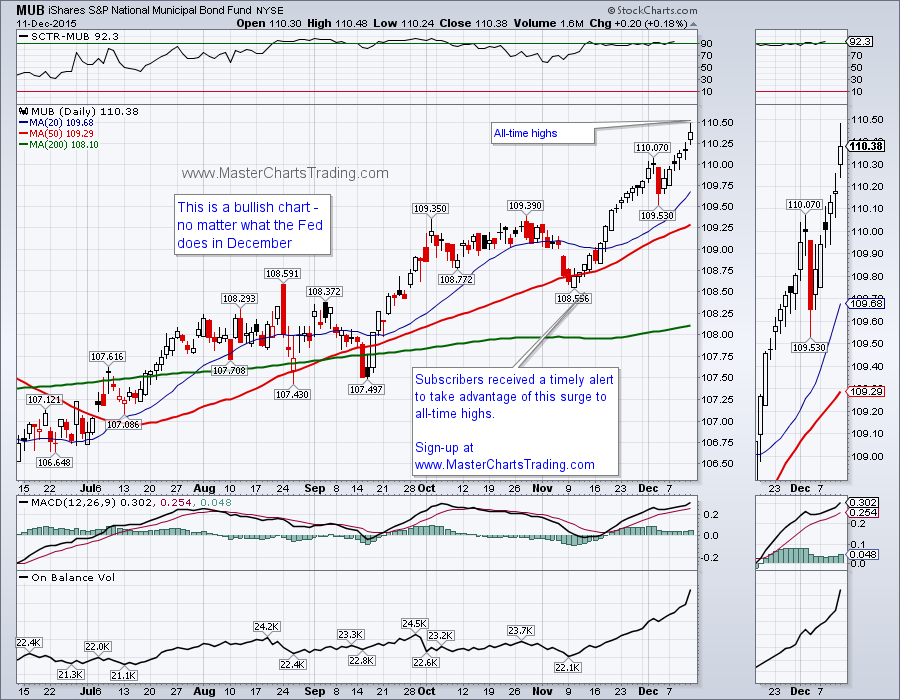
Where could the investors hide during market corrections and bear markets? Traditional safe-haven investment class are the bonds, specifically, the US Treasuries. I think we had a bona fide breakout in TLT this Friday as it closed above the resent resistance level. The Federal Reserve may or may not raise the interest rates this coming week, but the chart of TLT is painting a picture of fear. The same can be said about the chart of Municipal bonds (MUB) – it hit another all-time high on Friday. If stocks come under more selling bonds are likely to benefit.
CHART OF MUB
CHART OF TLT
CHART OF MUB
CHART OF TLT
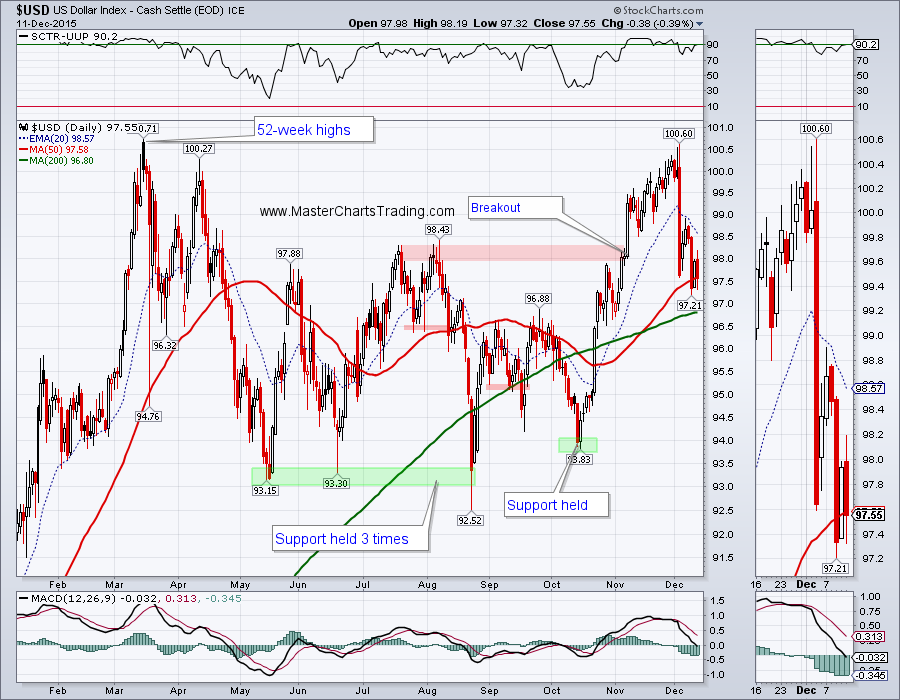
The selling of the US dollar may have been overdone. Should Jane Yellen rise the interest rates, we may see the dollar strengthen again and re-challenge the rest attempt at the 52-week highs. Commodities will most likely come under more pressure (as if they need more pressure).
CHART OF $USD
CHART OF $USD
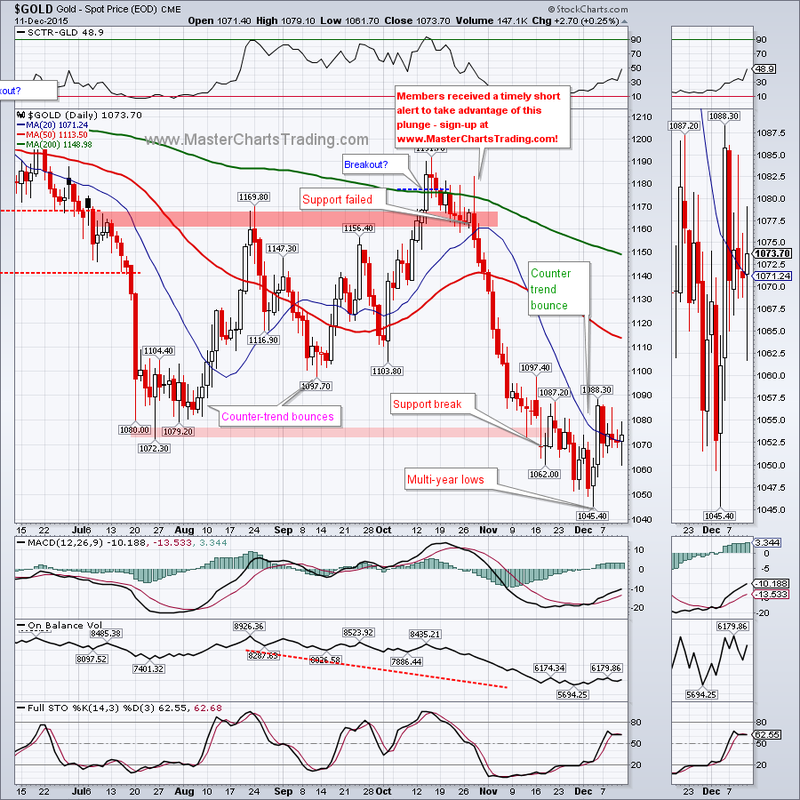
Gold is in the middle of a bear-market rally or at least a rebound of some sort. Last week’s gold rebounded very strongly following the steep rise in Euro. But for now gold was unable to build on this breakout. Gold might continue up to around $1100, possibly higher, I think it will depend on the Dollar.
GOLD CHART
GOLD CHART
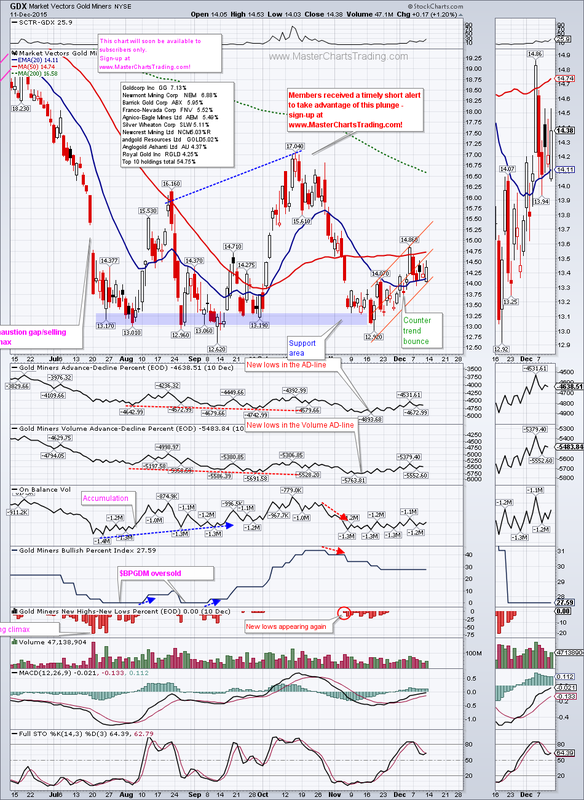
GDX is also rebounding with a rising wedge of sorts. We all know what the rising wedges in a bearish security mean –strong selling once the rising wedge is broken to the downside. A rising wedge is of course short-term bullish for GDX – while its rising. I am expecting short sellers to come in around the $16-17 area.
CHART OF GDX
CHART OF GDX
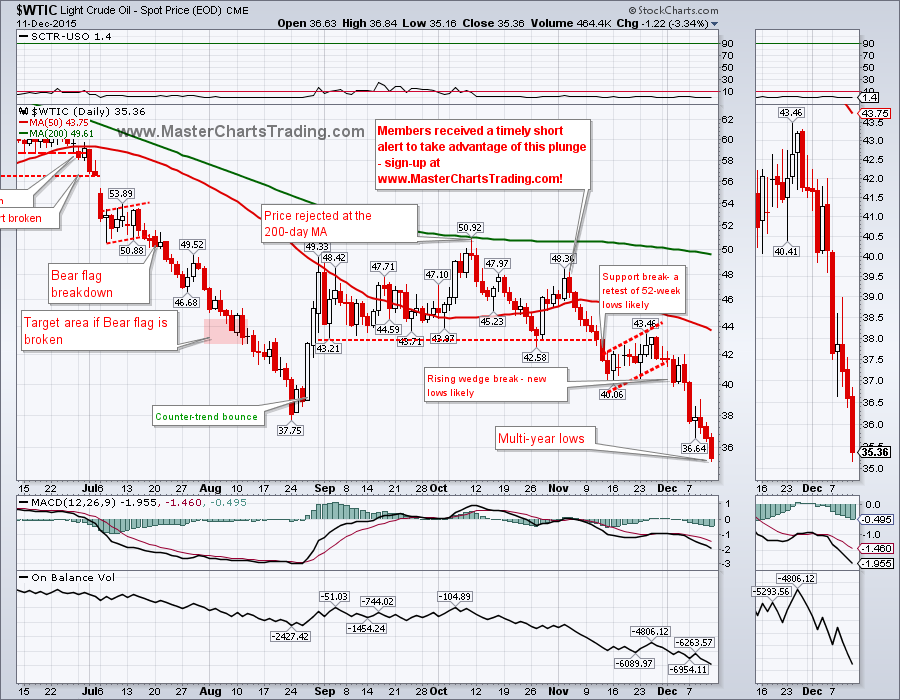
Oil was an outstanding performer for the subscribers. Our open position in SCO (inverse double oil) is up almost 70% from the entry in early November. Sign-up for our Trade Alerts Service here.
Oil is strongly bearish – it hit multi-year lows on Friday. I don’t see any signs of a bottoming action in $WTIC just yet. We could easily hit upper $20s in the near future as OPEC continues to flood the market with cheap oil.
OIL CHART
Oil is strongly bearish – it hit multi-year lows on Friday. I don’t see any signs of a bottoming action in $WTIC just yet. We could easily hit upper $20s in the near future as OPEC continues to flood the market with cheap oil.
OIL CHART
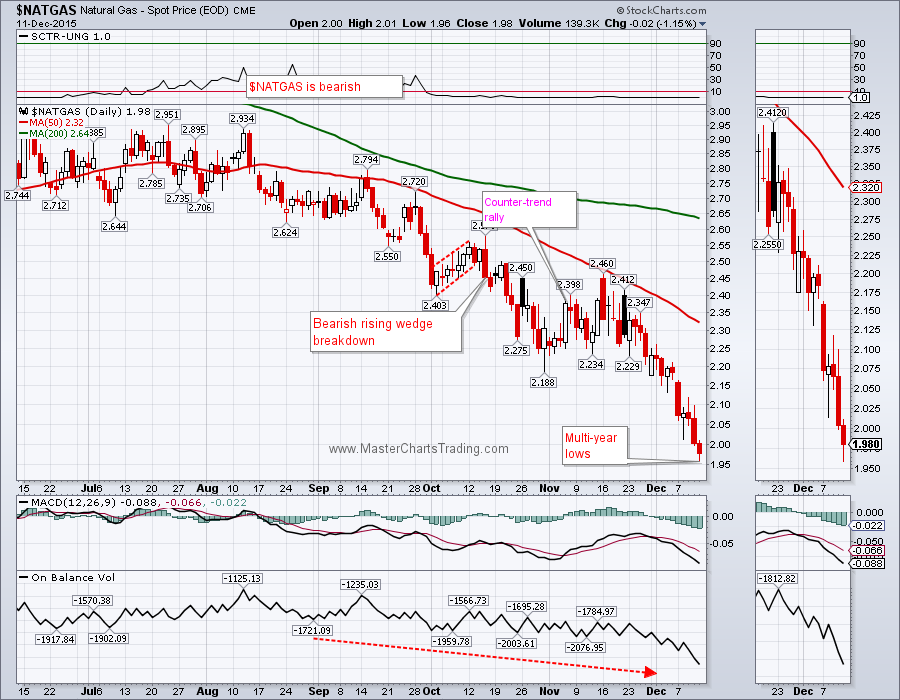
Natural gas was not to be outdone and hit multi-year lows as well. In the past two weeks we had two hammer candlesticks printed on the chart of $NATGAS and neither one of them resulted in any sizable rebound. Again, I cannot overemphasize the dangers of bottom picking. At least the temporary bottom will come when it does. Once NATGAS rebounds, we can start looking for shorting opportunities again, until then cash is a position.
CHART OF NATGAS
CHART OF NATGAS
That’s it for this week’s market recap,
Best Regards and have another great trading week!
Alexander Berger (www.MasterChartsTrading.com)
Best Regards and have another great trading week!
Alexander Berger (www.MasterChartsTrading.com)


 RSS Feed