|
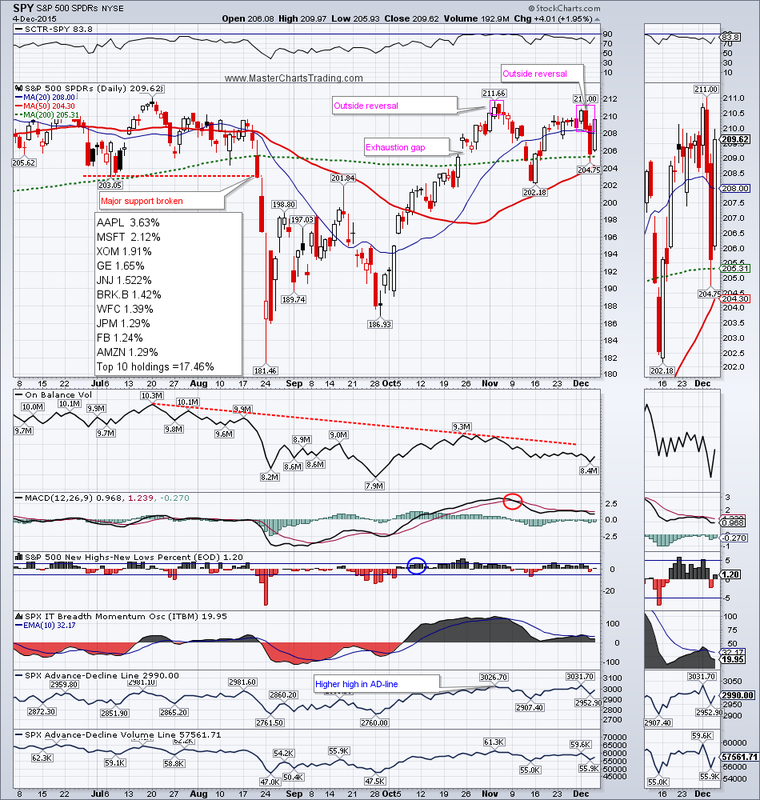
Really a wild week with lots of market-moving events occurring within a short period of time. The markets perceived Mario Draghni’s speech on Thursday negatively. Friday’s positive reaction to the jobs report almost completely negated the Thursday’s drop. Overall the S&P 500 barely moved for the week as it added 0.06 points or 0.03%. I still think that we may have a bona fide Outside Reversal on the chart of SPY and if I am correct, we should see at least a retest of November lows soon.
CHART OF SPY |
|
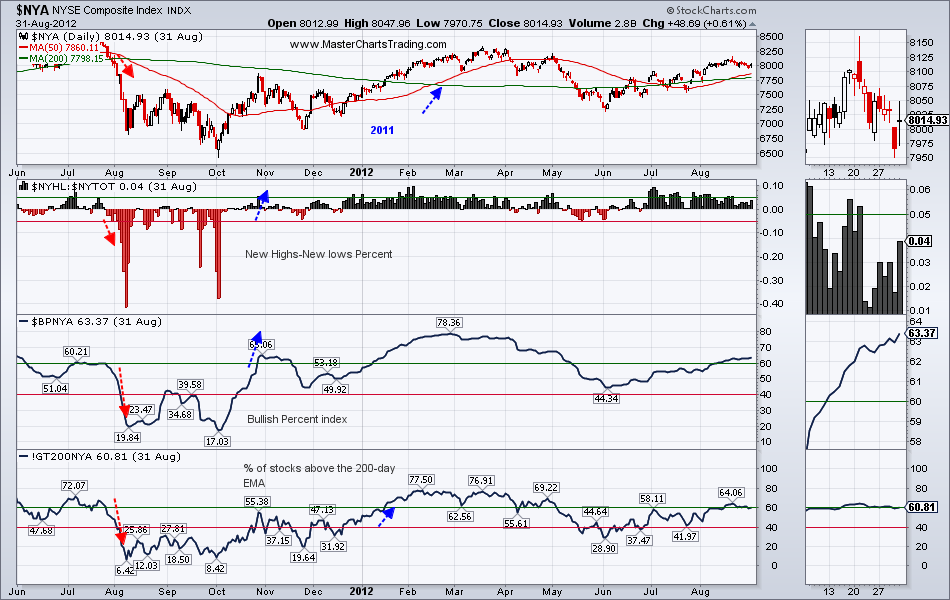
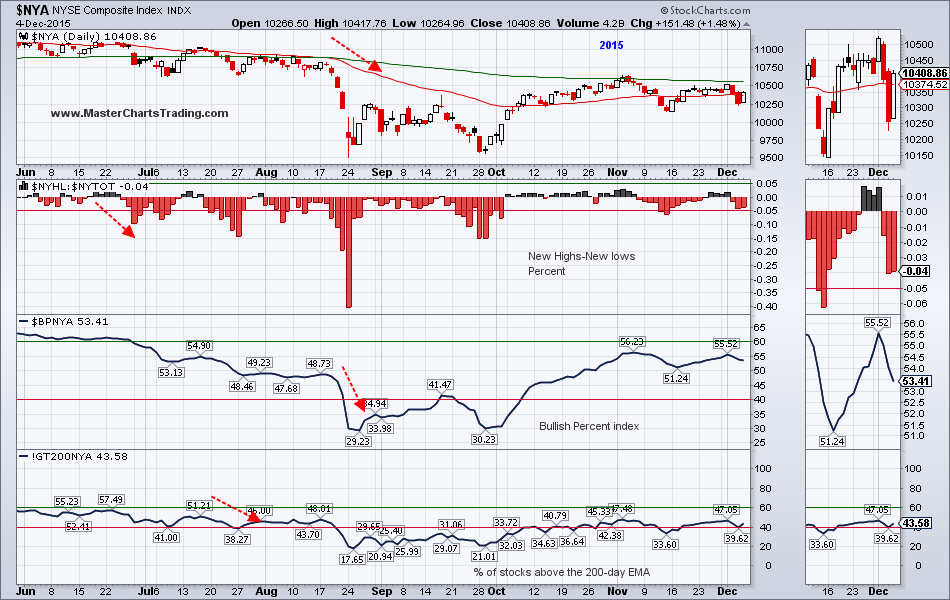
Never mind all the excitement about the economy and money printing in Europe, I am still getting a rather bearish feeling about the stock markets. Let us now take a look at some of the historical time periods and see if my concerns are grounded in solid data. We will take a “balance of evidence” approach to our studies and look at 4 indicators: Simple moving average crossover (50-day over 200-day), New Highs-New Lows percent, Bullish percent index, and Percent of stocks above the 200 day exponential moving average. If at least 3 of these indicators are bullish, we will keep a bullish bias, if at least 3 are bearish – bearish bias.
The most common time period to which today’s market is compared is that of 2011 so lets start there.
In August 2011, $NYA experience a sharp drop followed by sideways action and several attempted rallies. Eventually at least 3 of the above indicators crossed into the bullish thresholds and a strong rally ensued.
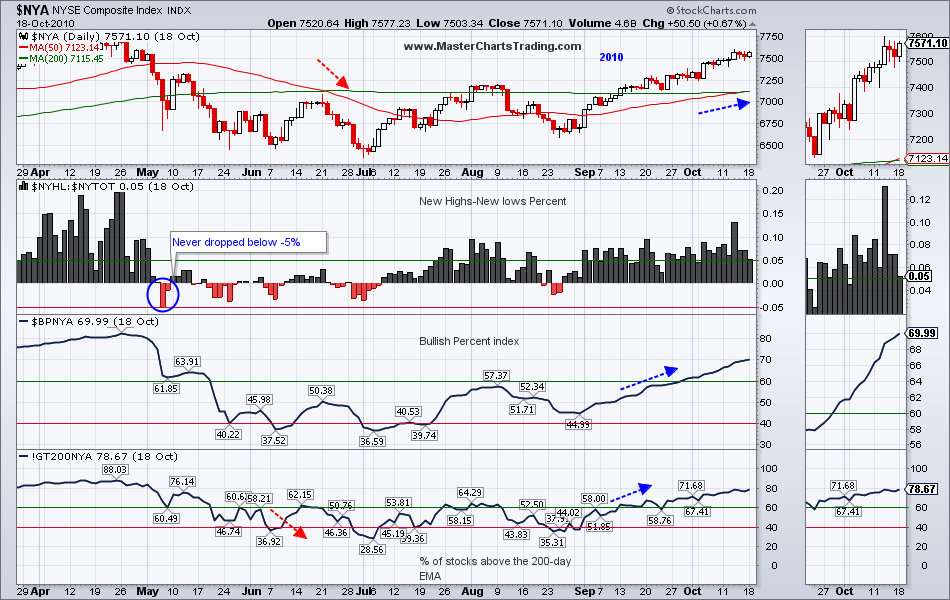
In 2010 New Highs-New lows percent never even dropped below the -5% threshold, and it was only 4 month before we got the 3 out of 4 indicators into the bullish camp. Again a rally ensued.
Contrast this now with the picture we had in 2008. All 4 indicators dropped into the bearish territory rather abruptly. There were several attempted rallies, one of them almost putting 2 out of 4 into the bullish mode. Ultimately the rally failed and a severe bear market started.
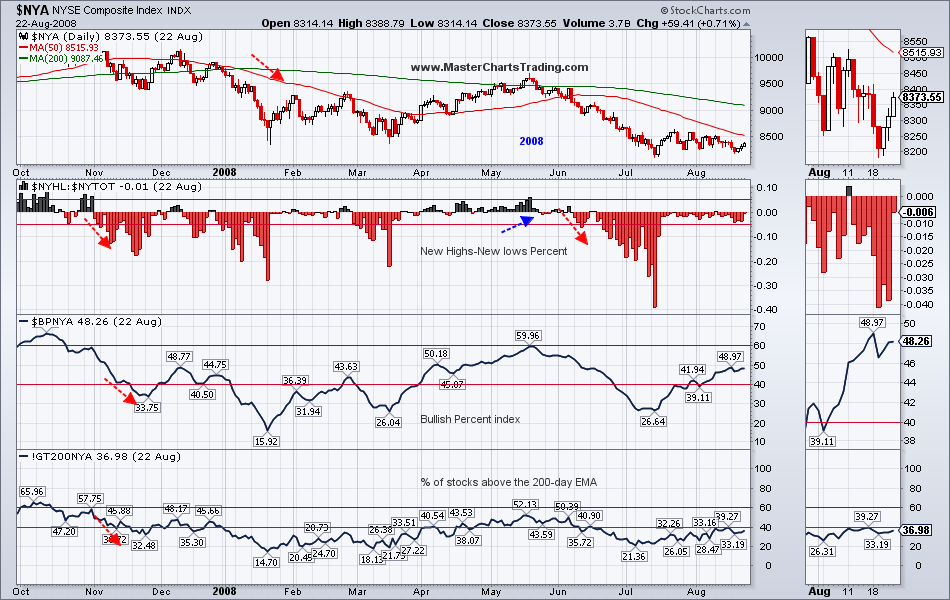
What does the picture look like today in December 5, 2015?
Currently we have 0 of the above indicators in the bullish camp. Can this change in the near future? Sure it can, but until we see the actual evidence on the charts turn bullish, I will treat the current picture in the general market as bearish.
CHART OF $NYA
Currently we have 0 of the above indicators in the bullish camp. Can this change in the near future? Sure it can, but until we see the actual evidence on the charts turn bullish, I will treat the current picture in the general market as bearish.
CHART OF $NYA
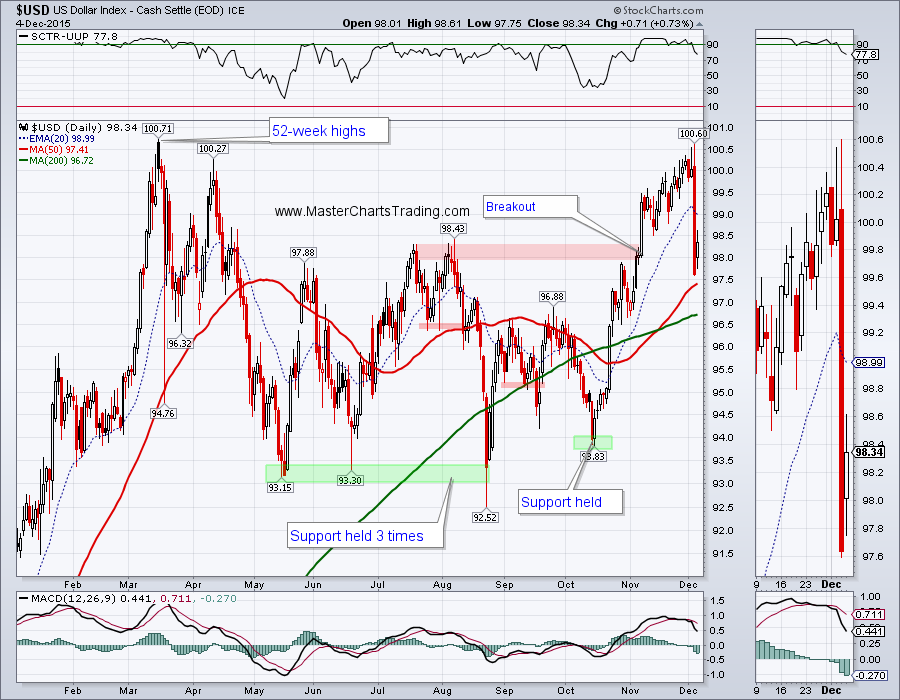
Moving on to the Central Bank action. This Thursday when ECB announced a less robust QE package then the market was expecting, the Euro gained over 3.5% against the dollar! Does this change the long-term picture for the US dollar index ($USD)? Probably not. $USD is still in a long-term uptrend and it would take at least a 6% drop for it to break major support around $92 and to reverse its course.
CHART OF $USD
CHART OF $USD
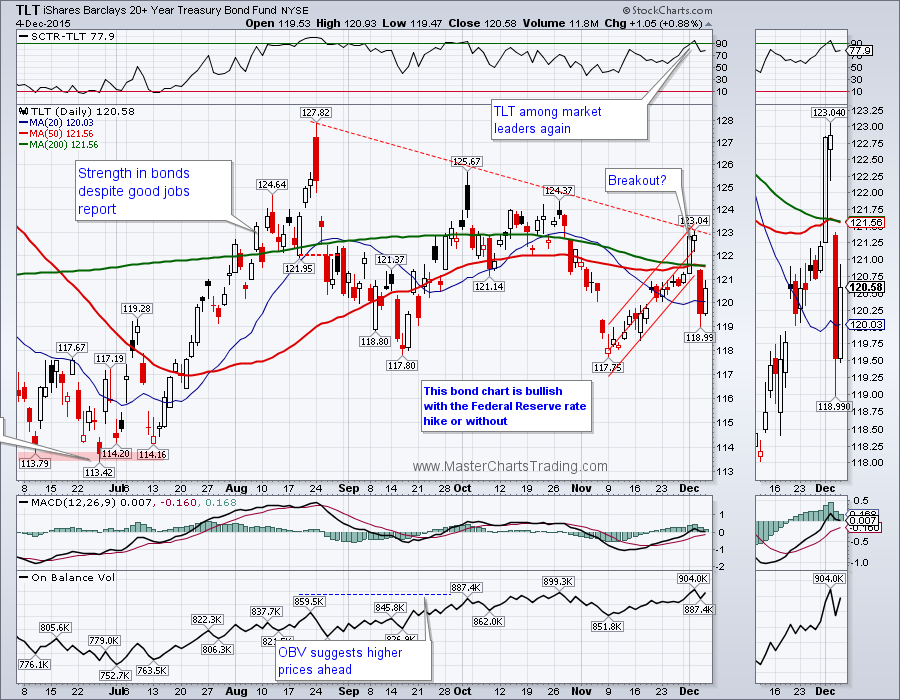
Bonds also came under selling pressure after ECB announcement. TLT was rejected at the (now apparent) resistance level marked by the declining peaks of previous attempted rallies. On Thursday TLT gapped down and continued lower, which represents a possible rising wedge break to the downside. If you are a bond bear, this is a welcome sign since it calls for more downside.
CHART OF TLT
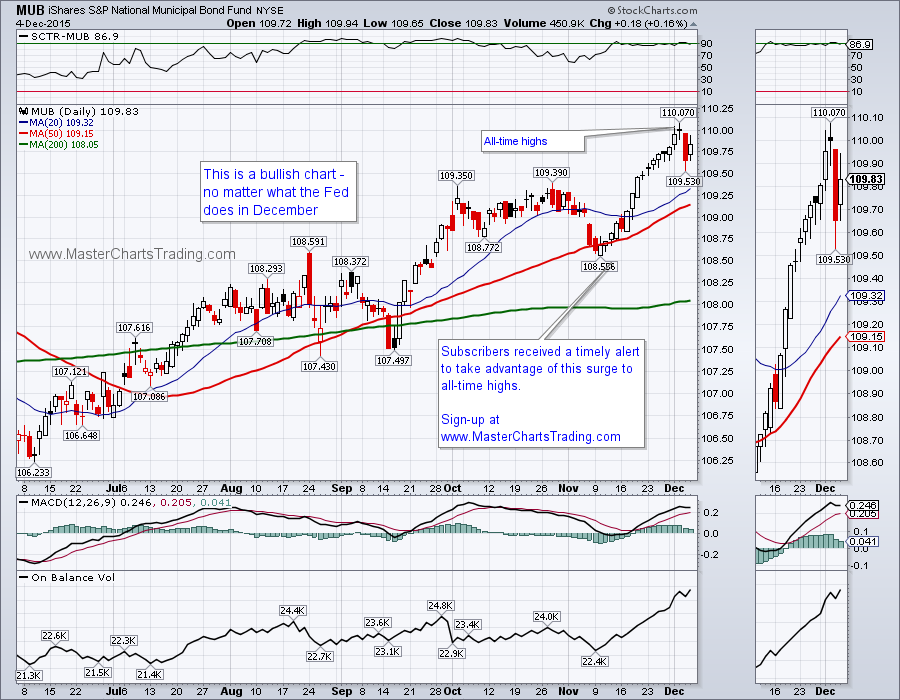
Municipal bonds (MUB), on the other hand, were hitting all-time highs just before ECB, and corrected slightly. I think the uptrend in MUB is still unbroken and the fund looks bullish.
CHART OF MUB
CHART OF TLT
Municipal bonds (MUB), on the other hand, were hitting all-time highs just before ECB, and corrected slightly. I think the uptrend in MUB is still unbroken and the fund looks bullish.
CHART OF MUB
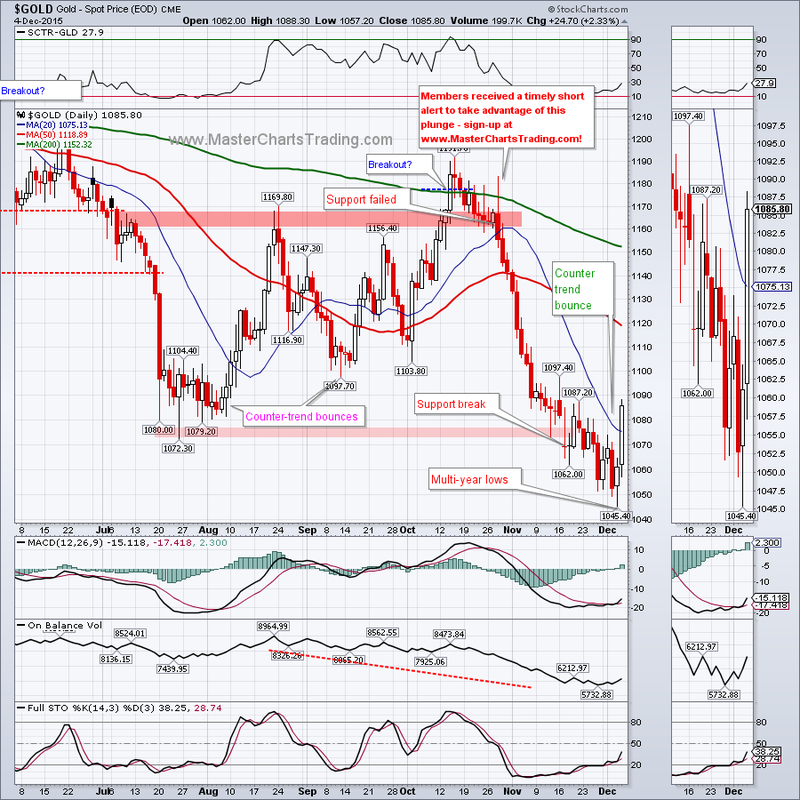
Gold was a clear winner this week. Gold hit multi-year lows at $1045.40, but finished higher on Thursday. Then Friday we had a strong follow-through and a close above the broken support level. We may see more upside, provided the dollar doesn’t rebound. Some levels to watch for a reversal are: $1100 (previous broken supports and an attempted rally), and $1120 where the 50-day moving average currently is.
GOLD CHART
GOLD CHART
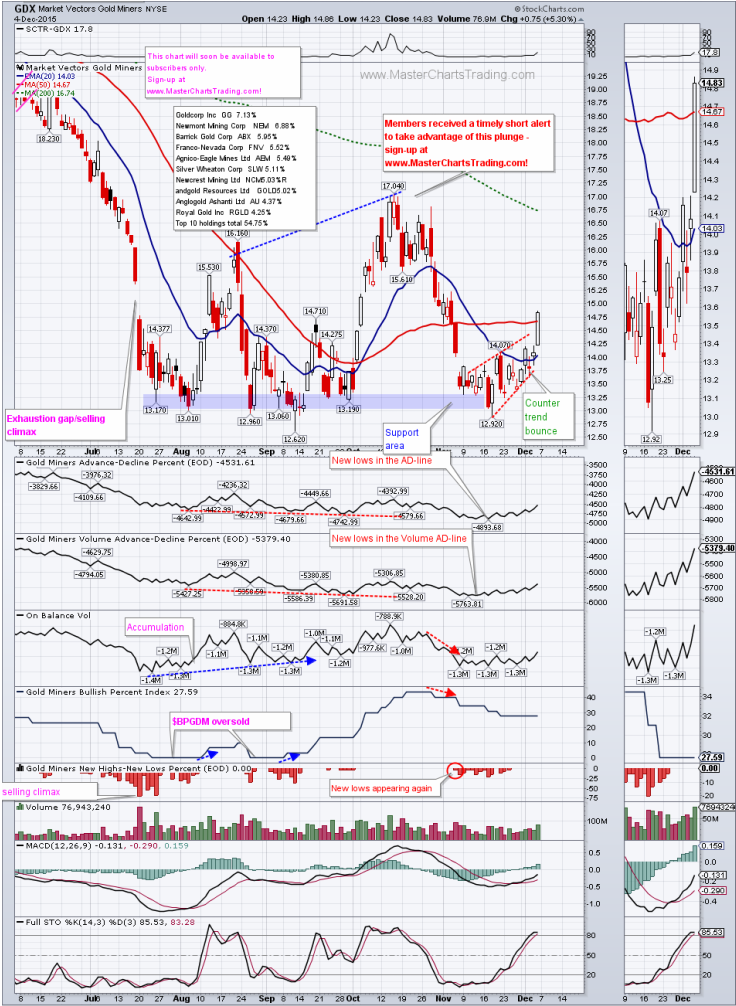
Gold miners (GDX) had an even better week, gaining over 10%. Long-term GDX is still in a bear market, but there is now denying the fact that GDX again failed to close below the seemingly important $13 level. If gold holds up and the dollar doesn’t resume its uptrend, we could see further upside in GDX. Next level to watch is the broken support that now turns first resistance at around $15.60.
CHAT OF GDX
CHAT OF GDX
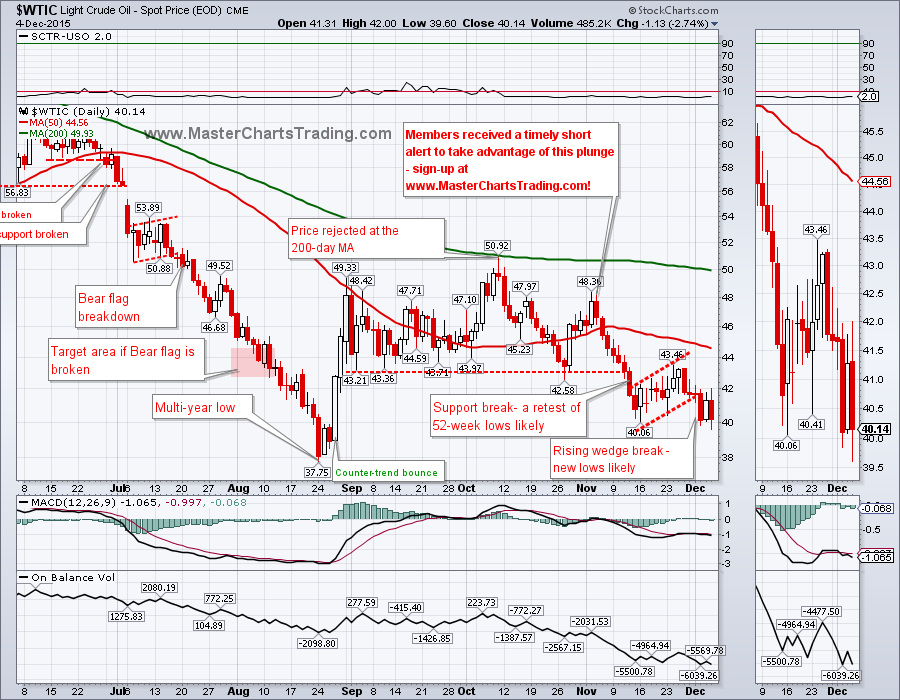
Oil got no relief from the weakening dollar and lost almost 4% this week to close at $40.14. On Wednesday oil broke the rising bear wedge, so a retest of multi-year lows at $37.75 is very likely now.
CHART OF OIL
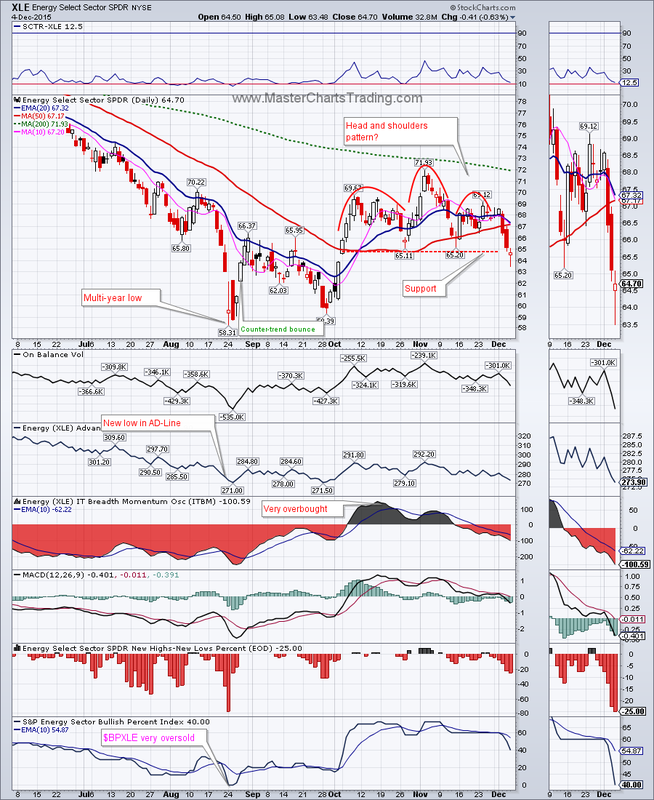
Energy ETF – XLE was one of the losers on Friday, even though the general market rallied strongly. XLE chart sports a possible Head and shoulders pattern and a possible neckline break on Friday. If this is indeed so, we could see multi-year lows retested in the near future again.
CHART OF XLE
CHART OF OIL
Energy ETF – XLE was one of the losers on Friday, even though the general market rallied strongly. XLE chart sports a possible Head and shoulders pattern and a possible neckline break on Friday. If this is indeed so, we could see multi-year lows retested in the near future again.
CHART OF XLE
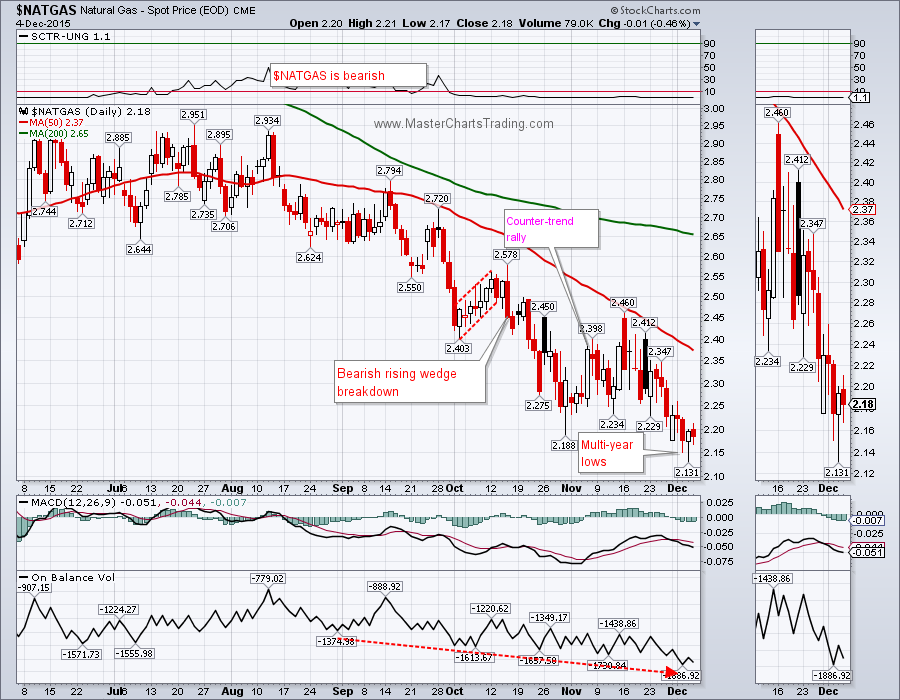
Natural gas hit multi-year lows again on Thursday at $2.131. Is this the bottom? Who knows, but I am not trying to pick it! I will be patiently waiting for a rebound to short again. A decent rebound should take $NATGAS to around $2.45 at which point it would present a great shorting opportunity (once the bear trigger is present).
CHART OF $NATGAS
CHART OF $NATGAS
Our Trade Alerts Service is now live. Please take a look here and sign-up for!
That’s it for this week’s market recap,
Best Regards and have another great trading week!
Alexander Berger (www.MasterChartsTrading.com)
That’s it for this week’s market recap,
Best Regards and have another great trading week!
Alexander Berger (www.MasterChartsTrading.com)


 RSS Feed