|
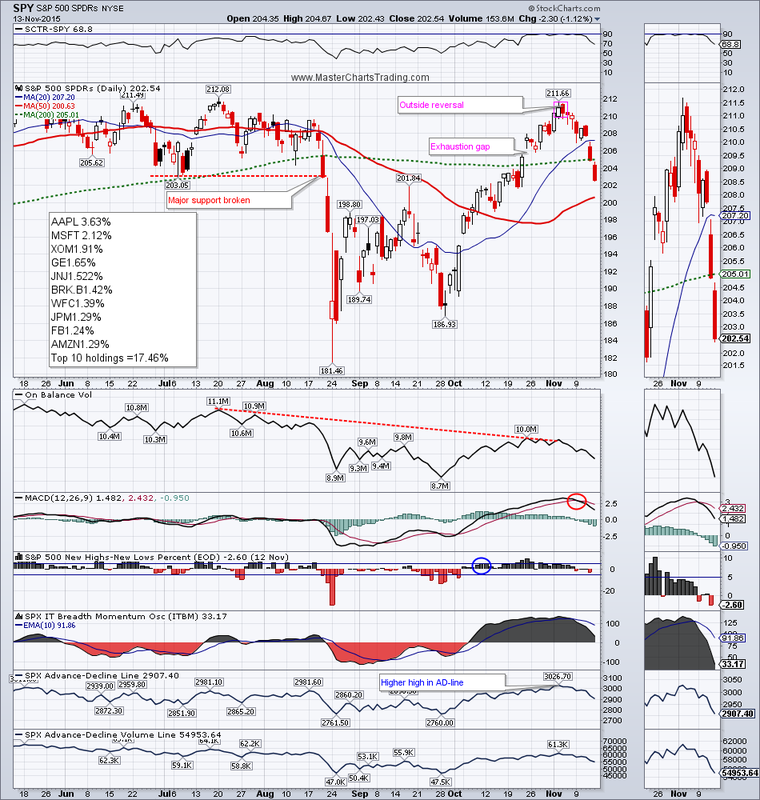
Stocks are down for the week as they erased 3 weeks worth of gains in just a few days. If you watched several of my videos starting around the beginning of September, you will notice that I maintained a bearish bias since then. Powerful rally notwithstanding, I think this was indeed a counter-trend move, and another leg down is just starting.
CHART OF SPY |
|
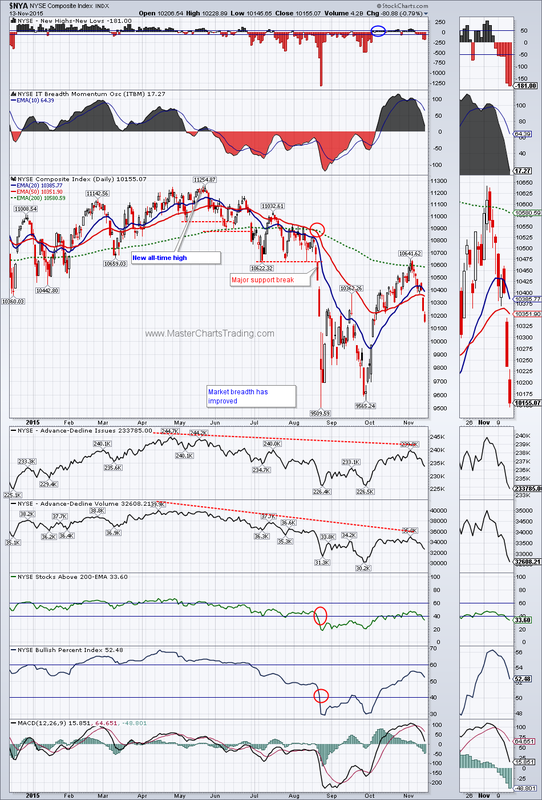
Multiple market breadth indicators were flashing warning signs as early as April of this year. For example the Advance-Decline lines for $NYA were trending down since then. After the August breakdown many more breadth measures have turned bearish and never recovered. For example neither the Bullish Percent index nor the Percent of stocks above the 200-day EMA have yet recaptured the 60% marks. In the past similar setups led to more downside before any meaningful recovery took place.
CHART OF $NYA
CHART OF $NYA
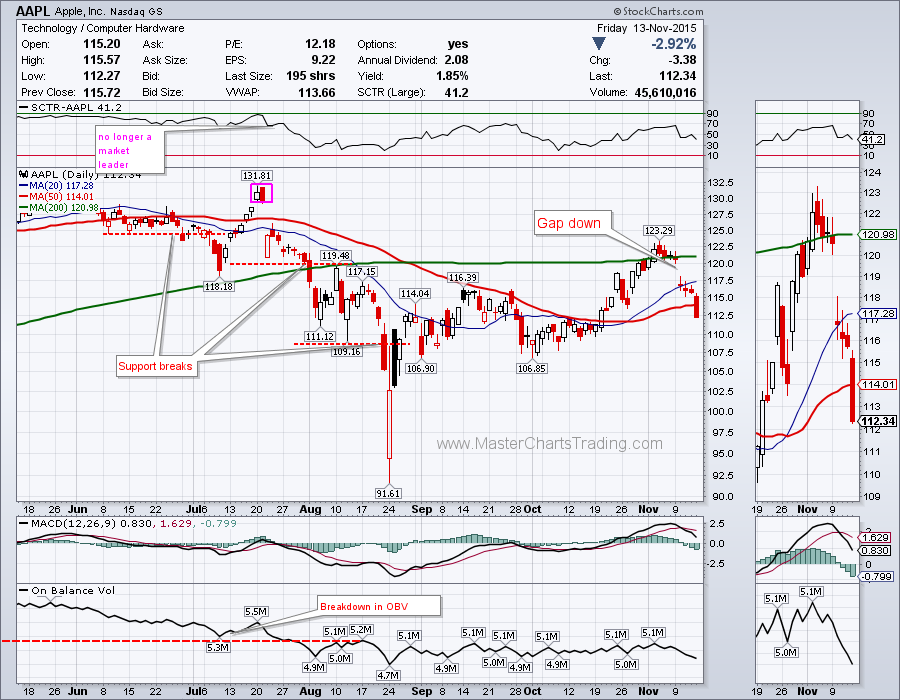
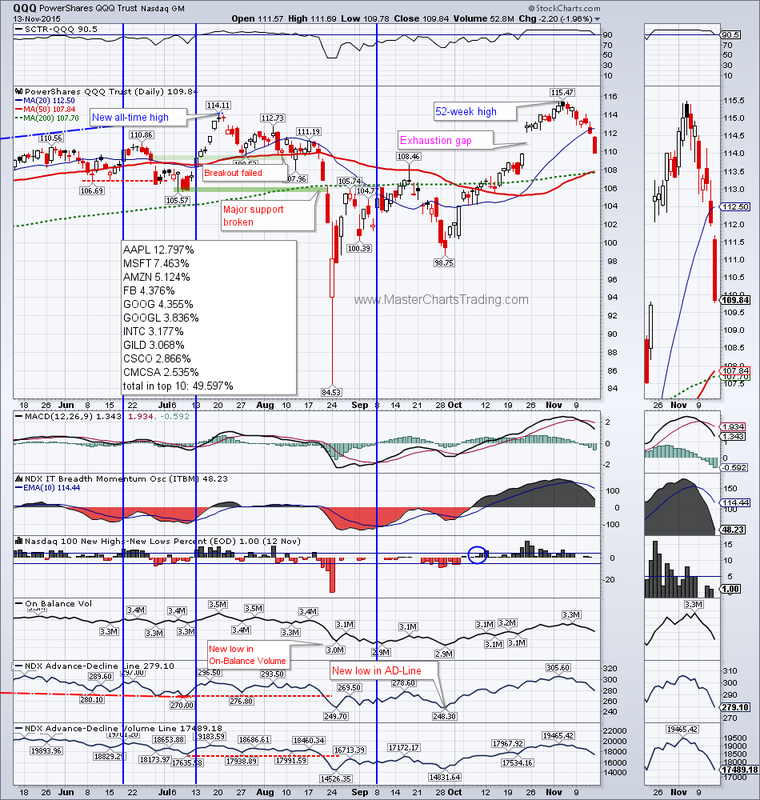
Apple represents almost 13% of QQQ and its down over 7% for this week alone. Unsurprisingly, QQQ came under selling pressure and lost over 4% for the week - even more then SPY. Stocks are highly correlated, so weakness in the general index would likely transfer to other indices given enough time.
CHART OF AAPL CHART OF QQQ
CHART OF AAPL CHART OF QQQ
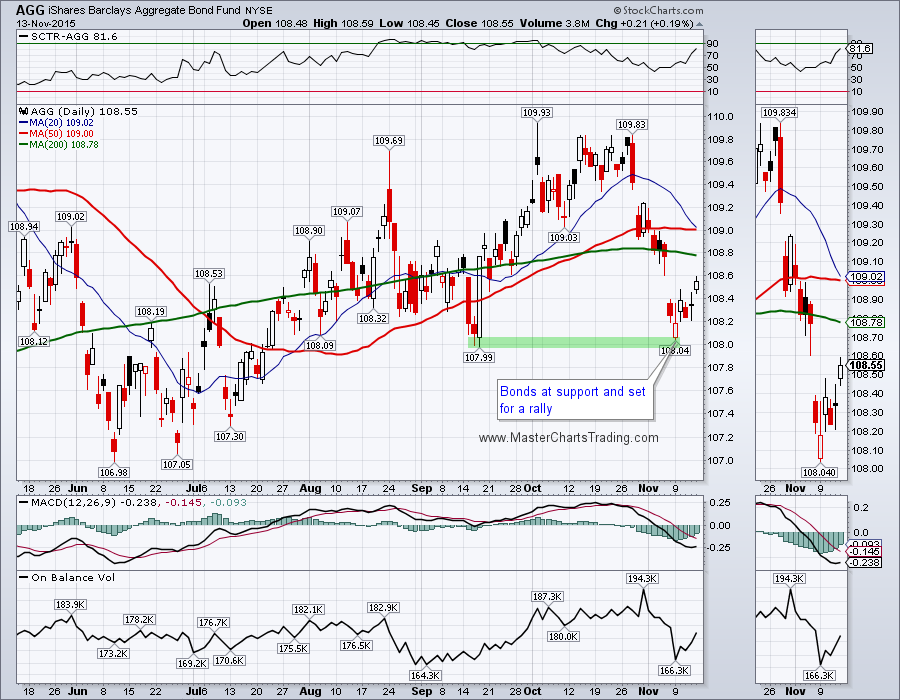
Bonds (AGG) benefited this week as stocks sold off. Never mind all the chatter about the interest rates going up - investors want protection against the downside and bonds are the traditional go to during the times of market stress. AGG held support from last week and rebounded, while at the same time it closed the gap down from last week. If stocks come under further selling, bonds are almost sure to benefit.
CHART OF AGG
CHART OF AGG
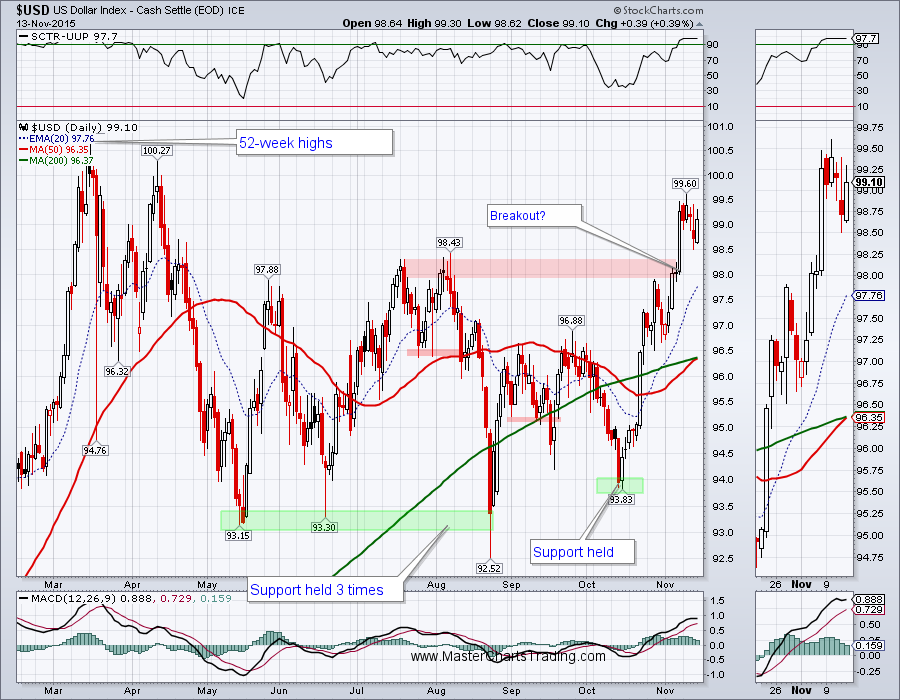
Last week the dollar index broke out above the August highs. This week a throwback of sorts materialized, as price of $USD probed the validity of this breakout. For now the breakout seems to be holding. I am starting to sound like a broken record, but strength in the dollar is weighing on commodities of all sorts.
CHART OF $USD
CHART OF $USD
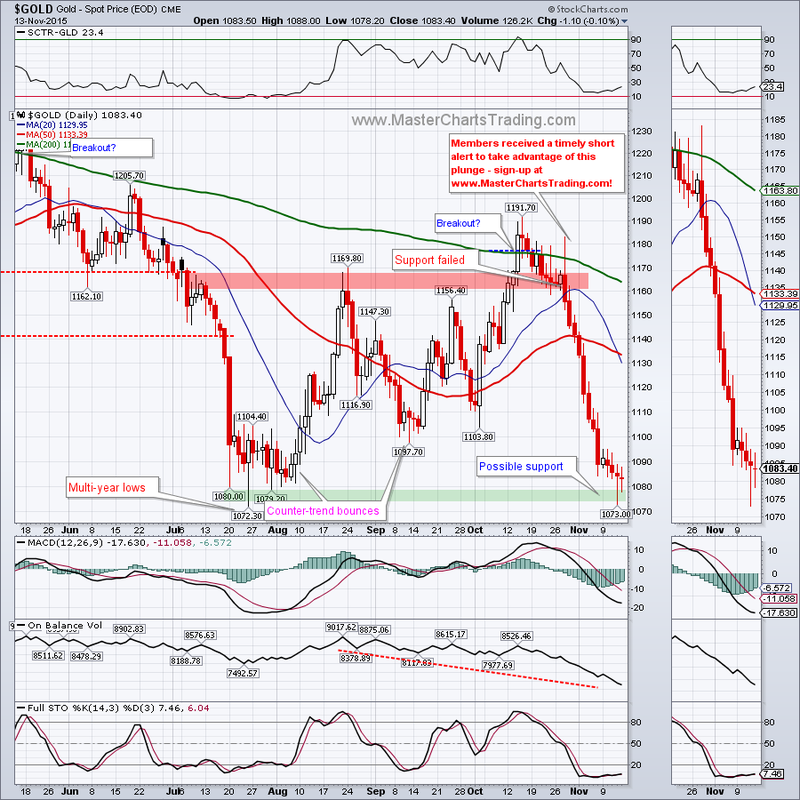
Gold is one such commodity. Gold is currently at a critical support retesting its July and August lows. This is following a massive October breakout failure. (Members were alerted about this breakdown in a timely manner.) Gold is somewhat oversold, so we cannot rule out a rebound to around $1100. An alternative scenario of course is a support break and a run down to the $1000 area.
CHART OF GOLD
CHART OF GOLD
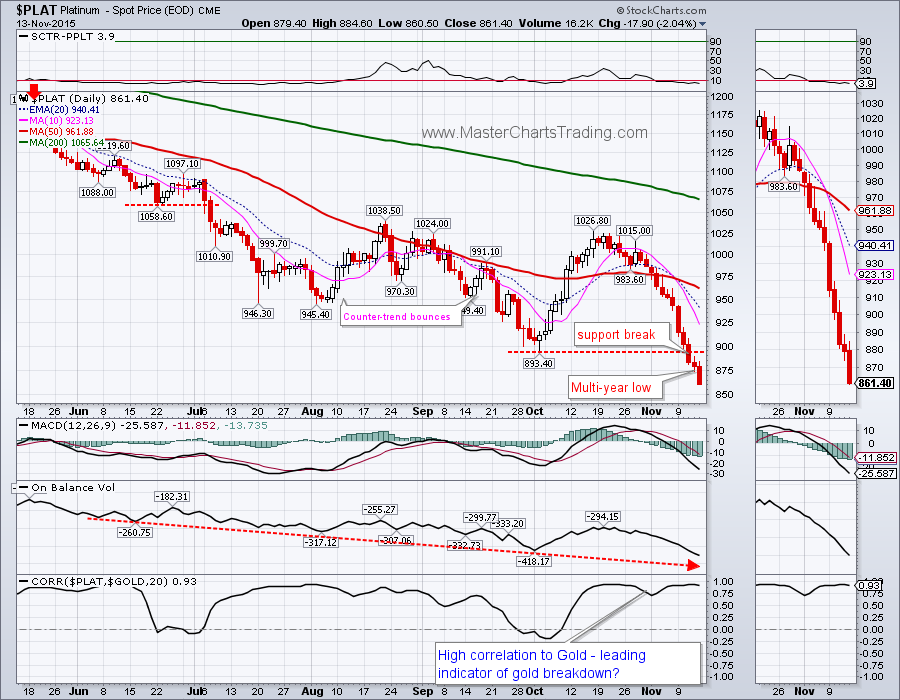
I don’t normally trade platinum, but its chart caught my attention. Platinum already broke below its October and July lows and hit multi-year lows. Correlation between platinum and gold is very high, could this platinum breakdown be a leading indicator for gold?
CHART OF PLATINUM
CHART OF PLATINUM
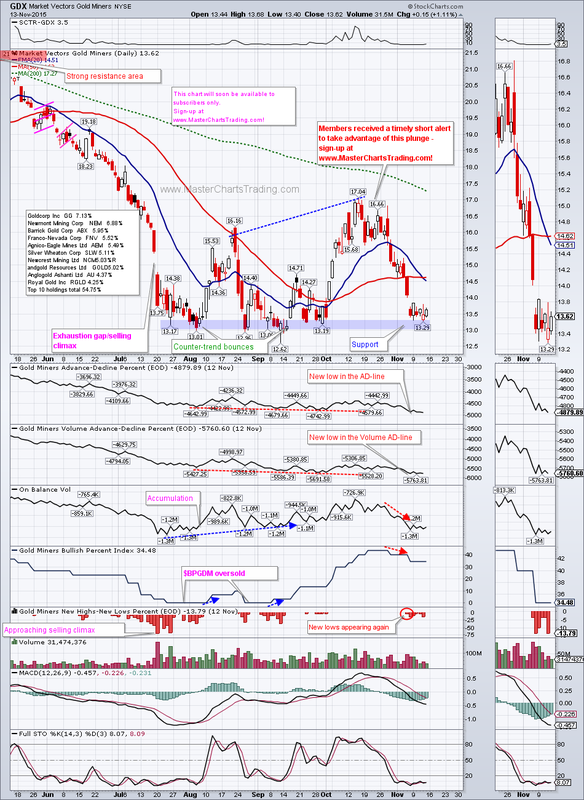
GDX is also at support again around $13. This $13 area seems to be of high importance to GDX. GDX tested this $13 area numerous occasions in the past few months – and held it. Will this time be different? Anything is possible, especially if the dollar weakens and gold firms up. However judging from the market breadth data available for GDX, this support may not hold this time around. The AD-lines for GDX are hitting new lows while the momentum indicators are not yet terribly oversold, this indicates a strong possibility of a support break.
CHART OF GDX
CHART OF GDX
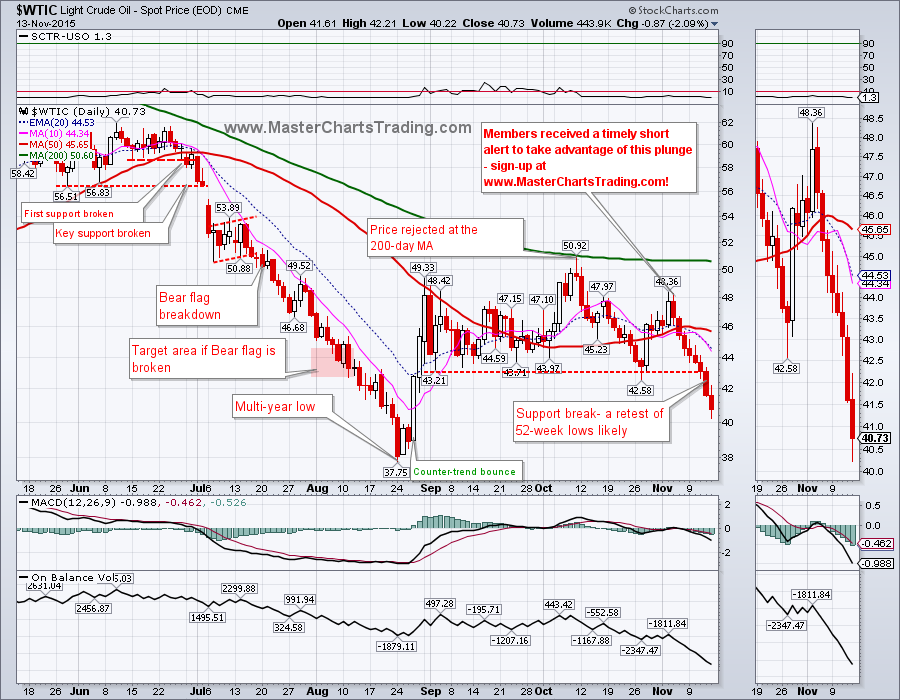
Oil finally broke below the $43.21 level I kept mentioning and continued lower on Thursday and Friday. A retest of multi-year lows at $37.75 is now very likely. There seems to be a glut of oil in the world with few indications of either the supply tightening or the demand increasing meaningfully. (Members received a short alert on this oil trade in timely manner to take advantage of this breakdown.)
CHART OF OIL
CHART OF OIL
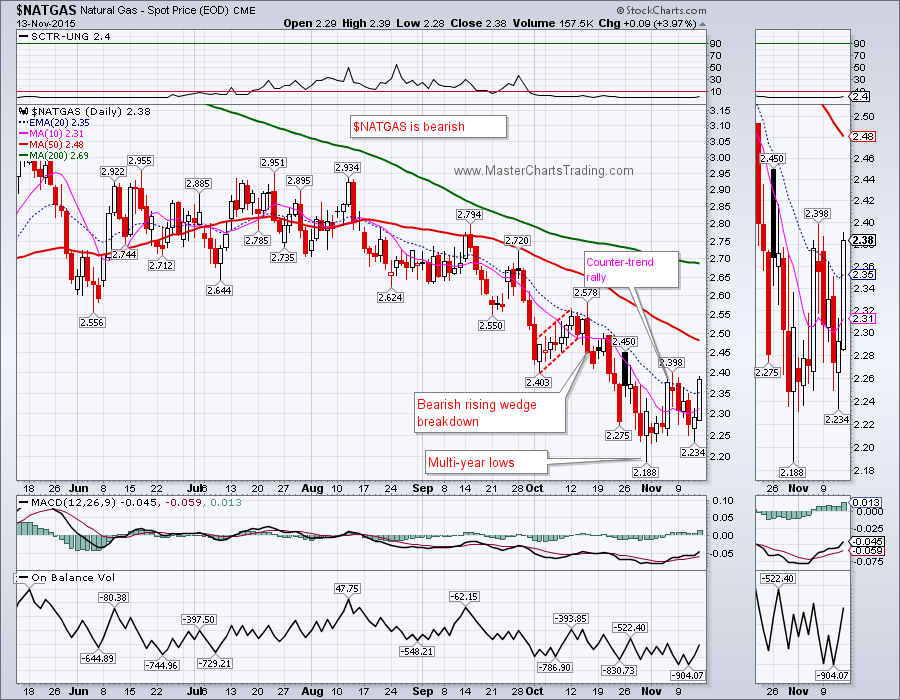
Natural gas ($NATGAS) held support in the end of October and rebounded, some backing and filling occurred this week, but the support at around $2.20 seems to be holding and this bear-market rally looks to continue. Maybe it could get to around $2.50 before the bears step in again?
CHART OF $NATGAS
CHART OF $NATGAS
That’s it for this week’s market recap,
Best Regards and have another great trading week!
Alexander Berger (www.MasterChartsTrading.com)
Best Regards and have another great trading week!
Alexander Berger (www.MasterChartsTrading.com)


 RSS Feed