|
Stocks finally ran into some meaningful resistance close to the all-time highs - SPY has been in a corrective mode for the past 3 sessions. Stocks are very overbought on multiple indicators and are certainly ripe for a pullback, but bears are still having trouble sinking their claws in. How this pullback will unfold is anyone’s guess, but this week we will look at the examples of market corrections from 2011 and 2008 to see how they compare to today.
Chart of SPY |
|
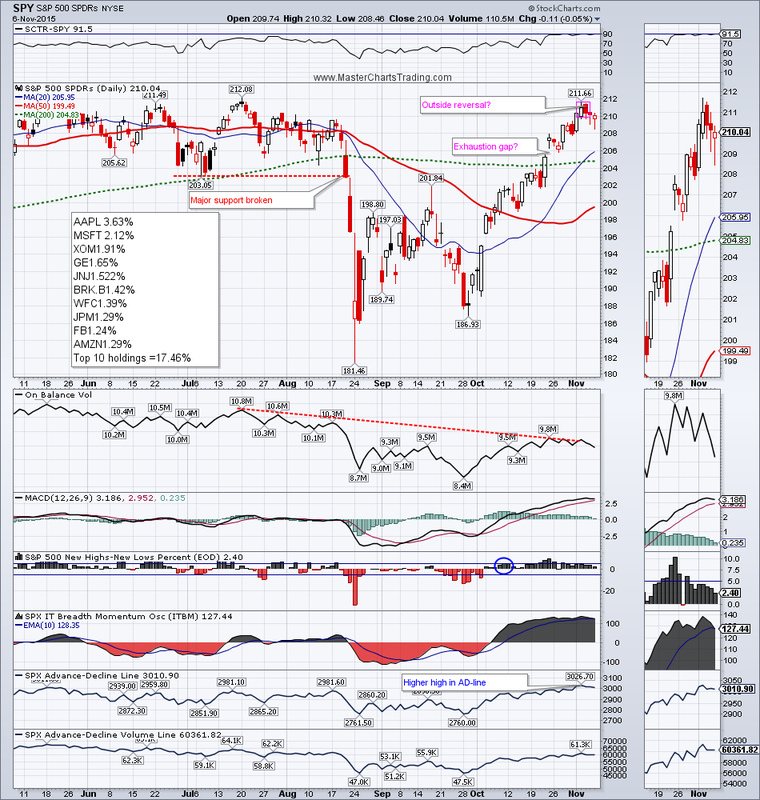
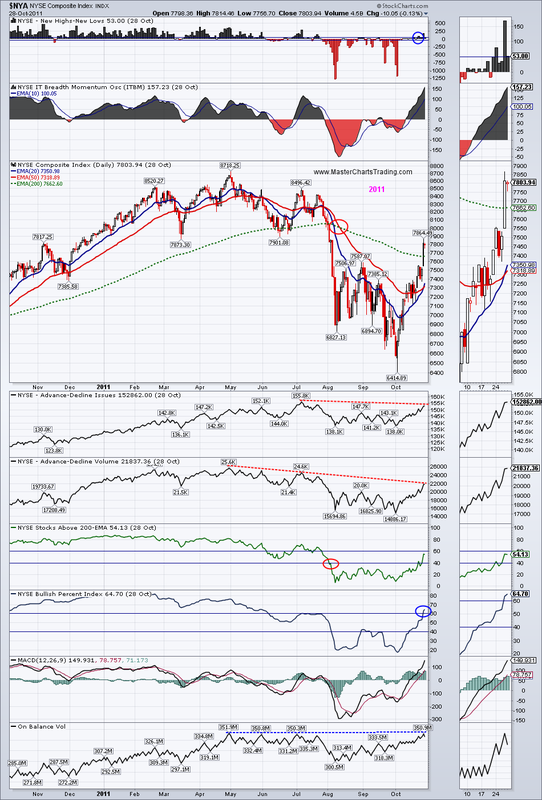
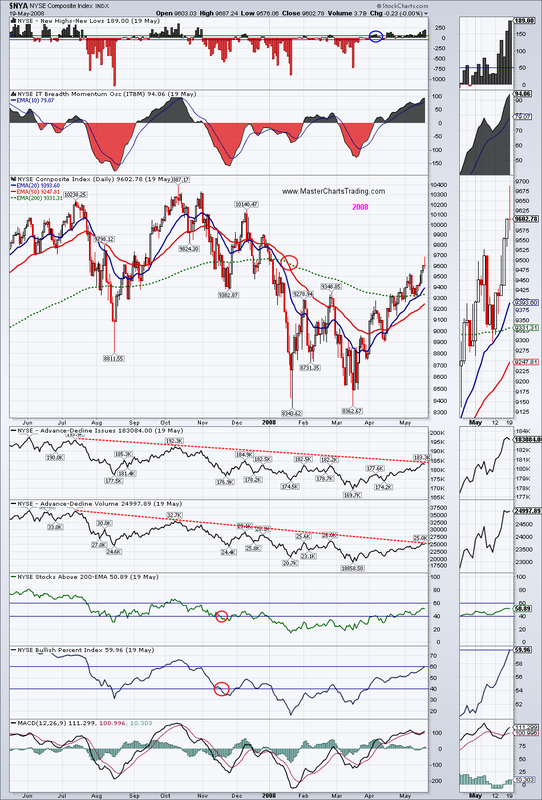
The similarities between the current market charts and those from 2011 and 2008 are uncanny. In all instances there was a sharp drop in prices to below the 200-day exponential moving average (EMA). Then the 50-day EMA crossed below the 200-day EMA. Then the index found support, rallied hard and broke out back above the 200-day EMA. Both in 2008 and in 2011 the price again rolled over below the 200-day EMA to retest this breakout. The 2011 breakout held, while the 2008 breakout failed and turned into a vicious bear market.
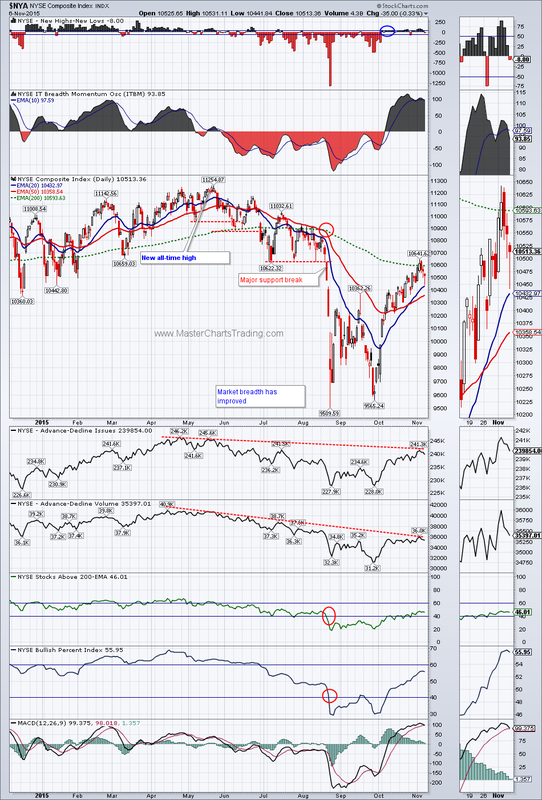
Looking at the underlying market breadth indicators the picture today looks more like the one from 2008 then from 2011. The Advance-Decline (AD) lines and AD-volume lines look very similar in all 3 cases, but the key difference between the 2011 and 2008 was the length of time that AD-lines were trending down. In 2008 and currently, the AD-lines were trending down for an extended period of time. In 2011 the downtrend in AD-lines was relatively short.
Another key difference between the 2011 correction and the start of 2008 bear market was the Bullish Percent index ($BPNYA). In 2011 the $BPNYA recovered above the 60 percent threshold very quickly. In fact by the time $NYA broke out above the 200-day EMA, the $BPNYA was also above its 60% line. In 2008 the $BPNYA came very close to breaking above the 60% line, but failed just short of it. Currently the $BPNYA is below the 60% line and seems to be rolling over again.
Current chart of NYA
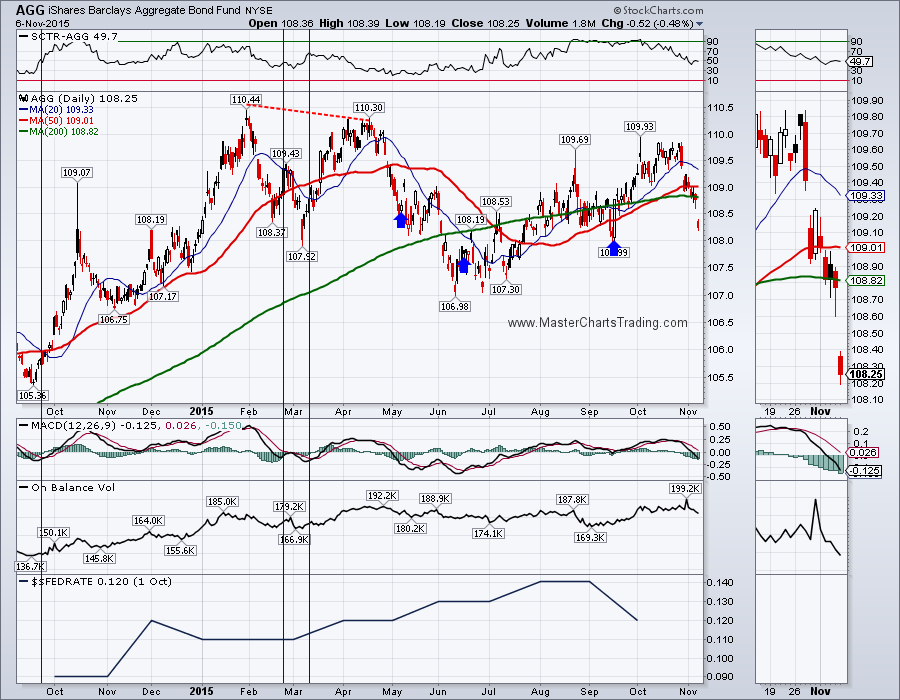
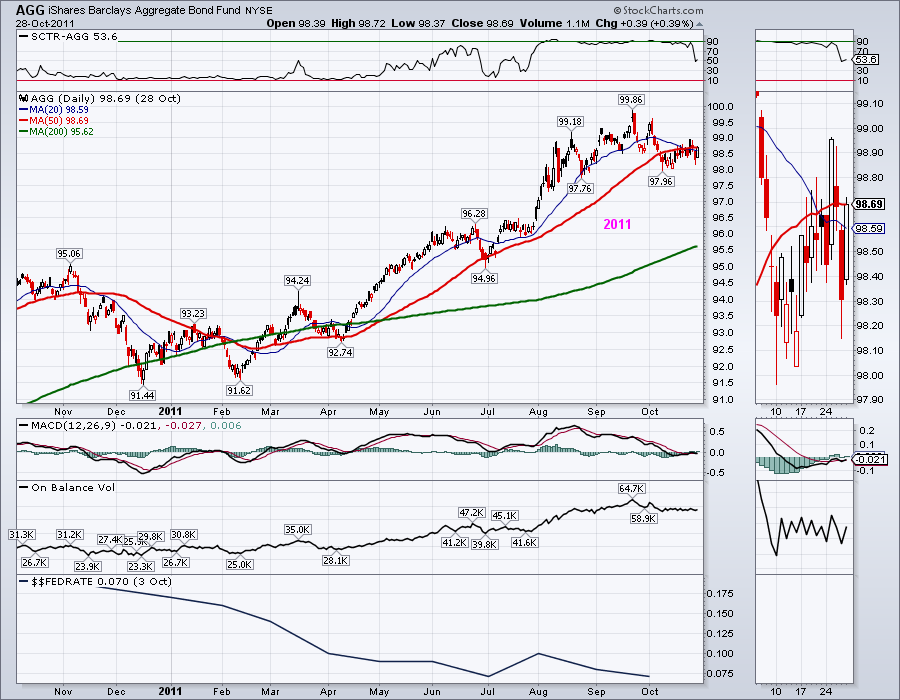
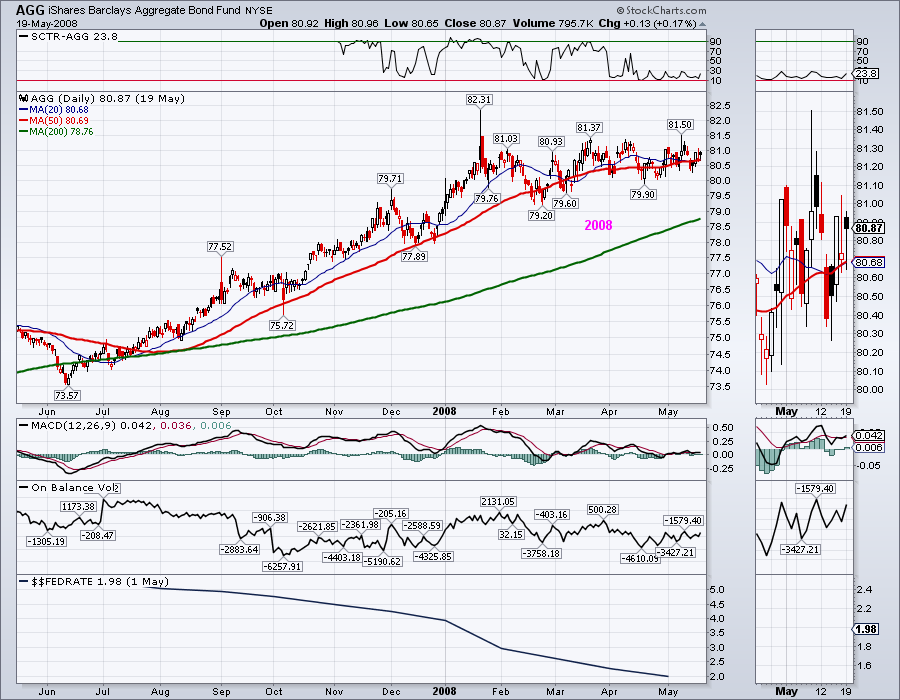
A lot of excitement recently occurred around the very positive jobs report. Bonds did not like the report at all and sold-off across the board. But did the major trend changed for bonds? So far, I don’t think so. Bonds, especially the longer-term once, don’t necessarily react that strongly to the changes in the short-term Federal funds rate. Below are 3 charts for AGG (diversified bonds) from the time periods I described above. I put the Federal funds rate in the bottom indicator windows on each of the charts. Notice that sometimes bonds go up when rates go up, while sometimes the opposite happens. Its difficult to predict what bonds would do, although generally speaking higher rates are bad for bonds. Point of this exercise is that bonds act more like a go to instrument in times of a financial uncertainty, especially when stocks are selling off.
Current AGG chart
Current AGG chart
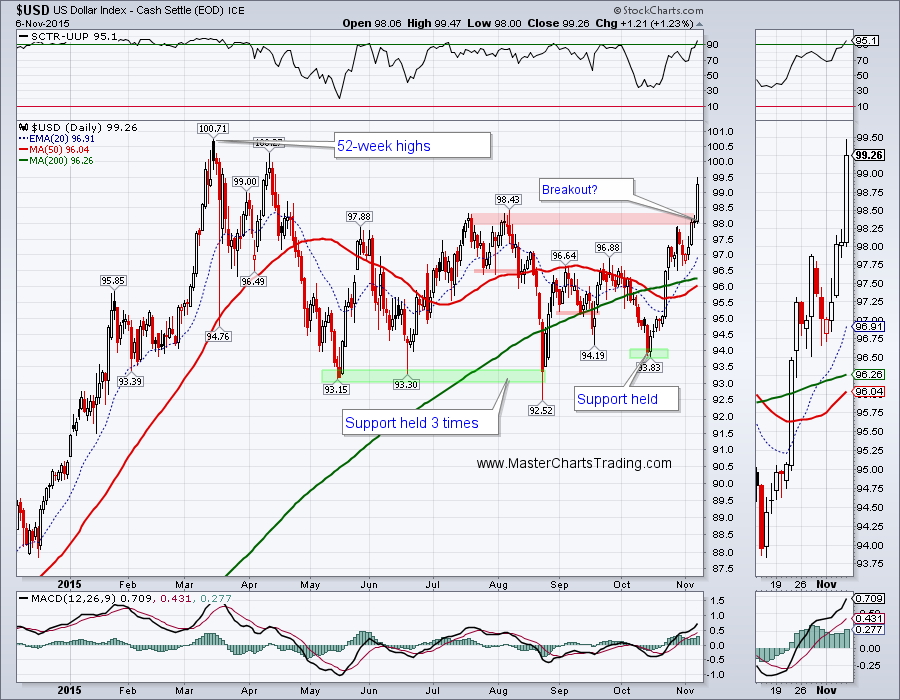
The US dollar index has tentatively broken out above the recent resistance levels and is challenging its 52-week highs. While the rest of the world is printing money, the US has (for now) stopped doing so and is even contemplating raising interest rates in December. This is positive for the US currency. Predictably, a strong US dollar is putting additional pressure on commodities again.
Chart of US dollar index
Chart of US dollar index
Gold is one such commodity. Contrary to what some may say about gold being the ultimate currency, if I was to go out to a store to buy milk, I would not be able to do so with a gold nugget. I still would need either paper money or digital money of some sort. To reiterate - gold is a commodity.
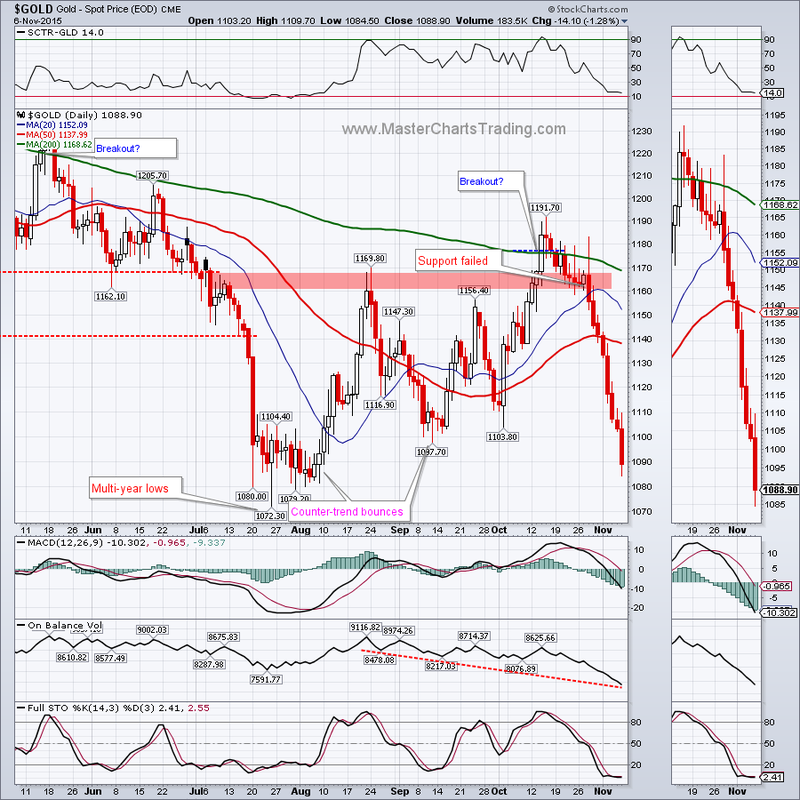
Gold does poorly when US dollar is rising, and this week was no exception as gold lost 4.62%. The price landed at the previous support levels and is again challenging its 52-week lows. Will more selling take place next week? Its hard to say, but should the dollar continue to go up, I would not be surprised if gold breaks the support at $1080 and continues down. Gold is somewhat oversold, especially on the Money Flow Indicator, so a bounce here is also possible.
Gold chart
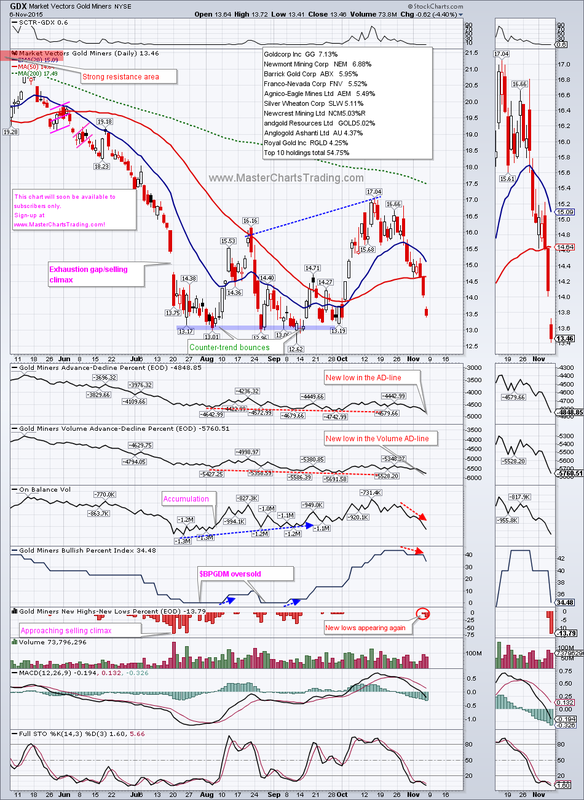
Gold miners (GDX) are acting similarly to gold, but are down over 10% for the week. Market breadth for the gold miners indicates that there is certainly more room for them to fall. New lows were registered in the AD-lines for GDX. Heavy volume on the down days is pushing the On-balance volume indicator lower and lower. The Bullish percent index is again rolling over to the downside, while at the same time the individual stocks within GDX are registering new lows. GDX is rapidly approaching the $13 area, which seems to be important to it. As I mentioned several month ago, there is now decent support there. Should that support give, we could easily see prices for GDX at around $10. (Note, this chart of GDX will soon become available to subscribers only)
Chart of GDX
Chart of GDX
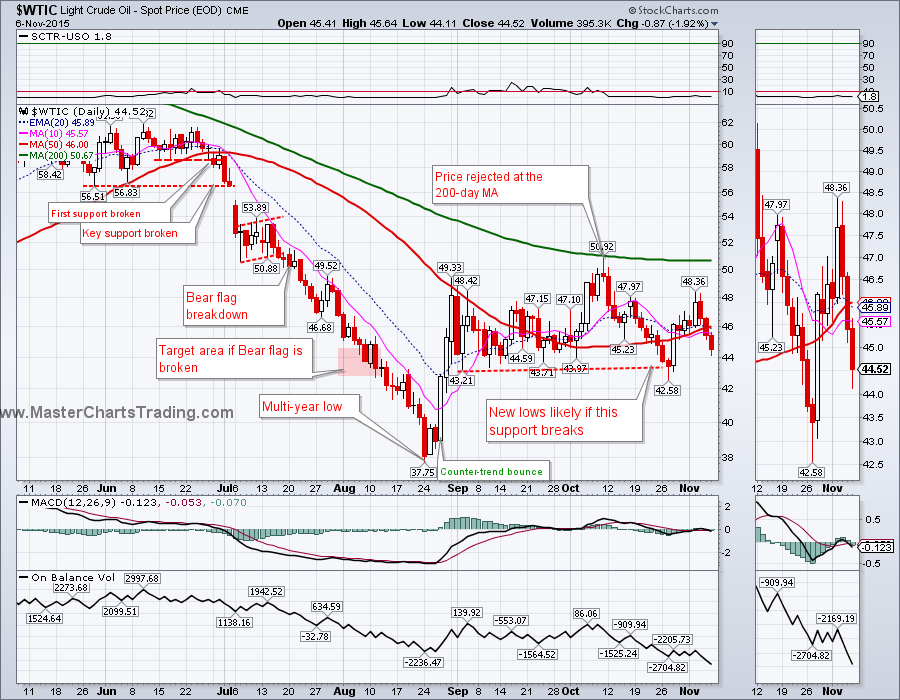
Oil ($WTIC) prices are being pushed down by the strengthening dollar too. On October 28th oil popped higher and I thought that the downtrend has at least temporary stopped. But it seems that this was short-lived and this week the downtrend resumed. Again, a close below $43.21 would likely cause a flood of sell orders to execute and oil may re-challenge its 52-week lows.
Chart of $WTIC
Chart of $WTIC
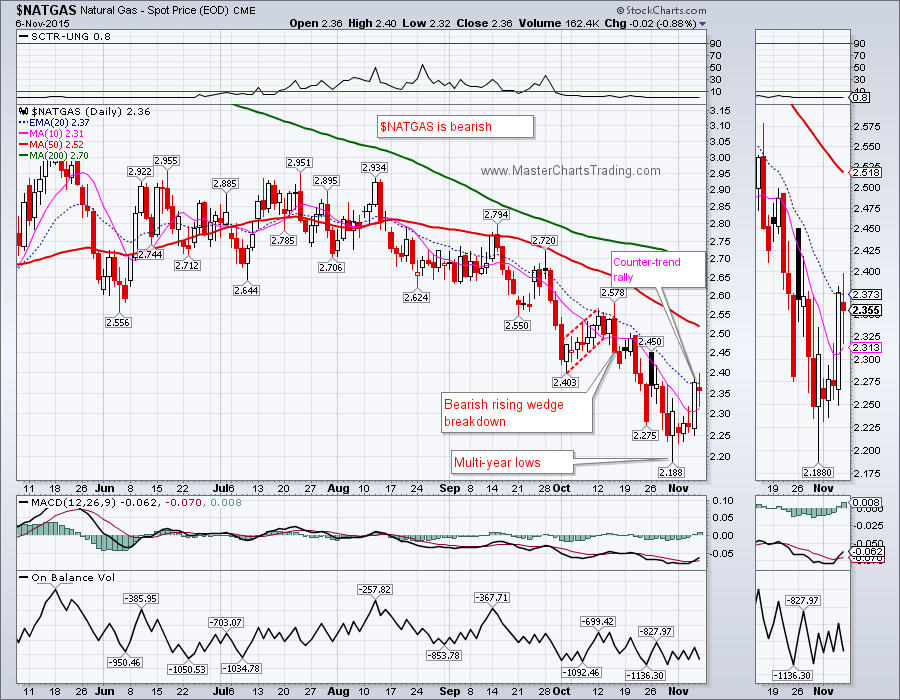
Natural gas ($NATGAS) hit multi-year lows last week and rebounded with a hammer-like candlestick. This week we saw more upside as this counter-trend rally continued. I am guessing $NATGAS may rebound to around $2.50 before the bears step in again.
Chart of $NATGAS.
Chart of $NATGAS.
That’s it for this week’s market recap,
Best Regards and have another great trading week!
Alexander Berger (www.MasterChartsTrading.com)
Best Regards and have another great trading week!
Alexander Berger (www.MasterChartsTrading.com)


 RSS Feed