|
Stocks closed out the first week of trading sporting a dubious distinction. Dow Jones delivered the worst first 5 trading days of the year performance ever. Ever, as in the entire history of Dow Jones Industrial Average that goes back to February 16, 1885! If you are a stock bull you certainly don’t want to hear anything of this nature. If you are currently a stock bear like me – this is music to your ears. What now? This is the most common question on everyone’s mind
|
|
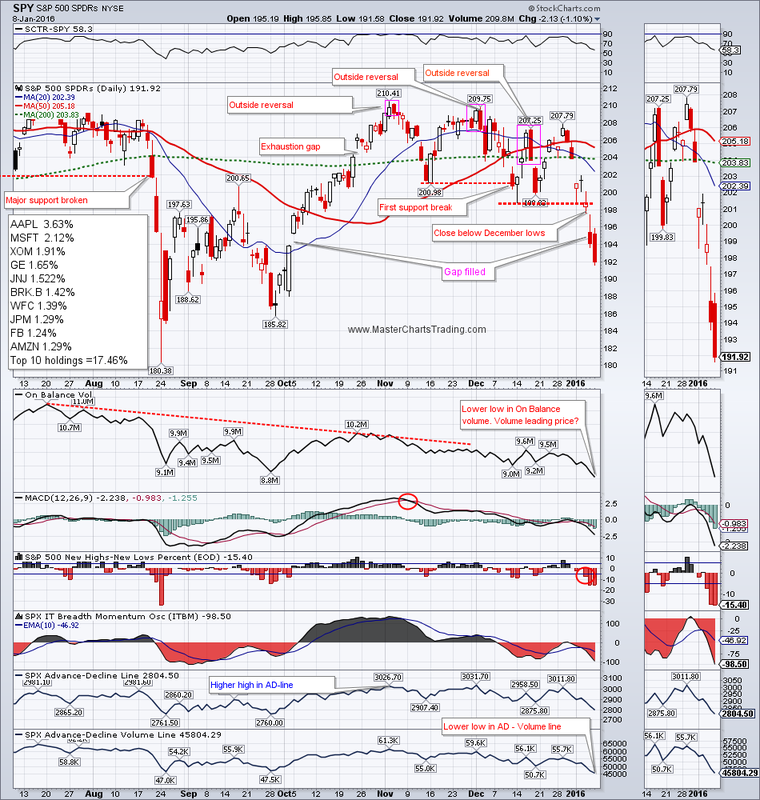
SPY has probably peaked in May of last year. We had a waterfall-like event in August 2015 as it broke major support, but quickly rebounded. My proprietary Market Breadth Index (MBI – contact us for licensing) signaled the beginning of a bear market as early as September of last year. This changed my entire posture from that of looking for buying opportunities within a bigger uptrend for stocks, to that of looking for shorting opportunities within a bigger downtrend.
At this point a retest of August lows for S&P500 appears extremely likely. A break below the August 2015 lows would be quite bearish. The On Balance volume and the Advance-Decline Volume line for SPY has already hit a new low for the move – before the index even got to the August lows. Could volume be the leading indicator of events to come?
Very short-term SPY is somewhat oversold and could bounce to the $200 area. But this could be an opportunity for those short sellers who missed the shorting opportunity in late December to get short.
CHART OF SPY
CHART OF $SPX
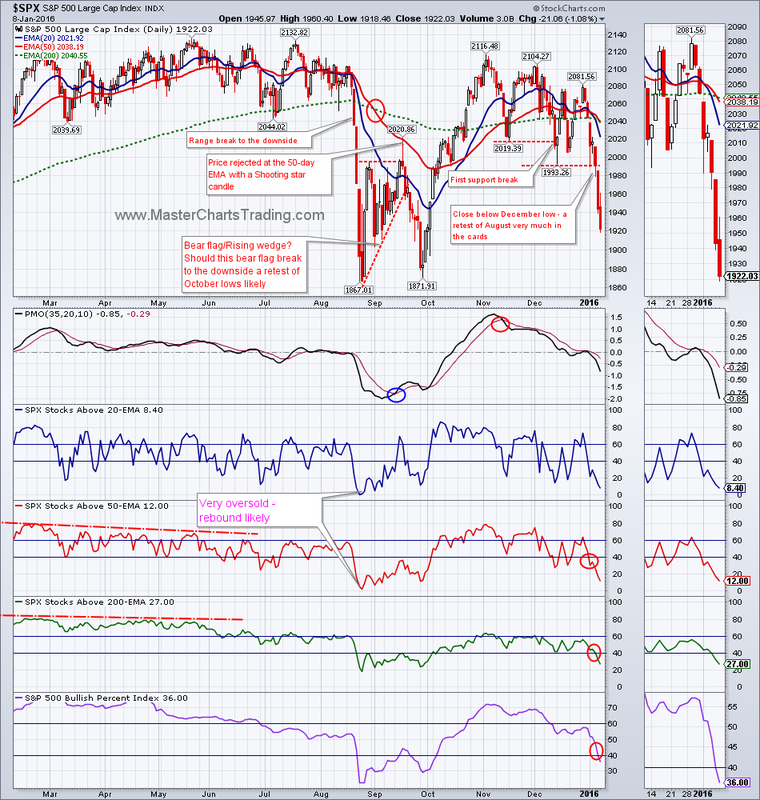
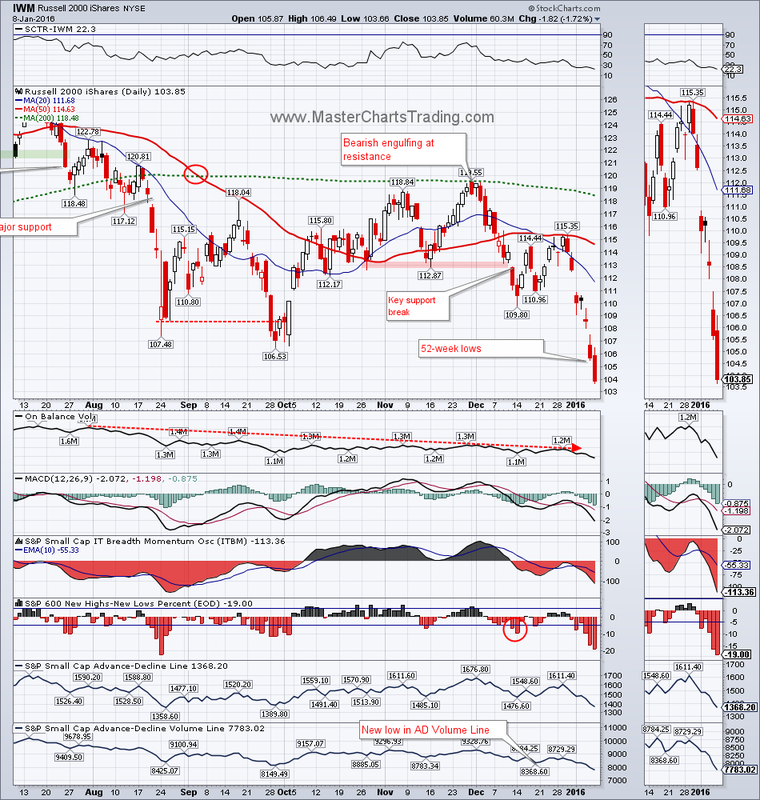
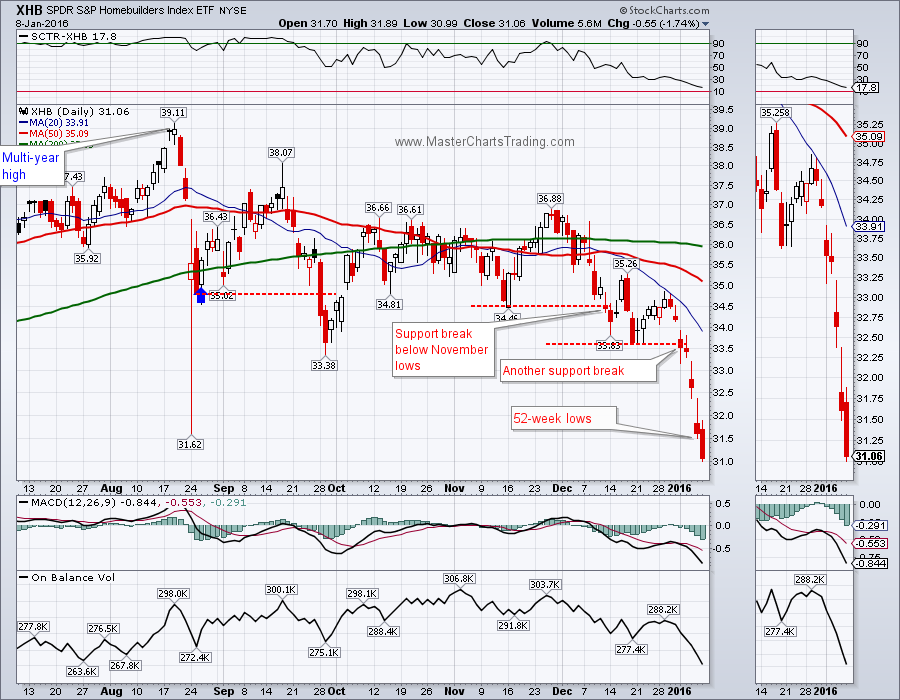
Various other major indices are already trading at or below the August 2015 lows. Namely: the Small caps, the Homebuilders, Energy, Emerging markets and the NYSE composite itself! This shows a broad, persistent selling pressure in the USA and abroad.
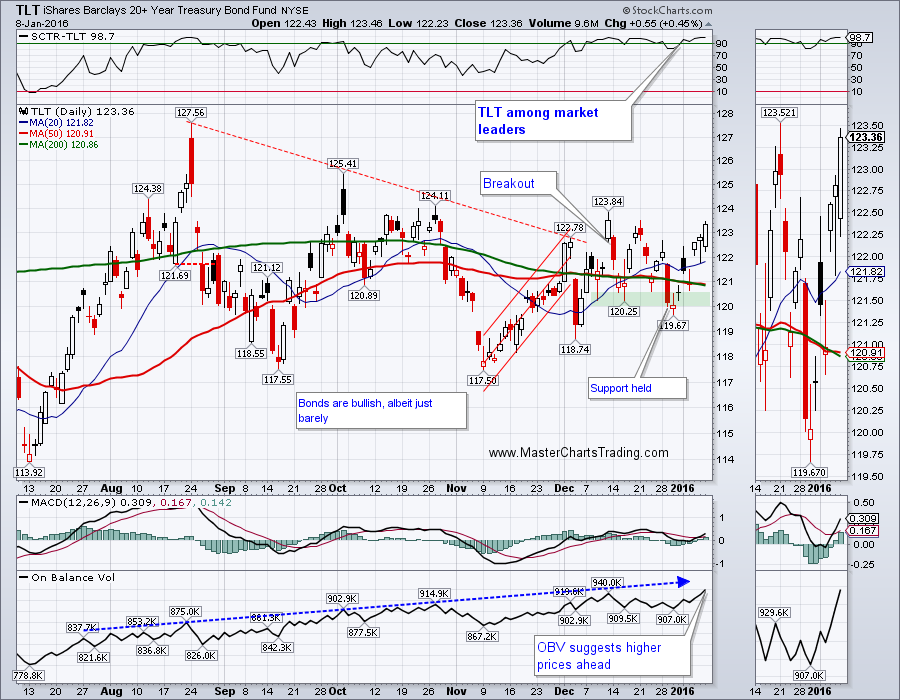
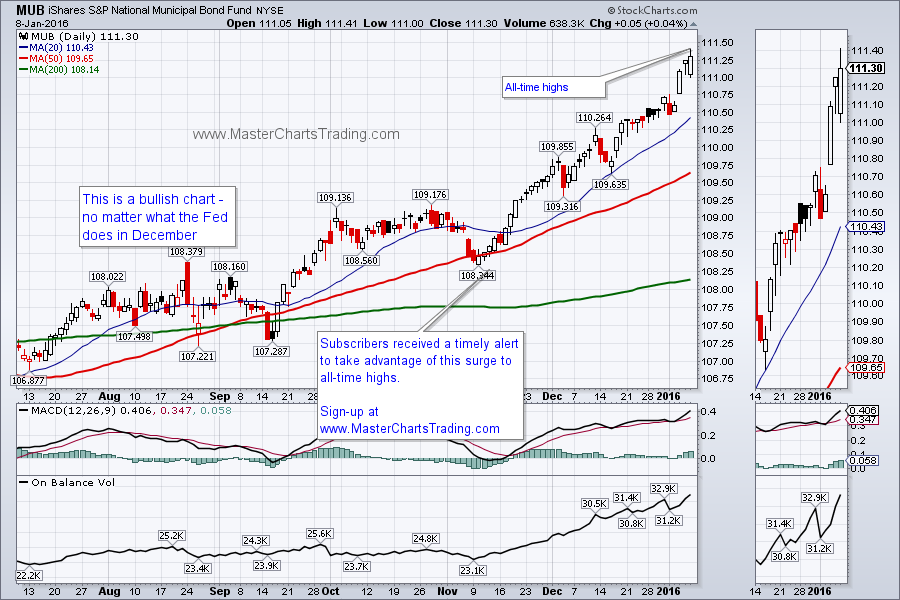
So what’s an investor to do? Where can one find shelter from this selling in stocks? As I continue to stress – cash is always an option. An alternative to cash is of course bonds. Bonds of all sorts either held supports after the November swoons, or actually broke out to new highs to become the new market leaders. I can’t say that TLT is the ultimate place to be, but if my bearish predictions are correct, TLT could massively pop in the near future. Municipal bonds (MUB) are the clear winners at this juncture as they continue to hit all-time highs.
CHART OF TLT
CHART OF MUB
CHART OF TLT
CHART OF MUB
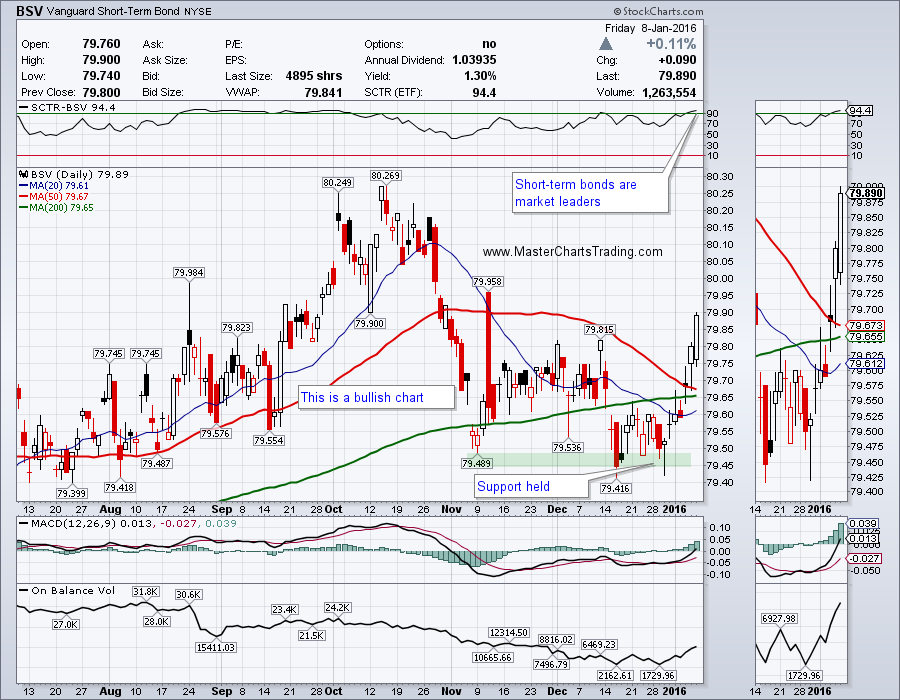
If you need any further proof of the cautious investor stance, look at the short-term bond fund - BSV. You would be hard-pressed to find a more conservative investment option then the short-term bonds. The fund held support after a bout of selling around the December rate hike, but now rebounded and is pushing towards all-time highs again. This is showing elevated levels of fear as money is rotating out of stocks.
CHART OF BSV
CHART OF BSV
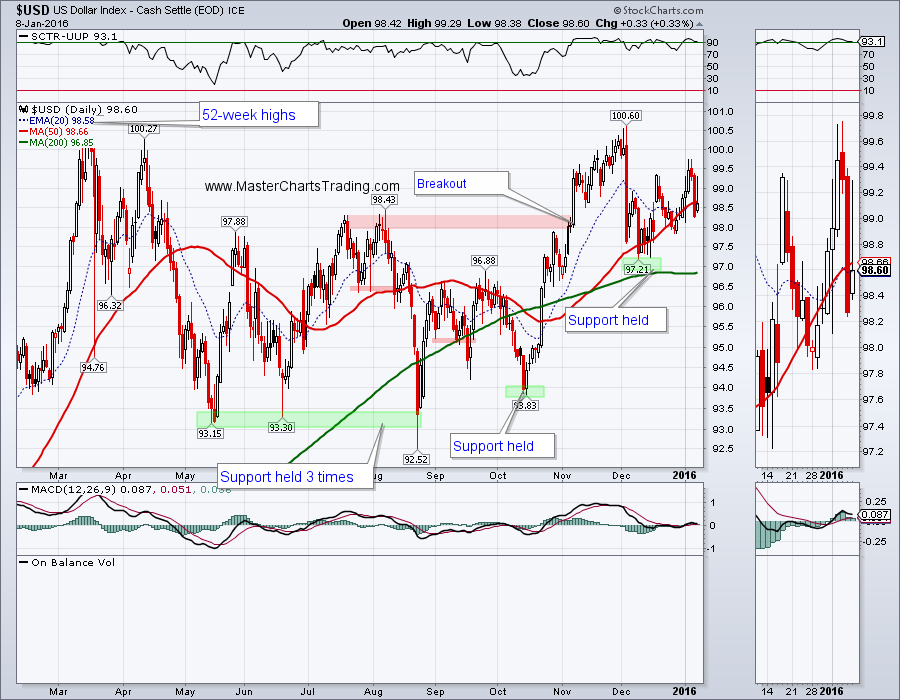
The Dollar is poised to challenge the 52-week highs again. In December it held support and since continued making higher highs and higher lows.
CHART OF $USD
CHART OF $USD
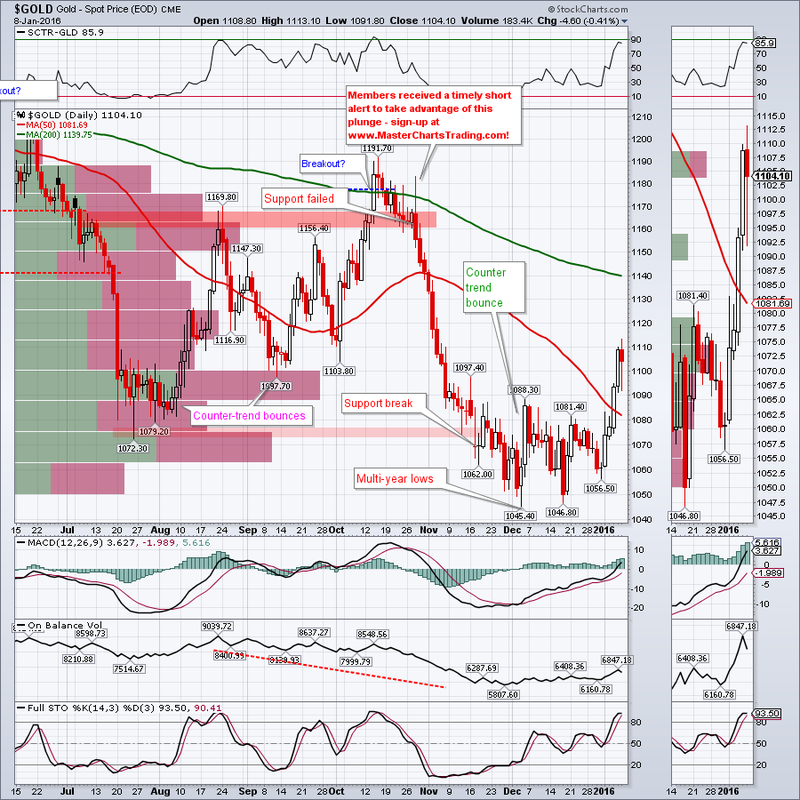
Gold got a pop this week and managed to close above the 50-day moving average for the first time since November of last year. Gold is long-term bearish and is locked in a bear market for over 3 years now. We now basically have a bearish setup. If we fail here, we could see new lows again. An alternative scenario is continuation higher to the 200-day moving average and the high volume resistance area around $1160. In either case I am not looking to go long gold, but to short on a rebound.
GOLD CHART
GOLD CHART
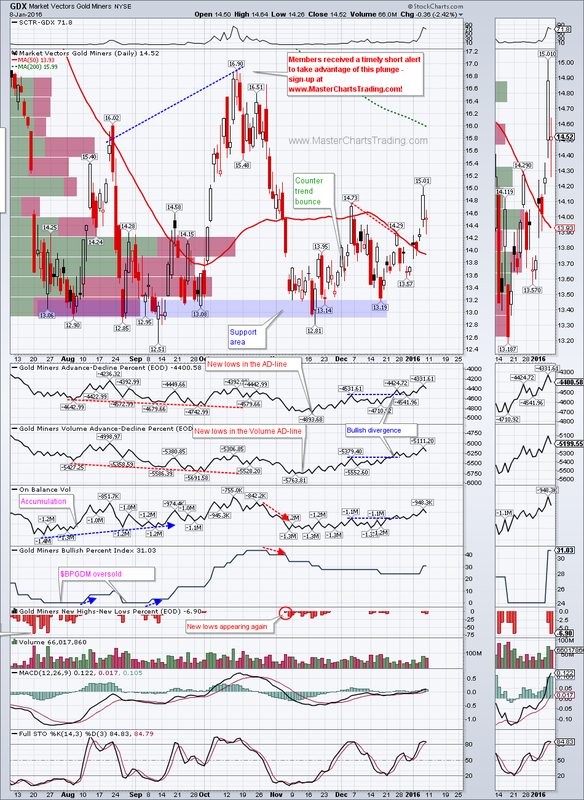
Two weeks ago I pointed out a bullish divergence on the chart of GDX. This week the divergence played out and we had a short-term higher high in GDX. I feel like GDX still has some juice left in it and it could continue higher to around $16. Chart for GDX is somewhat messy, but as with gold, I am not looking to pick bottoms, only to short this bearish security.
CHART OF GDX
CHART OF GDX
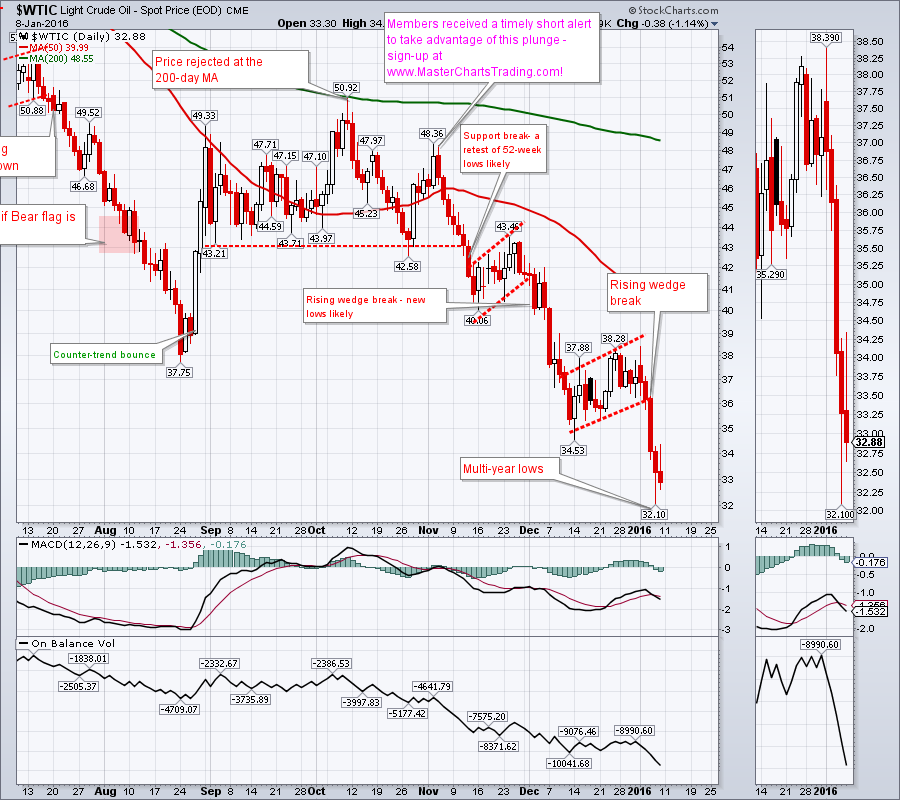
I pointed out a rising wedge formation on the chart of $WTIC in the last couple of weeks. Wednesday this rising wedge broke down and oil hit another multi-year low Thursday. Is oil done dropping? The rising wedge has probably played out for now, but I still think oil has some momentum to continue down to the upper $20s before putting in some sort of a bottom. My subscribers that opened an inverse position in mid-November are now sitting on over 100% profit in short crude oil fund (SCO). Sign-up today!
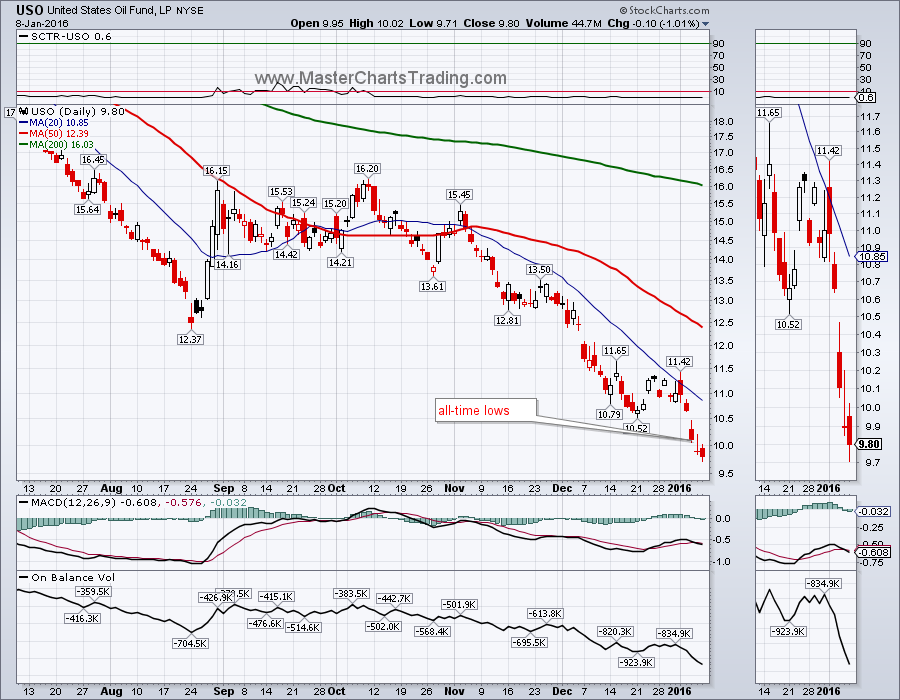
I had a question from a subscriber recently asking whether USO is a good investment vehicle? Here is my response:
USO is OK for trading, but it is put together using futures and does not track oil spot price in the long term. See this chart of USO. Notice that it hit an all-time low today. But oil ($WTIC) itself only hit multi-year low, not an all-time low. If you hold USO for a long time (several month) the performance will vary significantly from an underlying security.
CHART OF $WTIC
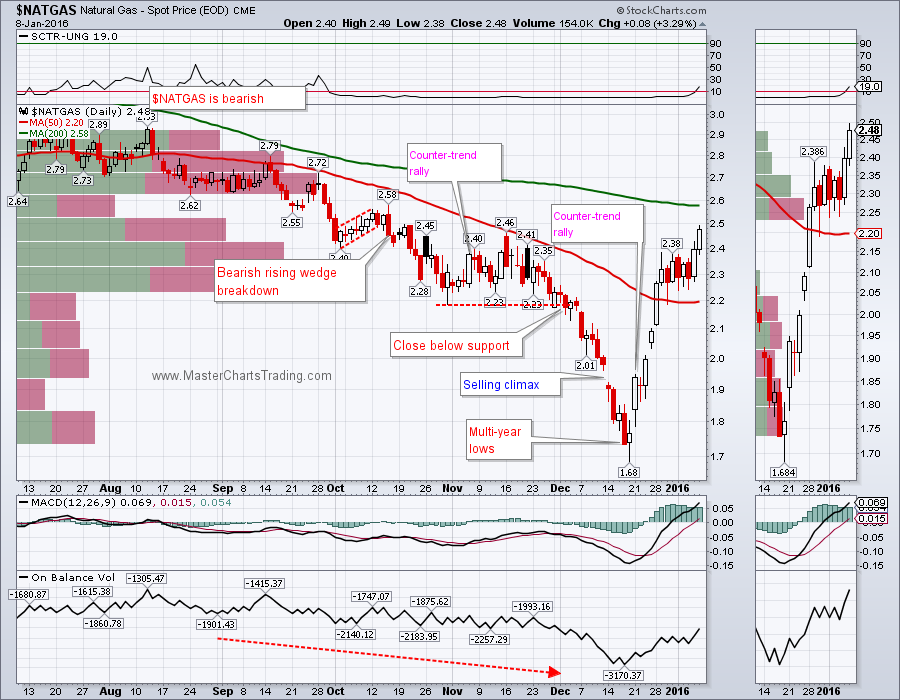
Natural gas may have broken above the recent highs and seems to continue its push towards the 200-day moving average. Again, as with other bearish securities, I am only looking to play this one on the short side. Another high-volume resistance area is very close at $2.70. I will be looking for failure signs there.
CHART OF NATGAS
CHART OF NATGAS
That’s it for this week’s market recap,
Best Regards and have another great trading week!
Alexander Berger (www.MasterChartsTrading.com)
Trade Alerts Service is now live – please sign-up here!


 RSS Feed