Master Charts Trading - Stock Market Indicators & Trade Alerts
Connect To Us!
  • MasterChartsTrading
  • Blog
  • Sign-Up
  • Members
    • Elite Trading Blog
    • Stock Speculator Blog
    • Training Library >
      • Basics of Trading
      • Risk & Trading Psych
      • Trend Identification
  • Help
    • Hall of Fame
    • Social
    • About Us
    • Contact
    • FAQs
    • Disclaimer
    • Refund Policy
    • Privacy Policy
    • What We Trade
    • Newsletter samples

Market Recap: March 17, 2017 - SPY QQQ IWM DIA XLK XLF SMH EWT XLY XLE XLV XLP XLU TLT LQD GLD GDX UUP USO UNG

3/17/2017

0 Comments

 
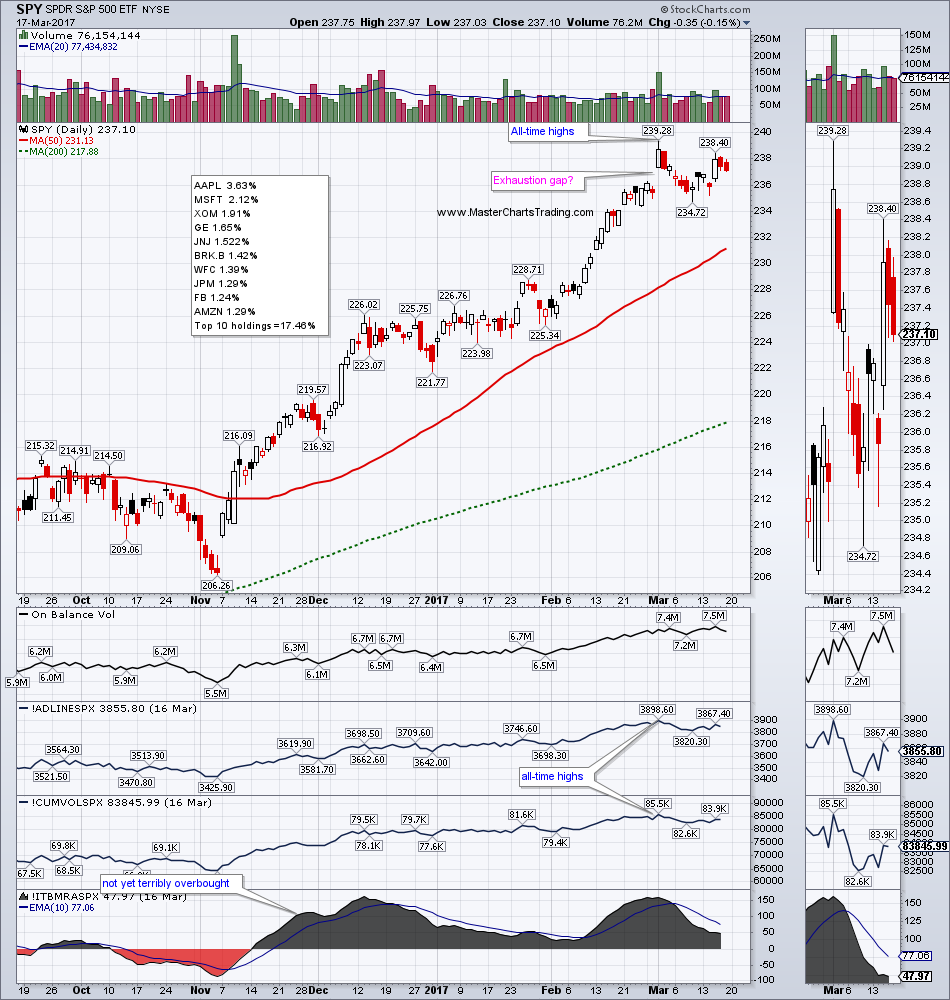
S&P 500 (SPY), Small-Caps (IWM) & Dow Jones Industrial Average (DIA) trade near all-time highs | NASDAQ-100 (QQQ), Technology (XLK), Semiconductors (SMH) are helped by Taiwan Semiconductor (TSM) | Taiwan ETF (EW) hits all-time highs | Consumer Discretionary (XLY) also at fresh all-time highs, but breadth lags somewhat | Financials (XLF) weaken as bonds bounce | Consumer Staples (XLP) and Health Care (XLV) at all-time highs as defensive posture becomes more apparent | Real Estate (IYR) and Utilities (XLU) also gain on the heels of a bounce in bonds
Bonds of all sorts (TLT, LQD, JNK) have a surprise bounce despite an increase in the Federal Funds Rate
Surprisingly, US Dollar also falls against most major currencies, but the long-term trend is still up
Gold and gold miners gain for the week | Short-term market breadth improves for gold miners, but long-term will likely weaken next week
Oil attempts to recover last week’s losses | Energy (XLE) has a feeble bounce
Natural gas may still retest the 2016 breakout

Many of the charts mentioned in this vide are located on our public charts page here: stockcharts.com/public/1229503
Watch this video on YouTube here: youtu.be/KsQ-3_2Ior8
Picture
Ready to trade? Sign-up Today
0 Comments


Leave a Reply.

    Picture
    Picture
    Subscribe to our mailing list!
    Picture
    Picture

    Archives

    February 2023
    January 2023
    December 2022
    November 2022
    October 2022
    September 2022
    August 2022
    July 2022
    June 2022
    May 2022
    April 2022
    March 2022
    February 2022
    January 2022
    December 2021
    November 2021
    October 2021
    September 2021
    August 2021
    July 2021
    June 2021
    May 2021
    April 2021
    March 2021
    February 2021
    January 2021
    December 2020
    November 2020
    October 2020
    September 2020
    August 2020
    July 2020
    June 2020
    May 2020
    April 2020
    March 2020
    February 2020
    January 2020
    December 2019
    November 2019
    October 2019
    September 2019
    August 2019
    July 2019
    June 2019
    May 2019
    April 2019
    March 2019
    February 2019
    January 2019
    December 2018
    November 2018
    October 2018
    September 2018
    August 2018
    July 2018
    June 2018
    May 2018
    April 2018
    March 2018
    February 2018
    January 2018
    December 2017
    November 2017
    October 2017
    September 2017
    August 2017
    July 2017
    June 2017
    May 2017
    April 2017
    March 2017
    February 2017
    January 2017
    December 2016
    November 2016
    October 2016
    September 2016
    August 2016
    July 2016
    June 2016
    May 2016
    April 2016
    March 2016
    February 2016
    January 2016
    December 2015
    November 2015
    October 2015
    September 2015
    August 2015
    July 2015
    June 2015
    May 2015
    April 2015
    March 2015
    February 2015
    January 2015
    December 2014
    November 2014
    October 2014
    September 2014
    August 2014
    June 2014
    May 2014
    April 2014
    March 2014
    February 2014
    January 2014

    RSS Feed

  All information on MasterChartsTrading.com is for educational and entertainment purposes only, and should not be construed as a recommendation to buy, sell or sell-short said securities. Read full disclaimer.