Master Charts Trading - Stock Market Indicators & Trade Alerts
Connect To Us!
  • MasterChartsTrading
  • Blog
  • Sign-Up
  • Members
    • Elite Trading Blog
    • Stock Speculator Blog
    • Training Library >
      • Basics of Trading
      • Risk & Trading Psych
      • Trend Identification
  • Help
    • Hall of Fame
    • Social
    • About Us
    • Contact
    • FAQs
    • Disclaimer
    • Refund Policy
    • Privacy Policy
    • What We Trade
    • Newsletter samples

Markets are Resting Following Large Gains

3/6/2014

0 Comments


Wednesday, March 5, 2014

Markets are Resting Following Large Gains.


 Candlestick patterns for S&P 500, the Dow, and the Russell 2000 Small Cap indices are starting to look like bull flags. Should such bull flags materialize a move to above 1900 for S&P 500 and above 16588 for the Dow are likely. This would put the Dow Jones Industrial Average in the all-time high universe. NASDAQ just kept plowing higher - reaffirming its underlying strength and the appetite for risk.


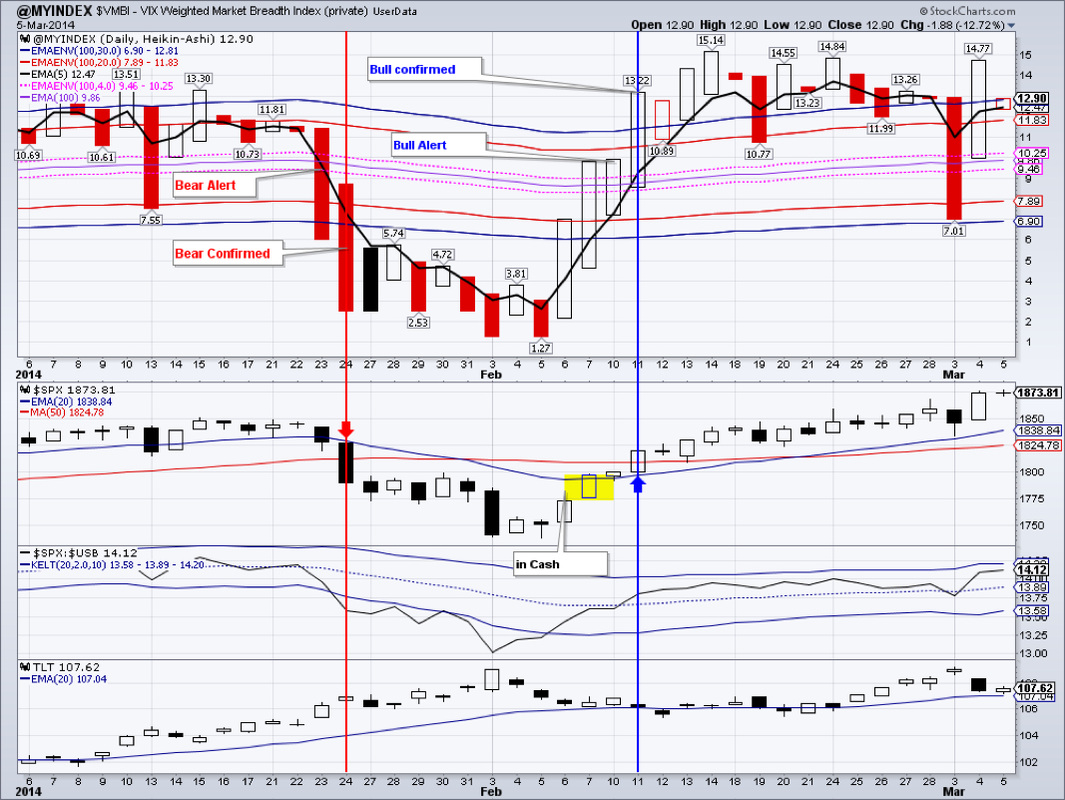
 VIX Weighted Market Breadth Index, $VMBI, is confirming this rally with a highly bullish reading. We see no signs of selling pressure yet. Should such signs appear, we will take appropriate actions.


 TLT rebounded slightly from yesterday’s large loss. We are slightly bullish on TLT right now especially with an employment report due out this Friday. Any miss on it could send TLT vaulting over and closing above $109.18. This would be bullish for treasuries and bearish for stocks.


 Gold closed marginally higher at $1336.80. Gold is neutral to slightly bullish. A close below its 20 day exponential moving average (eMA), currently at $1313.96, could cause a sell-off to around $1280-1266 area. While a close above $1361.80 should continue this rally.


 GDX volume patterns and Price Momentum Oscillator readings have deteriorated somewhat over the past 4 days. Depending on the Friday close, we may book some profits, but continue to hold GDX and will add to positions should the rally resume.


 Real Estate is showing no signs of slowing down. The only concern was today’s candlestick - a Hanging Man. Hanging Man is identical to a hammer except the Hanging Man occurs at the top of the range - as is the case with IYR right now. Should we get a confirmation within a few days, we will reduce our IYR position.


 Oil experienced a nasty decline closing below the 20 day eMA. The oscillators have rolled over and volume patterns have deteriorated. This decline is likely to continue to at least $99.99, but probably even lower to below $98. A retest of January low may be in the cards.


 Natural Gas is in a real danger of plunging even more, to below $3.75, unless a strong rebound takes place very soon.


We are long: GDX, IYR, TLT, DVY, ETV

Picture
Ready to trade? Sign-up Today
0 Comments


Leave a Reply.

    Picture
    Picture
    Subscribe to our mailing list!
    Picture
    Picture

    Archives

    February 2023
    January 2023
    December 2022
    November 2022
    October 2022
    September 2022
    August 2022
    July 2022
    June 2022
    May 2022
    April 2022
    March 2022
    February 2022
    January 2022
    December 2021
    November 2021
    October 2021
    September 2021
    August 2021
    July 2021
    June 2021
    May 2021
    April 2021
    March 2021
    February 2021
    January 2021
    December 2020
    November 2020
    October 2020
    September 2020
    August 2020
    July 2020
    June 2020
    May 2020
    April 2020
    March 2020
    February 2020
    January 2020
    December 2019
    November 2019
    October 2019
    September 2019
    August 2019
    July 2019
    June 2019
    May 2019
    April 2019
    March 2019
    February 2019
    January 2019
    December 2018
    November 2018
    October 2018
    September 2018
    August 2018
    July 2018
    June 2018
    May 2018
    April 2018
    March 2018
    February 2018
    January 2018
    December 2017
    November 2017
    October 2017
    September 2017
    August 2017
    July 2017
    June 2017
    May 2017
    April 2017
    March 2017
    February 2017
    January 2017
    December 2016
    November 2016
    October 2016
    September 2016
    August 2016
    July 2016
    June 2016
    May 2016
    April 2016
    March 2016
    February 2016
    January 2016
    December 2015
    November 2015
    October 2015
    September 2015
    August 2015
    July 2015
    June 2015
    May 2015
    April 2015
    March 2015
    February 2015
    January 2015
    December 2014
    November 2014
    October 2014
    September 2014
    August 2014
    June 2014
    May 2014
    April 2014
    March 2014
    February 2014
    January 2014

    RSS Feed

  All information on MasterChartsTrading.com is for educational and entertainment purposes only, and should not be construed as a recommendation to buy, sell or sell-short said securities. Read full disclaimer.