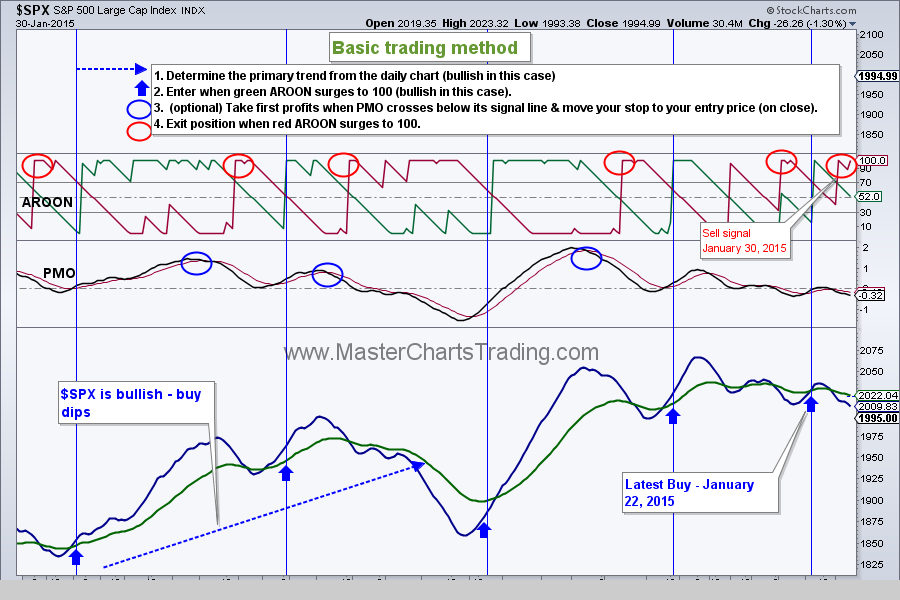
| | Friday, January 30, 2015 Weekly Market Recap. Year 2015 so far could be characterized as a year of a very choppy action. TheS&P 500 fluctuated within a tight 4% trading range for the entire January. Finally today, we got our sell signal in $SPY, but I think it may actually be a short to an intermediate term short signal and we opened a short by purchasing an inverse ETF called $SDS. Continue reading below and watch video here: http://youtu.be/2NRSjJjKxkQ |
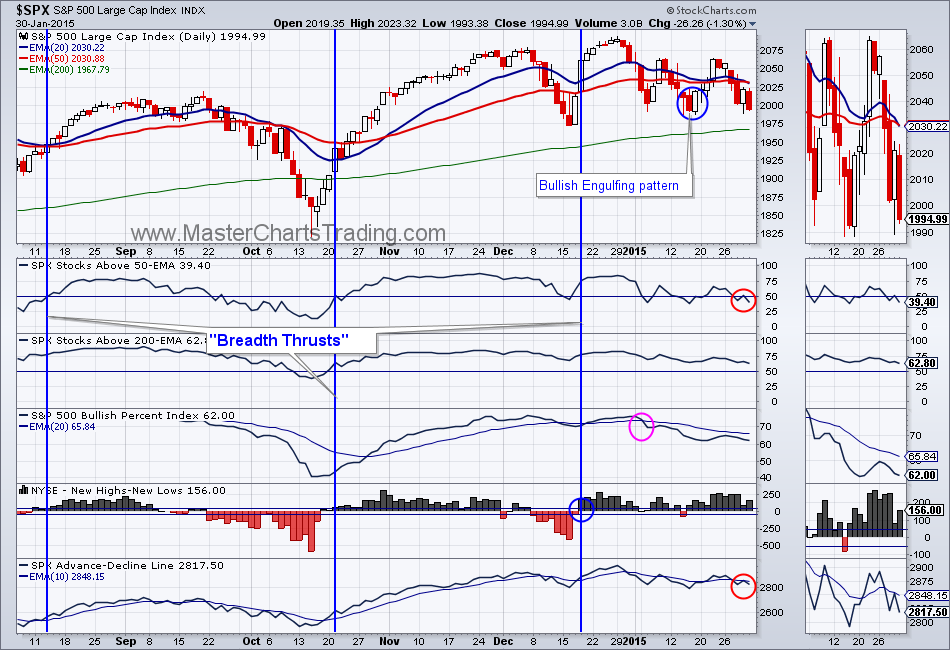
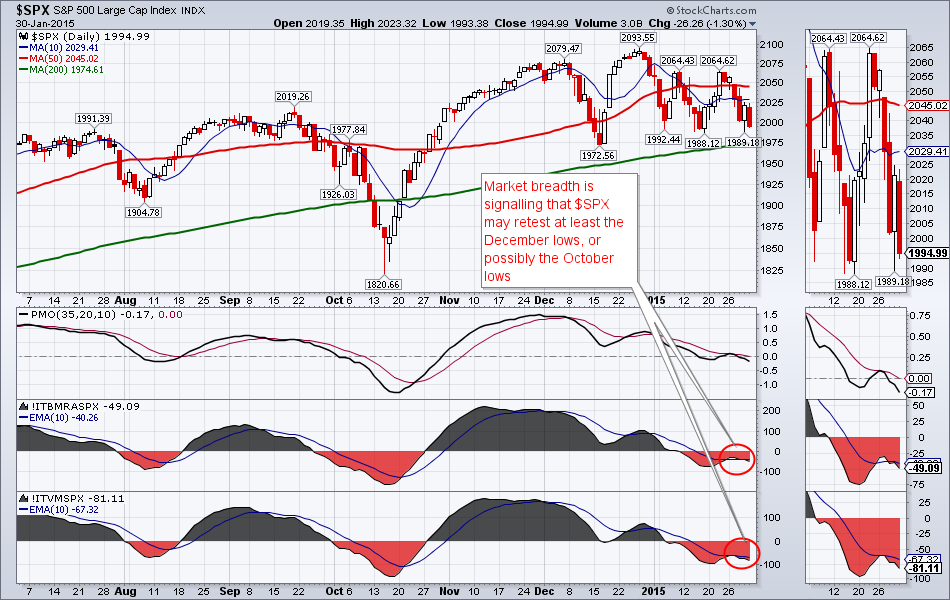
Market breadth deterioration is the reason I think that this may be a decent stab at the short side. Many market breadth indicators such as: the number of stocks above the 50 day exponential moving average, the bullish percent index, the Advance-Decline line, the Intermediate Term Breadth Momentum Oscillators - are weakening. Chart here: http://stockcharts.com/public/1229503/chartbook/377998809; and here: http://stockcharts.com/public/1229503/chartbook/379968860
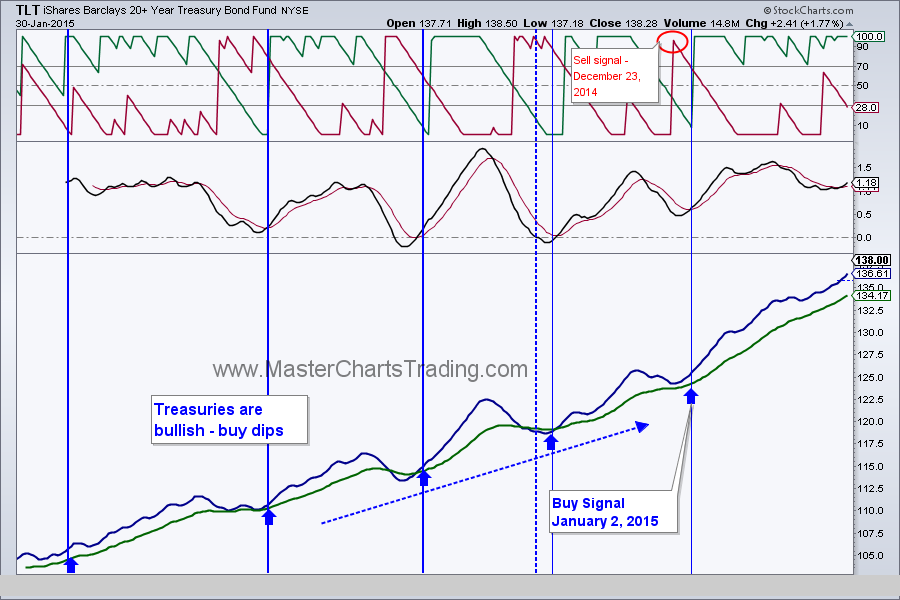
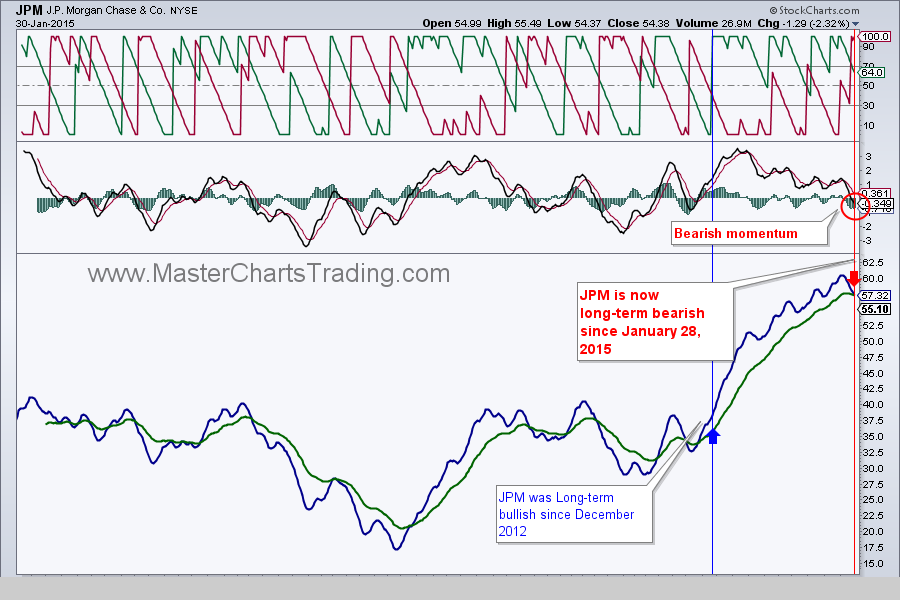
Bonds are hitting all-time highs yet again this week as more and more scared money is rotating into safety assets. This rotation is weighing on the stock market and banks in particular.JP Morgan Chase just turned bearish, for example.
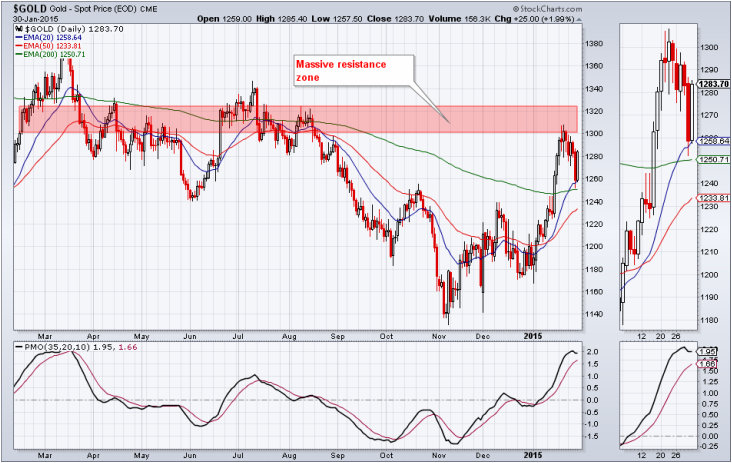
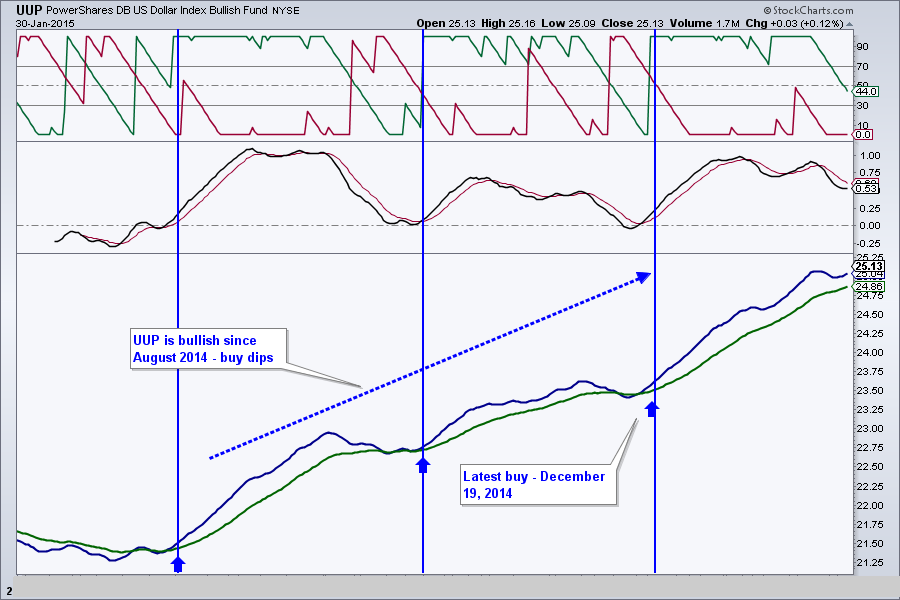
Gold is at a moment of truth as it ran into resistance around $1300. There is lots and lots of overhead resistance here. Gold Is priced in the US dollars. Dollar has been on a tear recently and this is acting as a headwind for gold and gold equities. Also, gold is still in a long-term downtrend, so I am treating this rebound that started in early January as a bear market rally until proven otherwise. A strong US dollar is not helping gold.
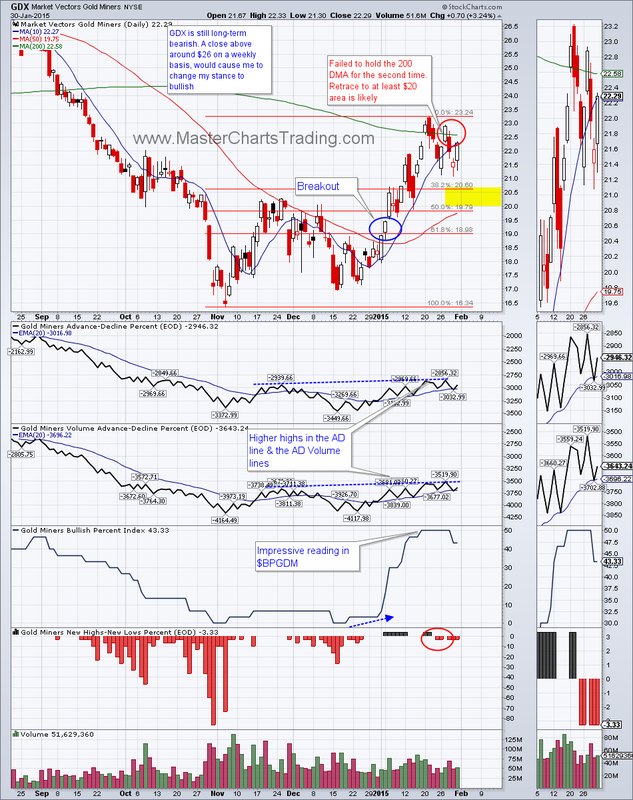
GDX so far failed to close above the 200 day simple moving average for two days in a row on two separate occasions. If gold rolls over here, gold miners will surely follow. Live chart here http://stockcharts.com/public/1229503/chartbook/383443158;
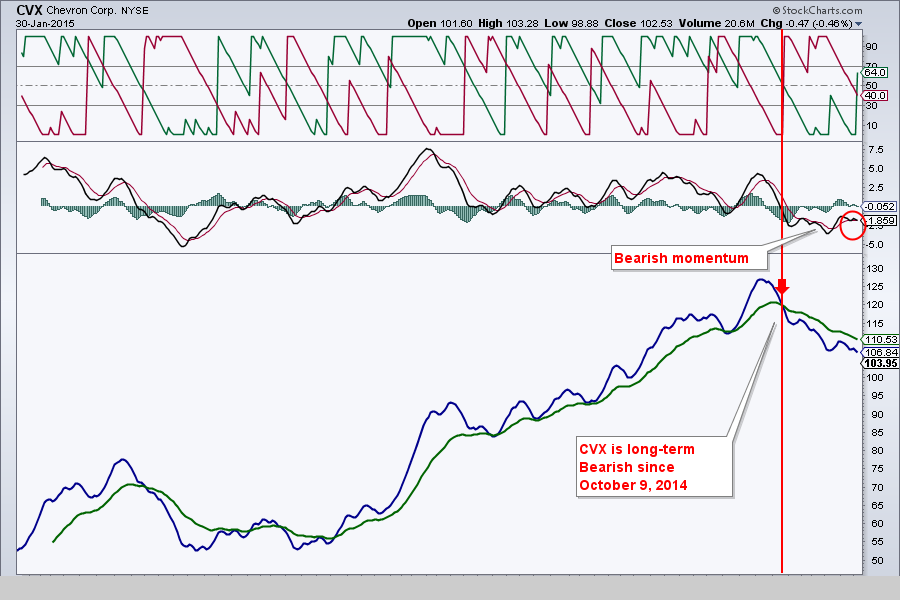
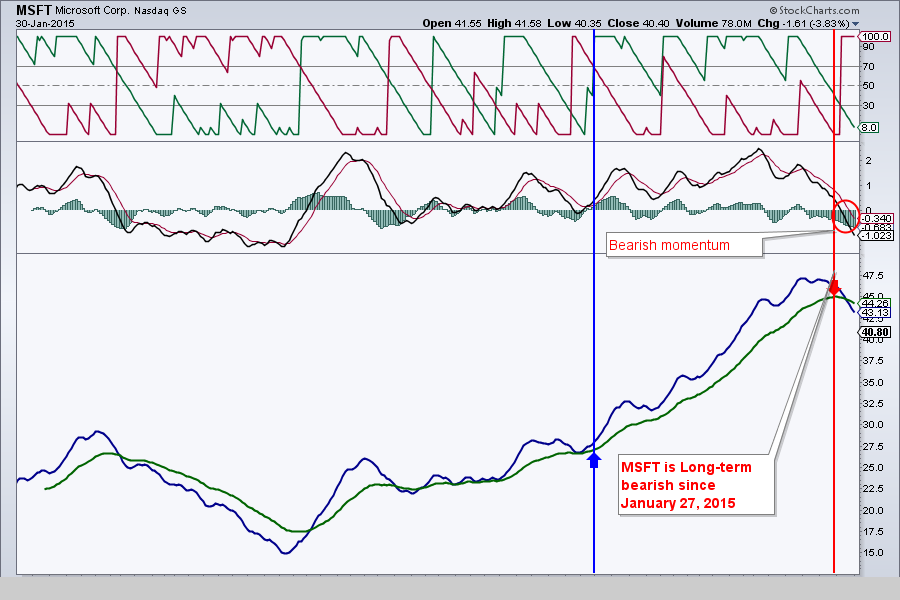
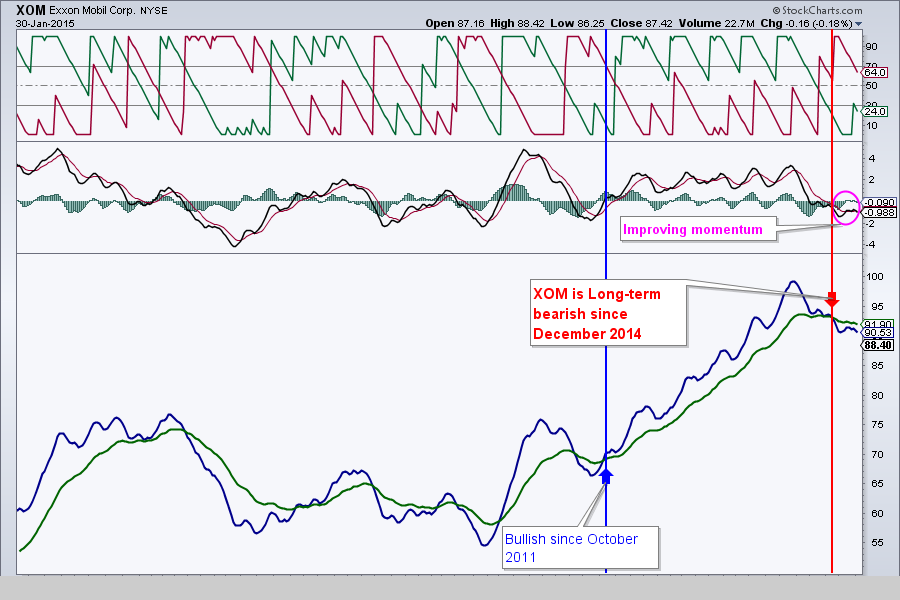
Out of the top 10 stocks by market capitalization, 5 have rolled over and entered the bear market. That is a significant number. The stocks that I think are bearish to varying degrees are: Exxon Mobil, JP Morgan Chase, Microsoft, General Electric, and Chevron. Charts are here http://stockcharts.com/public/1229503/tenpp/5

That’s it for this week’s recap,
Best Regards and have another great trading week!
Alexander Berger (www.MasterChartsTrading.com)
Disclaimer, we have:
Open positions: TLT, GLD, GDX
New position: SDS
Closed position: SPY
Best Regards and have another great trading week!
Alexander Berger (www.MasterChartsTrading.com)
Disclaimer, we have:
Open positions: TLT, GLD, GDX
New position: SDS
Closed position: SPY


 RSS Feed