Tuesday, February 18, 2014
Indices mostly continued higher with NASDAQ making new highs and IWM playing catch-up.
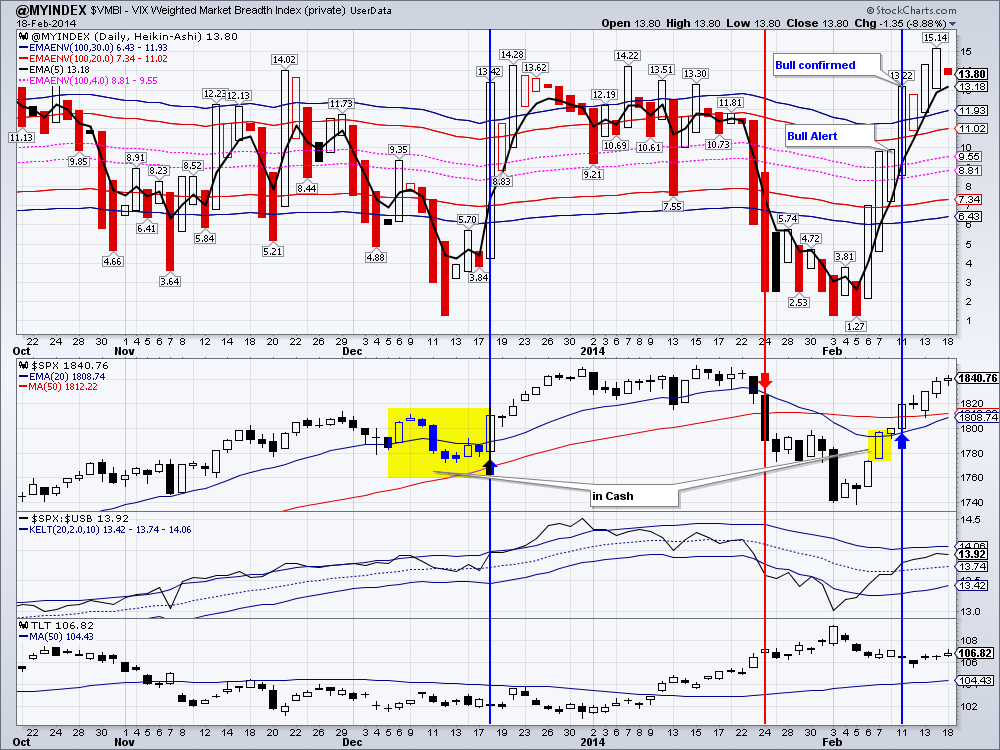
Our market breadth index, the $VMBI is showing continued bull momentum on the daily and weekly charts.
TLT held its ground at support last week and it appears that the short term direction for TLT is at least not down. We may see some sideways consolidation here, or possibly a rally to the 109 area. This would be bearish for the stock market.
IYR is pushing higher. It is in a very steep uptrend. Could it be because it is sensing lower interest rates ahead, i.e.: a TLT rally?
Last week GDX gapped up and is holding this gap. It is coming up on resistance in the $27 area.
$GOLD may be hitting overhead resistance in the $1330 area. But we think the real test of this rally in gold would come in the $1361 area, where a major failure occurred in the late October.
$WTIC (USO) appears to be breaking out to the upside on decent volume.
Last week we went long emerging markets (EEM). This trade is already profitable, but lots and lots of overhead resistance is just ahead in the $40 area.
We are long: GDX, IYR, DVY, DEM
Indices mostly continued higher with NASDAQ making new highs and IWM playing catch-up.
Our market breadth index, the $VMBI is showing continued bull momentum on the daily and weekly charts.
TLT held its ground at support last week and it appears that the short term direction for TLT is at least not down. We may see some sideways consolidation here, or possibly a rally to the 109 area. This would be bearish for the stock market.
IYR is pushing higher. It is in a very steep uptrend. Could it be because it is sensing lower interest rates ahead, i.e.: a TLT rally?
Last week GDX gapped up and is holding this gap. It is coming up on resistance in the $27 area.
$GOLD may be hitting overhead resistance in the $1330 area. But we think the real test of this rally in gold would come in the $1361 area, where a major failure occurred in the late October.
$WTIC (USO) appears to be breaking out to the upside on decent volume.
Last week we went long emerging markets (EEM). This trade is already profitable, but lots and lots of overhead resistance is just ahead in the $40 area.
We are long: GDX, IYR, DVY, DEM


 RSS Feed