Master Charts Trading - Stock Market Indicators & Trade Alerts
Connect To Us!
  • MasterChartsTrading
  • Blog
  • Sign-Up
  • Members
    • Elite Trading Blog
    • Stock Speculator Blog
    • Training Library >
      • Basics of Trading
      • Risk & Trading Psych
      • Trend Identification
  • Help
    • Hall of Fame
    • Social
    • About Us
    • Contact
    • FAQs
    • Disclaimer
    • Refund Policy
    • Privacy Policy
    • What We Trade
    • Newsletter samples

Questions On Oil $WTIC $USO

2/10/2015

0 Comments


A reader asked the following question:

"(2) on USO, you issued buy signal. in video you mentioned 'bear trap' and 'be careful' because of 'downtrend but short rally'. then in your 02/07 blog post, you wrote the title 'Oil rebound may take it to around $70 $WTIC'. can i jump in to buy now or wait for your buy signal on uptrend long term? "

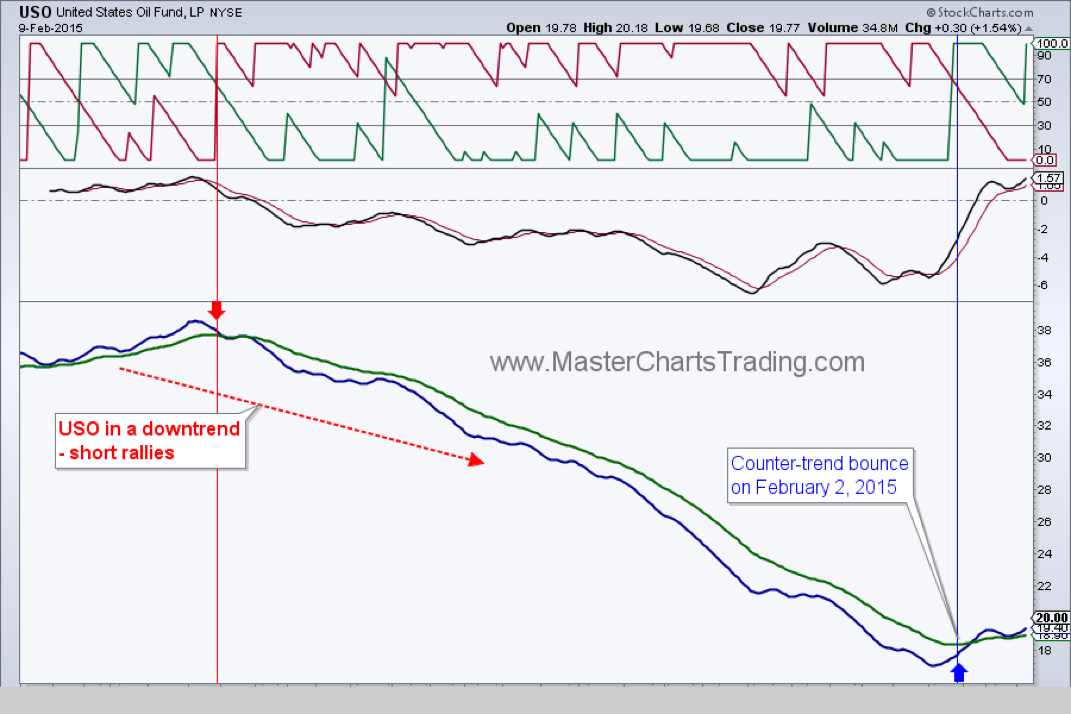
Stocks in motion tend to stay in motion. An up-trending security could always get more expensive and a down-ternding one, could always get cheaper.
Right now there is decent support for oil in the $44-46 area, but there is no denying oil is in a downtrend that started in August of 2014.

Longer-term (weeks to month) oil is in a bear market, that means it is *usually* more profitable to short rallies.
So if oil rolls over here, it could retest the $44-46 area and possibly break down below it.
 USO is already in an overbought territory. If a sell signal is generated
on this chart, it would make more sense for me to short at that point, rather then picking a bottom and hoping for a sizable rally (which could also happen as I mentioned in my blog post about $WTIC. http://www.masterchartstrading.com/blog/oil-rebound-may-take-it-to-around-70-wtic ).

Picture
Ready to trade? Sign-up Today
0 Comments


Leave a Reply.

    Picture
    Picture
    Subscribe to our mailing list!
    Picture
    Picture

    Archives

    February 2023
    January 2023
    December 2022
    November 2022
    October 2022
    September 2022
    August 2022
    July 2022
    June 2022
    May 2022
    April 2022
    March 2022
    February 2022
    January 2022
    December 2021
    November 2021
    October 2021
    September 2021
    August 2021
    July 2021
    June 2021
    May 2021
    April 2021
    March 2021
    February 2021
    January 2021
    December 2020
    November 2020
    October 2020
    September 2020
    August 2020
    July 2020
    June 2020
    May 2020
    April 2020
    March 2020
    February 2020
    January 2020
    December 2019
    November 2019
    October 2019
    September 2019
    August 2019
    July 2019
    June 2019
    May 2019
    April 2019
    March 2019
    February 2019
    January 2019
    December 2018
    November 2018
    October 2018
    September 2018
    August 2018
    July 2018
    June 2018
    May 2018
    April 2018
    March 2018
    February 2018
    January 2018
    December 2017
    November 2017
    October 2017
    September 2017
    August 2017
    July 2017
    June 2017
    May 2017
    April 2017
    March 2017
    February 2017
    January 2017
    December 2016
    November 2016
    October 2016
    September 2016
    August 2016
    July 2016
    June 2016
    May 2016
    April 2016
    March 2016
    February 2016
    January 2016
    December 2015
    November 2015
    October 2015
    September 2015
    August 2015
    July 2015
    June 2015
    May 2015
    April 2015
    March 2015
    February 2015
    January 2015
    December 2014
    November 2014
    October 2014
    September 2014
    August 2014
    June 2014
    May 2014
    April 2014
    March 2014
    February 2014
    January 2014

    RSS Feed

  All information on MasterChartsTrading.com is for educational and entertainment purposes only, and should not be construed as a recommendation to buy, sell or sell-short said securities. Read full disclaimer.