Master Charts Trading - Stock Market Indicators & Trade Alerts
Connect To Us!
  • MasterChartsTrading
  • Blog
  • Sign-Up
  • Members
    • Elite Trading Blog
    • Stock Speculator Blog
    • Training Library >
      • Basics of Trading
      • Risk & Trading Psych
      • Trend Identification
  • Help
    • Hall of Fame
    • Social
    • About Us
    • Contact
    • FAQs
    • Disclaimer
    • Refund Policy
    • Privacy Policy
    • What We Trade
    • Newsletter samples

Retest of Highs?

4/1/2014

0 Comments


Monday, March 31 2014
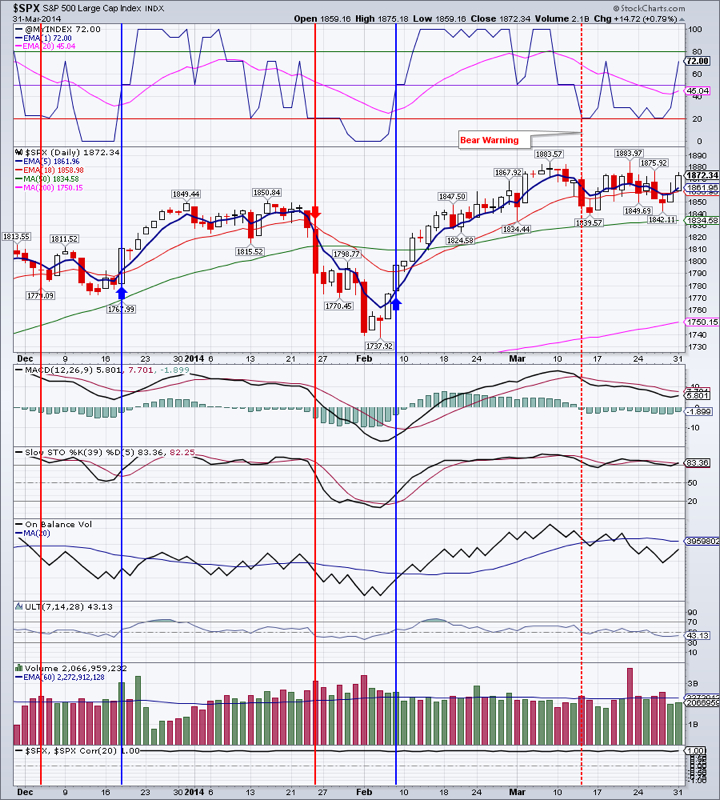
Retest of Highs?

  Indices had a very good day, gaining on average about a percent, while small-caps lead with a surge of 1.79%. Volume was below average, though. The OBV (On Balance Volume) indicator is still sloping down and below its 20 DMA, so at least one more day to the upside on good volume is needed to confirm upside market momentum.

  Market Breadth Index, the $VMBI, has improved significantly. This indicates broad participation in this rebound that started 3 days ago. We are almost ready to remove Bear Warning.

  TLT lost a quarter of a percent, but printed what appears to be a Shooting star. Coupled with a fact that TLT is overbought, a retest of the up-sloping 50 day moving average, currently at $107.20, is likely.

  EEM continued the strong rally for the 8th day straight! No market goes straight up, so a throwback is just around the corner. Strong resistance is at $41.85, while good support now exists at $39.07. We will wait for the throwback to add to our open position

  Gold should soon find support…or completely collapse to the $1180 area. A failure in the $1260 area, would be very bearish.

  GDX may have already found support.

  IYR is holding up well and is consolidating between $65.89-68.07. A close above $68.54 would continue this rally.

  Natural gas seems to be making lower highs and lower lows. A close below $4.262 should cause further selling down to around $4

  Oil may have run into resistance at $102.20. It needs to push higher and close above $102.91 to prove this rally, otherwise if it rolls over, a retest of January low is likely.

  Bottom line: Markets seem to have worked through the weakness and are preparing for a push higher.

  Open positions: GDX, IYR, TLT, DVY, ETV, EEM

  Hedging positions: SDOW, DGAZ

Picture
Ready to trade? Sign-up Today
0 Comments


Leave a Reply.

    Picture
    Picture
    Subscribe to our mailing list!
    Picture
    Picture

    Archives

    June 2023
    May 2023
    April 2023
    March 2023
    February 2023
    January 2023
    December 2022
    November 2022
    October 2022
    September 2022
    August 2022
    July 2022
    June 2022
    May 2022
    April 2022
    March 2022
    February 2022
    January 2022
    December 2021
    November 2021
    October 2021
    September 2021
    August 2021
    July 2021
    June 2021
    May 2021
    April 2021
    March 2021
    February 2021
    January 2021
    December 2020
    November 2020
    October 2020
    September 2020
    August 2020
    July 2020
    June 2020
    May 2020
    April 2020
    March 2020
    February 2020
    January 2020
    December 2019
    November 2019
    October 2019
    September 2019
    August 2019
    July 2019
    June 2019
    May 2019
    April 2019
    March 2019
    February 2019
    January 2019
    December 2018
    November 2018
    October 2018
    September 2018
    August 2018
    July 2018
    June 2018
    May 2018
    April 2018
    March 2018
    February 2018
    January 2018
    December 2017
    November 2017
    October 2017
    September 2017
    August 2017
    July 2017
    June 2017
    May 2017
    April 2017
    March 2017
    February 2017
    January 2017
    December 2016
    November 2016
    October 2016
    September 2016
    August 2016
    July 2016
    June 2016
    May 2016
    April 2016
    March 2016
    February 2016
    January 2016
    December 2015
    November 2015
    October 2015
    September 2015
    August 2015
    July 2015
    June 2015
    May 2015
    April 2015
    March 2015
    February 2015
    January 2015
    December 2014
    November 2014
    October 2014
    September 2014
    August 2014
    June 2014
    May 2014
    April 2014
    March 2014
    February 2014
    January 2014

    RSS Feed

  All information on MasterChartsTrading.com is for educational and entertainment purposes only, and should not be construed as a recommendation to buy, sell or sell-short said securities. Read full disclaimer.