Master Charts Trading - Stock Market Indicators & Trade Alerts
Connect To Us!
  • MasterChartsTrading
  • Products
  • Blog
  • Members
    • Elite Trading Blog
    • Stock Speculator Blog
    • Training Library >
      • Basics of Trading
      • Risk & Trading Psych
      • Trend Identification
  • Help
    • Hall of Fame
    • Social
    • About Us
    • Contact
    • FAQs
    • Disclaimer
    • Refund Policy
    • Privacy Policy
    • What We Trade
    • Scanner Sign-up
  • Affiliates

Selling Pressure and a Shift to Safety

3/12/2014

0 Comments


Tuesday, March 11, 2014


Selling Pressure and Shift to Safety.


We are possibly witnessing some selling pressure beginning to manifest in the markets. Today all indices lost ground. Small caps lead the way with over 1% decline on above average volume. Could this be the beginning of a bearish period?


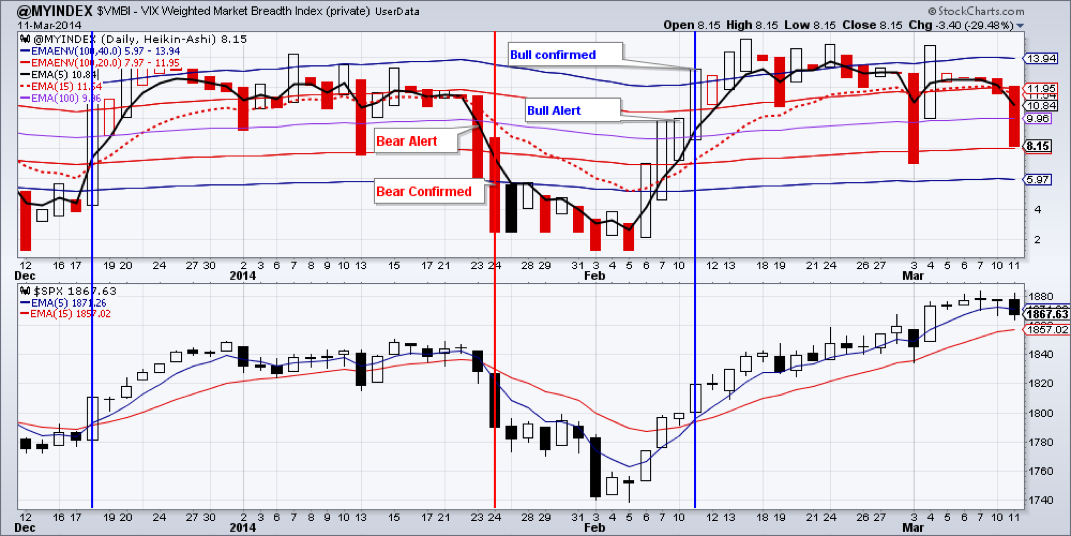
Our Market Breadth Index ($VMBI) is showing definite signs of increased selling, albeit still not enough to issue a bear alert, much less a confirmation of a shift in market direction. We could still see a turnaround and more new highs.


Telling was the behavior of treasuries and gold today - both gained. This indicates an increase of fear in the markets.


TLT is attempting to close the gap formed by last Friday’s drop. It still has some work cut-out for it.


Gold, it seems, is getting ready to take out resistance by closing above $1355. Should gold do so, GDX will follow suit and take out overhead resistance at $26.95. We would add to our open position in GDX upon close above $26.95, since we would not be surprised to see another 20+ percent up move in GDX.


IYR may have stopped falling. A close above $69.33 would extend this rally and a push to $74 may be in the cards.


Oil fell to below $100 on above average volume. We are bearish oil now. A re-test of January low at $91.24 is likely.


Emerging markets may have indeed rolled over to the downside again. We will wait until Friday close to make a decision of continuing to hold or paring our holdings in EEM.


We are long: GDX, IYR, TLT, EEM, DVY, ETV

Picture
Ready to trade? Sign-up Today
0 Comments


Leave a Reply.

    Picture
    Picture
    Subscribe to our mailing list!
    Picture
    Picture

    Archives

    February 2021
    January 2021
    December 2020
    November 2020
    October 2020
    September 2020
    August 2020
    July 2020
    June 2020
    May 2020
    April 2020
    March 2020
    February 2020
    January 2020
    December 2019
    November 2019
    October 2019
    September 2019
    August 2019
    July 2019
    June 2019
    May 2019
    April 2019
    March 2019
    February 2019
    January 2019
    December 2018
    November 2018
    October 2018
    September 2018
    August 2018
    July 2018
    June 2018
    May 2018
    April 2018
    March 2018
    February 2018
    January 2018
    December 2017
    November 2017
    October 2017
    September 2017
    August 2017
    July 2017
    June 2017
    May 2017
    April 2017
    March 2017
    February 2017
    January 2017
    December 2016
    November 2016
    October 2016
    September 2016
    August 2016
    July 2016
    June 2016
    May 2016
    April 2016
    March 2016
    February 2016
    January 2016
    December 2015
    November 2015
    October 2015
    September 2015
    August 2015
    July 2015
    June 2015
    May 2015
    April 2015
    March 2015
    February 2015
    January 2015
    December 2014
    November 2014
    October 2014
    September 2014
    August 2014
    June 2014
    May 2014
    April 2014
    March 2014
    February 2014
    January 2014

    RSS Feed

  All information on MasterChartsTrading.com is for educational and entertainment purposes only, and should not be construed as a recommendation to buy, sell or sell-short said securities. Read full disclaimer.