Monday, March 10, 2014
Signs of Selling Pressure?
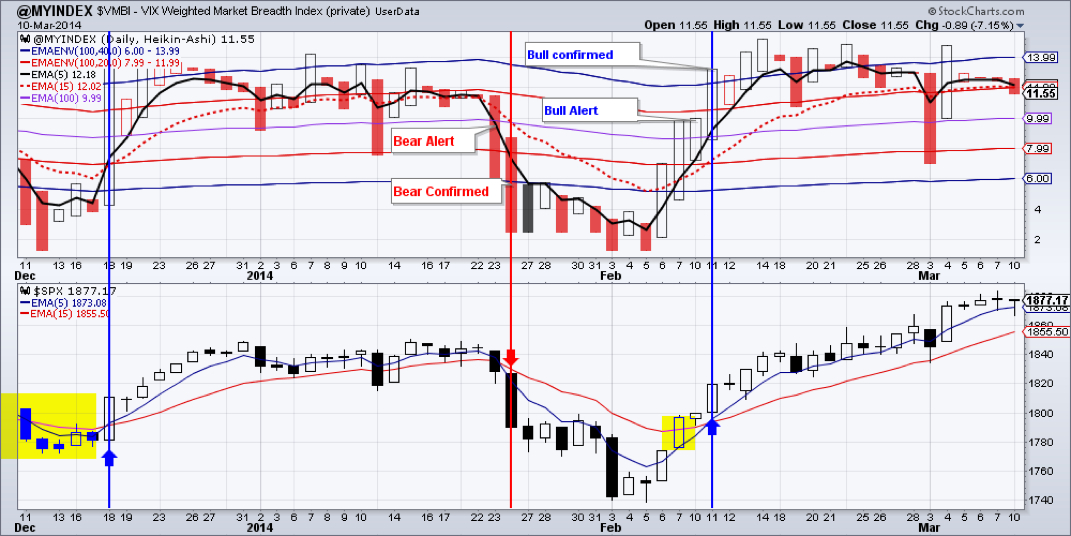
Indices sold off in am, but recovered most of the losses by the evening - on rather light volume. Market Breadth Index, the $VMBI, is showing a very slight pickup in selling pressure. It is not yet enough to issue a bear alert. We can still easily move to above 1900 for the S&P 500.
Emerging markets continued to underperform. EEM is again in danger of rolling over should there be a close below $38.49. We maintain a slightly bullish bias on EEM.
Treasuries held support so far at $105.60 despite last week’s selloff. On Balance volume is still positive and rising. Should TLT close below $105.36, a re-test of December low is very much possible. Alternatively, a close above $109.18 may trigger a run-up of around 8%
Gold and the miners may be finding support. Should gold close below February 28 low of $1319, a drop to the $1279-1237 area is likely. Conversely, a close above $1355 – and another 8-15% gain is not impossible.
Real Estate is one of the few sectors where selling pressure is evident; it lost over 2.5 percent since March 5. Should the Friday close be below $67.74, then a shooting star from last week’s weekly chart would be confirmed and we may see prices in the $65 area.
Oil is chopping sideways with no clear direction. We maintain a slightly bearish bias since March 5.
Natural gas seems to be unable to close above $4.736 – which is what it would take to reverse at least the short-term downtrend. Another 30% drop is still in the cards.
We are long: GDX, IYR, TLT, EEM, DVY, ETV
Monday, March 10, 2014
Signs of Selling Pressure?
Indices sold off in am, but recovered most of the losses by the evening - on rather light volume. Market Breadth Index, the $VMBI, is showing a very slight pickup in selling pressure. It is not yet enough to issue a bear alert. We can still easily move to above 1900 for the S&P 500.
Emerging markets continued to underperform. EEM is again in danger of rolling over should there be a close below $38.49. We maintain a slightly bullish bias on EEM.
Treasuries held support so far at $105.60 despite last week’s selloff. On Balance volume is still positive and rising. Should TLT close below $105.36, a re-test of December low is very much possible. Alternatively, a close above $109.18 may trigger a run-up of around 8%
Gold and the miners may be finding support. Should gold close below February 28 low of $1319, a drop to the $1279-1237 area is likely. Conversely, a close above $1355 – and another 8-15% gain is not impossible.
Real Estate is one of the few sectors where selling pressure is evident; it lost over 2.5 percent since March 5. Should the Friday close be below $67.74, then a shooting star from last week’s weekly chart would be confirmed and we may see prices in the $65 area.
Oil is chopping sideways with no clear direction. We maintain a slightly bearish bias since March 5.
Natural gas seems to be unable to close above $4.736 – which is what it would take to reverse at least the short-term downtrend. Another 30% drop is still in the cards.
We are long: GDX, IYR, TLT, EEM, DVY, ETV


 RSS Feed