Friday, April 24, 2014 (Weekly Commentary)
S&P 500 Looks OK
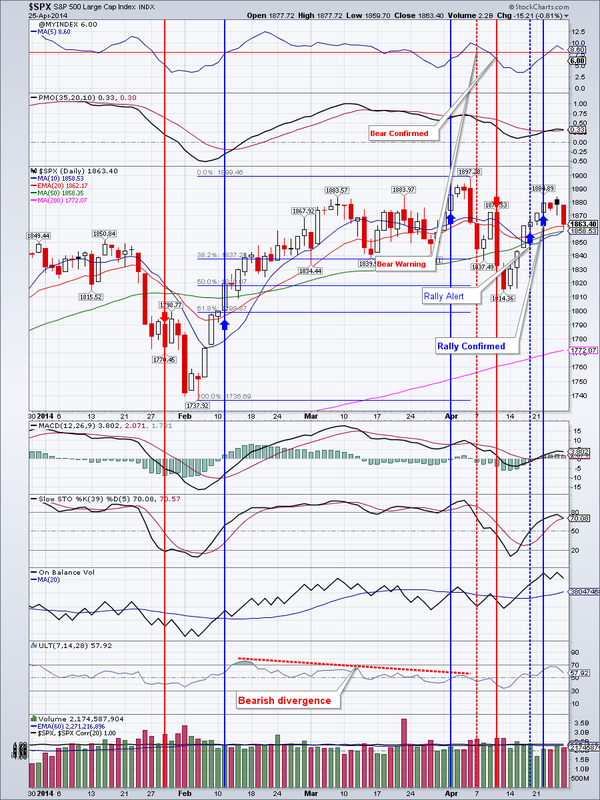
After an over 2.5% rally from the week before, the last week brought us more weakness in the markets. Especially the Russell 2000 small caps lost 1.31% and the NASDAQ lost a little less than 1/2%. $SPX fared much better and basically closed flat for the week.
Market breadth is contracting again, but we may still get a rally in $SPX that would take it to new highs.
$SPX now has strong support in the 1815 area and resistance at 1883
QQQ resistance at $88.21 and very good support around $83.50.
IWM resistance at $115.02 and support in the $107-109 area
TLT gained over 1% for the week but is very overbought and the bearish divergence in its ultimate oscillator continues. Dividend payout is just around the corner on the 1st. The payout usually resulted in several days of weakness in the past.
EEM had a bad week and lost almost 3%. We may still see lower prices ahead. It should hold support in the $39-40 area. If not, next support is around $38. If that doesn't hold then the breakout from late March would be negated.
IYR broke above early March highs, albeit on low volume. First support is at $68.40
Gold reaffirmed support at $1268 with a hammer candlestick on both the daily and the weekly charts. Next resistance is $1320.
GDX had a great week and gained almost 4%. We have re-opened a small position in NUGT. Next resistance for GDX is at $25.27
Oil had a bad week loosing almost 4% on strong volume. On the daily chart oil closed below the 200 Day moving average for a second day in a row-not a good sign. Next support is at $98.86
Natural gas is still tracing out a bull hammer on the daily charts. If it fails at $4.48, then the breakout from April 17 would be negated.
Open positions: TLT, IYR, DIA, QQQ, TNA, NUGT, UGAZ
Bottom line: Markets look precarious, but should they work through this weakness, we may see new highs in $SPX soon
S&P 500 Looks OK
After an over 2.5% rally from the week before, the last week brought us more weakness in the markets. Especially the Russell 2000 small caps lost 1.31% and the NASDAQ lost a little less than 1/2%. $SPX fared much better and basically closed flat for the week.
Market breadth is contracting again, but we may still get a rally in $SPX that would take it to new highs.
$SPX now has strong support in the 1815 area and resistance at 1883
QQQ resistance at $88.21 and very good support around $83.50.
IWM resistance at $115.02 and support in the $107-109 area
TLT gained over 1% for the week but is very overbought and the bearish divergence in its ultimate oscillator continues. Dividend payout is just around the corner on the 1st. The payout usually resulted in several days of weakness in the past.
EEM had a bad week and lost almost 3%. We may still see lower prices ahead. It should hold support in the $39-40 area. If not, next support is around $38. If that doesn't hold then the breakout from late March would be negated.
IYR broke above early March highs, albeit on low volume. First support is at $68.40
Gold reaffirmed support at $1268 with a hammer candlestick on both the daily and the weekly charts. Next resistance is $1320.
GDX had a great week and gained almost 4%. We have re-opened a small position in NUGT. Next resistance for GDX is at $25.27
Oil had a bad week loosing almost 4% on strong volume. On the daily chart oil closed below the 200 Day moving average for a second day in a row-not a good sign. Next support is at $98.86
Natural gas is still tracing out a bull hammer on the daily charts. If it fails at $4.48, then the breakout from April 17 would be negated.
Open positions: TLT, IYR, DIA, QQQ, TNA, NUGT, UGAZ
Bottom line: Markets look precarious, but should they work through this weakness, we may see new highs in $SPX soon


 RSS Feed