Master Charts Trading - Stock Market Indicators & Trade Alerts
Connect To Us!
  • MasterChartsTrading
  • Blog
  • Sign-Up
  • Members
    • Elite Trading Blog
    • Stock Speculator Blog
    • Training Library >
      • Basics of Trading
      • Risk & Trading Psych
      • Trend Identification
  • Help
    • Hall of Fame
    • Social
    • About Us
    • Contact
    • FAQs
    • Disclaimer
    • Refund Policy
    • Privacy Policy
    • What We Trade
    • Newsletter samples

S&P 500 Over 1900 Next?

3/5/2014

0 Comments


Tuesday, March 04, 2014

 S&P 500 over 1900 Next?

Stocks completely ignored all war fears, closed on new highs and printed bullish candlesticks. Small caps lead again with a 2.75% gain, while the Dow "languished", tacking on only 1.41%. The Dow is just over a percentage point away from making an all time high. Small Cap leadership reaffirms the strength of this rebound that started on February 5.


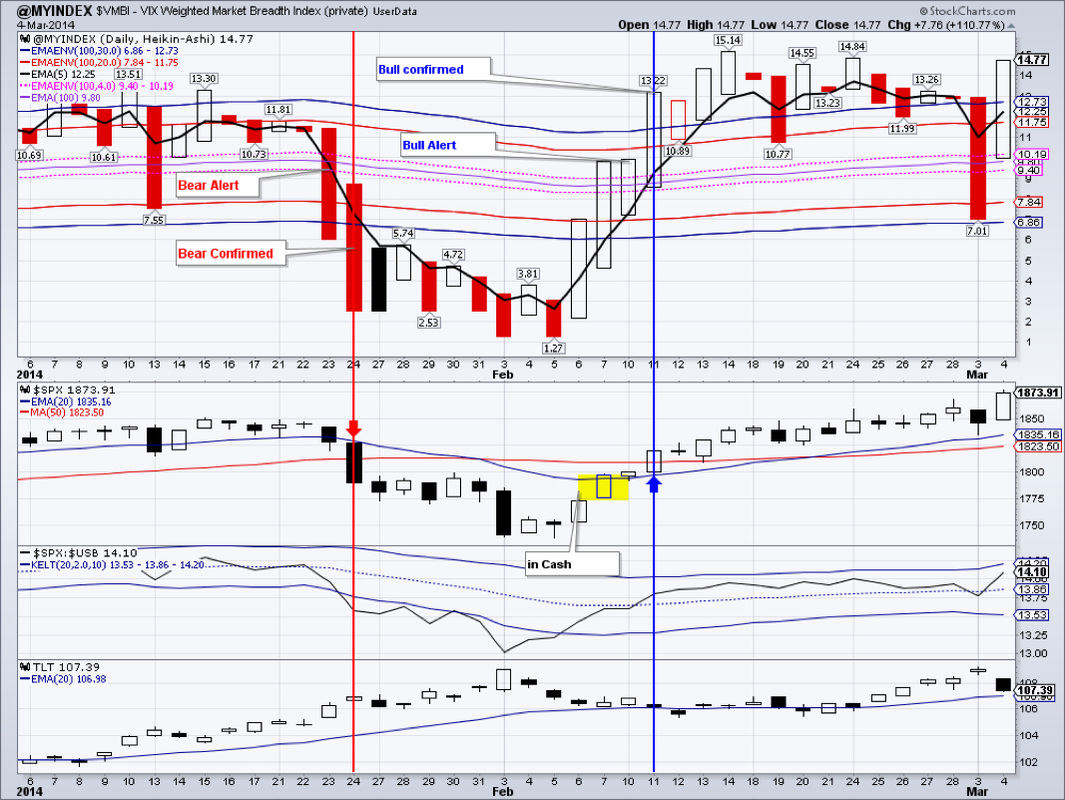
 Market breadth remains very bullish. Our proprietary market breadth index, $VMBI, rebounded into the strongly bullish territory. We see no evidence of sustained selling pressure of any sort yet. Should this evidence materialize, we will take appropriate actions such as raising cash, or buying more treasuries.


 Treasuries were the clear losers today closing down 1.50%. They gapped down and closed just off of the session lows almost printing a black marubozu. A close below the 20 day exponential moving average (eMA) would call this TLT rally into question, unless some other fears surface. Support is in the $105 area.


 As the fears subsided, so did the price of gold. It closed down 1.18% to end at $1334.40 printing an Inside day. Should the fear continue to subside, a correction to the $1300 area could be in the cards - which would be healthy for the gold market.


GDX fared better, only loosing 0.76%. It is possible that GDX is building a base. It has been trading in the $25.56-26.95 area for the past 12 sessions. Bias is still bullish.


 Emerging markets snapped back up, but on rather low volume. EEM is likely to consolidate more before a major move continues.


 IYR gapped up and continued higher. I fear that real estate is becoming overextended and ripe for a correction. First support is in the $67 area.


 Natural gas has seen some tremendous volatility lately, so forecasting its price is tricky. My best guess is a rise to the $4.90 area, followed by further drop to below $3.90.


 West Texas Intermediate oil lost 1.46% today and printed an inside day. Momentum and volume patterns are still bullish so a run to the $108-109 area is possible.


 We are long: GDX, IYR, TLT, DVY, ETV


 Please email/send feedback with any questions or comments!

Picture
Ready to trade? Sign-up Today
0 Comments


Leave a Reply.

    Picture
    Picture
    Subscribe to our mailing list!
    Picture
    Picture

    Archives

    February 2023
    January 2023
    December 2022
    November 2022
    October 2022
    September 2022
    August 2022
    July 2022
    June 2022
    May 2022
    April 2022
    March 2022
    February 2022
    January 2022
    December 2021
    November 2021
    October 2021
    September 2021
    August 2021
    July 2021
    June 2021
    May 2021
    April 2021
    March 2021
    February 2021
    January 2021
    December 2020
    November 2020
    October 2020
    September 2020
    August 2020
    July 2020
    June 2020
    May 2020
    April 2020
    March 2020
    February 2020
    January 2020
    December 2019
    November 2019
    October 2019
    September 2019
    August 2019
    July 2019
    June 2019
    May 2019
    April 2019
    March 2019
    February 2019
    January 2019
    December 2018
    November 2018
    October 2018
    September 2018
    August 2018
    July 2018
    June 2018
    May 2018
    April 2018
    March 2018
    February 2018
    January 2018
    December 2017
    November 2017
    October 2017
    September 2017
    August 2017
    July 2017
    June 2017
    May 2017
    April 2017
    March 2017
    February 2017
    January 2017
    December 2016
    November 2016
    October 2016
    September 2016
    August 2016
    July 2016
    June 2016
    May 2016
    April 2016
    March 2016
    February 2016
    January 2016
    December 2015
    November 2015
    October 2015
    September 2015
    August 2015
    July 2015
    June 2015
    May 2015
    April 2015
    March 2015
    February 2015
    January 2015
    December 2014
    November 2014
    October 2014
    September 2014
    August 2014
    June 2014
    May 2014
    April 2014
    March 2014
    February 2014
    January 2014

    RSS Feed

  All information on MasterChartsTrading.com is for educational and entertainment purposes only, and should not be construed as a recommendation to buy, sell or sell-short said securities. Read full disclaimer.