Master Charts Trading - Stock Market Indicators & Trade Alerts
Connect To Us!
  • MasterChartsTrading
  • Blog
  • Sign-Up
  • Members
    • Elite Trading Blog
    • Stock Speculator Blog
    • Training Library >
      • Basics of Trading
      • Risk & Trading Psych
      • Trend Identification
  • Help
    • Hall of Fame
    • Social
    • About Us
    • Contact
    • FAQs
    • Disclaimer
    • Refund Policy
    • Privacy Policy
    • What We Trade
    • Newsletter samples

Stock Market Recap, February 15, 2019 MasterChartsTrading.Com

2/16/2019

4 Comments

 
•Indiegogo Campaign Update

•MetaTrader 4.0 Indicators Coming Soon

•Hit the Like button and Subscribe!

•Stocks continue with breakout.

•December 2018 drop seems to have worked itself off

•Dow Jones leads the market higher

•Foreign stocks also showing signs of life

•High-yield junk debt is confirming this move higher for stocks

•Investment-grade bonds are also holding on to their gains

•Dollar index and gold both moving higher. Which one would be correct?

•How to trade Alex’s favorite chart pattern? GDX example

•Trading oil using retail ETFs

•Natural gas puts in a new low
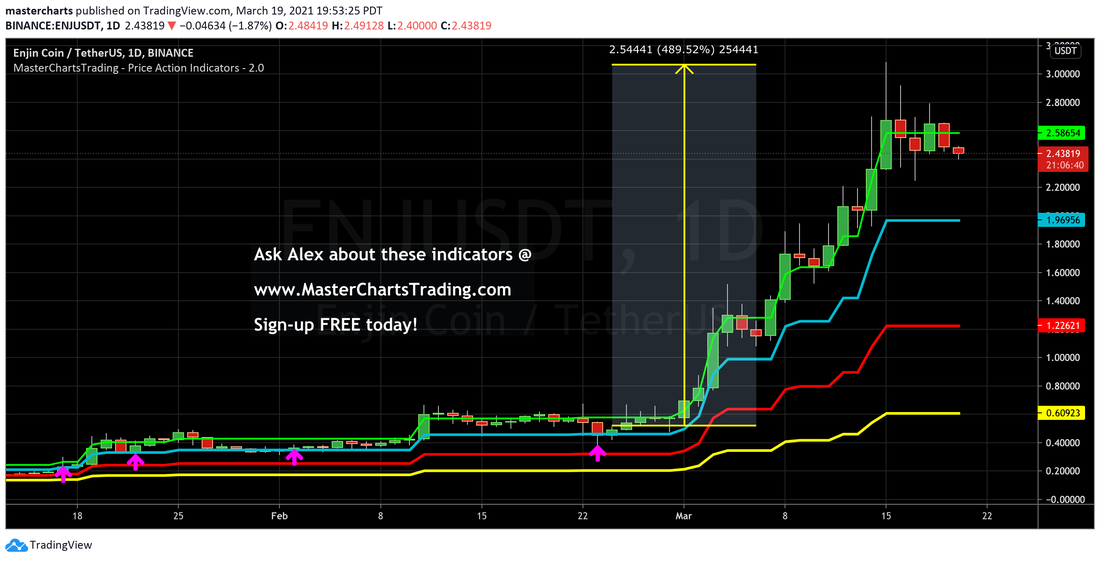
​
•Crypto review

Sign-up to get the Trading Indicators and Alerts

Follow me on Twitter, StockTwits, YouTube, TradingView, Stockcharts, and FaceBook!

Watch this video on YouTube!​
Picture
Ready to trade? Sign-up Today
4 Comments
John Robinson
2/16/2019 01:24:33 pm

What do your red, blue, etc. lines measure?
What is your conclusion when the blue line suddenly came down and the price went up to meet and then pass the blue line?

Reply
Alexander Berger link
2/17/2019 04:20:23 pm

My indicator lines https://www.tradingview.com/u/mastercharts/#published-scripts are mathematically calculated.

They show two things:
1. Trend of the instrument you are trading.
2. Price action around the indicator lines. Especially price action around the Blue and the Red lines, show what large players are doing (buying or selling).

If a security is bearish (price has closed below the Yellow or the Red line), and then the lines start coming down towards price action, and we see a close above the Blue line, this is usually a sign that the trend has changed to the Bullish one.

I like when the lines come down towards price action, such as on this chart of GDX: https://www.tradingview.com/x/1bd7Lbxu/ .

In this case, the price has less distance to travel towards the bullish levels (above the Blue line).

A close above the Blue line is a signal for me to enter long (buy)

-Alex

Reply
John Robinson
2/17/2019 05:39:14 pm

Thank you. I appreciate your market summaries.

Reply
indira
7/10/2020 04:20:11 am

Hi. Great comment. I don’t have all the answers. My thoughts are as follows:
1) If Feb or Dec 2018 caused massive losses then… you traded too big and too aggressively.
Many people (not me) actually made money in those months.
2) I don’t think there’s any other way to trade than to pick your spots and be patient.
You’re also reducing risk by being patient.
I trade much less frequently than I used to, yet my results are the same (and I have less stress).
If you’d like to discuss, you’re welcome to book a call https://beststockstrategy.thrivecart.com/30-minute-call/
or take the alerts at
https://beststockstrategy.com/memberships/

Reply


Leave a Reply.

    Picture
    Picture
    Subscribe to our mailing list!
    Picture
    Picture

    Archives

    February 2023
    January 2023
    December 2022
    November 2022
    October 2022
    September 2022
    August 2022
    July 2022
    June 2022
    May 2022
    April 2022
    March 2022
    February 2022
    January 2022
    December 2021
    November 2021
    October 2021
    September 2021
    August 2021
    July 2021
    June 2021
    May 2021
    April 2021
    March 2021
    February 2021
    January 2021
    December 2020
    November 2020
    October 2020
    September 2020
    August 2020
    July 2020
    June 2020
    May 2020
    April 2020
    March 2020
    February 2020
    January 2020
    December 2019
    November 2019
    October 2019
    September 2019
    August 2019
    July 2019
    June 2019
    May 2019
    April 2019
    March 2019
    February 2019
    January 2019
    December 2018
    November 2018
    October 2018
    September 2018
    August 2018
    July 2018
    June 2018
    May 2018
    April 2018
    March 2018
    February 2018
    January 2018
    December 2017
    November 2017
    October 2017
    September 2017
    August 2017
    July 2017
    June 2017
    May 2017
    April 2017
    March 2017
    February 2017
    January 2017
    December 2016
    November 2016
    October 2016
    September 2016
    August 2016
    July 2016
    June 2016
    May 2016
    April 2016
    March 2016
    February 2016
    January 2016
    December 2015
    November 2015
    October 2015
    September 2015
    August 2015
    July 2015
    June 2015
    May 2015
    April 2015
    March 2015
    February 2015
    January 2015
    December 2014
    November 2014
    October 2014
    September 2014
    August 2014
    June 2014
    May 2014
    April 2014
    March 2014
    February 2014
    January 2014

    RSS Feed

  All information on MasterChartsTrading.com is for educational and entertainment purposes only, and should not be construed as a recommendation to buy, sell or sell-short said securities. Read full disclaimer.